Spectroscopic Confirmation Of An Extreme Starburst At Redshift 4.547*
Abstract
We report the spectroscopic confirmation of a sub-mm galaxy (SMG) at with an estimated L. The spectra, mid-IR, and X-ray properties indicate the bolometric luminosity is dominated by star formation at a rate of M. Multiple, spatially separated components are visible in the Ly-Alpha line with an observed velocity difference of up to km/sec and the object morphology indicates a merger. The best fit spectral energy distribution and spectral line indicators suggest the object is 2-8 Myr old and contains M☉ of stellar mass. This object is a likely progenitor for the massive early type systems seen at .
Subject headings:
galaxies: evolution, galaxies: formation, galaxies: high-redshift, galaxies: interactions, galaxies: starburst, submillimeter1. Introduction
The study of galaxies detected at millimeter (mm) and sub-mm wavelengths is one of the most rapidly developing fields in observational astronomy. It is now known that a large fraction of the star formation activity is enshrouded in dust, with the star formation rate (SFR) being directly proportional to the far infrared (FIR) luminosity of galaxies, modulo possible contributions from an Active Galactic Nuclei (AGN)(Hughes et al., 1998). Surveys performed at mm wavelengths directly probe the FIR luminosity, and hence the amount of star formation. Furthermore, the shape of the galaxy spectral energy distributions (SEDs) at rest-frame mm wavelengths results in a negative K-correction between . Therefore a flux limited survey is equivalent to a SFR limited survey at these redshifts (Blain et al., 2002).
The current redshift distribution of mm galaxies peaks at , with very few galaxies at (Chapman et al., 2005; Pope et al., 2005; Aretxaga et al., 2007). However, the small bandwidth of current mm wave spectrographs makes it very difficult to measure redshifts directly, and the low angular resolution of mm single dish imaging leads to multiple optical candidates for the same source. As a result, mm surveys have relied on high resolution radio data to identify the optical counterparts for subsequent spectroscopic follow-up. This leaves % of the population of mm-selected galaxies at milli-Jansky flux levels unidentified and potentially at higher redshift (Wang et al., 2007; Younger et al., 2007).
In this paper we report the discovery of a mm galaxy with a spectroscopic redshift of that appears to be dominated by star formation. This is the highest redshift galaxy detected at mm wavelengths not associated with an optically bright quasar. The object was independently selected as a Lyman-break galaxy (Lee et al., 2008) for spectroscopic followup, a mm source, and a radio source (Carilli et al., 2008). The source reported here is unusual for mm sources because it has several nearby optically bright counterparts which were selected as V band dropouts and is unusually luminous which allows for a radio detection. However, the confirmation of this object suggests the population of sources with similar radio to mm flux ratios and optical colors may also be at high redshifts.
We assume a H, , cosmology and a star formation rate integrated across a Salpeter (1955) IMF from 0.1-100 throughout this paper.
2. Data
Observations at mm with an average RMS noise of 1.3mJy were obtained with the AzTEC (Wilson et al., 2008) camera at the the James Clerk Maxwell Telescope (JCMT) (Scott et al., 2008). Additional observations were obtained by the MAMBO camera on the IRAM 30m telescope with an RMS of 0.67 mJy and a positional accuracy of (Schinnerer et al. in prep). Ground based optical and near infrared imaging in 22 bands, Hubble Space Telescope, Spitzer, and Very Large Array images were obtained as part of the COSMOS survey as described in Capak et al. (2007), Scoville et al. (2007), Sanders et al. (2007), and Schinnerer et al. (2007) respectively. Additional deep J and data were obtained with the UKIRT, and CFHT telescopes as part of the COSMOS survey (McCraken et al. in prep). X-ray data were obtained with the Chandra X-ray observatory as part of the C-COSMOS program (Elvis et al. in prep). The respective fluxes are tabulated in Table 1.
| Wavelength | Flux (Jy)++All limits are limits. |
|---|---|
| 0.2-8Kev | ergs cm-2 |
| 150nm (FUV) | |
| 250nm (NUV) | |
| 380nm () | |
| 427nm | |
| 446nm () | |
| 464nm | |
| 478nm () | |
| 484nm | |
| 505nm | |
| 527nm | |
| 548nm () | |
| 574nm | |
| 624nm | |
| 630nm () | |
| 679nm | |
| 709nm | |
| 711nm | |
| 738nm | |
| 764nm () | |
| 767nm | |
| 815nm | |
| 827nm | |
| 904nm () | |
| 1.25m (J) | |
| 2.15m () | |
| 3.6m | |
| 4.5m | |
| 5.8m | |
| 8.0m | |
| 24m | **A nearby bright source was modeled and subtracted to make this measurement, the formal upper limit is Jy if the nearby source is not subtracted. |
| 1.1mm | |
| 1.25mm | |
| 20cm |
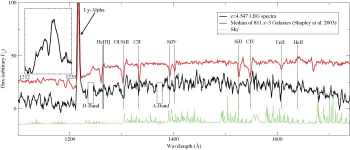
The optical spectra were taken on the Keck-II telescope using the DEIMOS instrument with a 1′′ slit width, the 830 line/mm grating (3.3Å FWHM resolution), and the OG550 blocking filter to optimize red throughput. The data were collected in eight 1800s exposures (4h total integration) under photometric conditions with 0.4-0.6′′ seeing. The object was dithered along the slit by between exposures to improve background subtraction. The data were reduced with a modified version of the DEEP2 DEIMOS pipeline (Marinoni et al., 2001). In addition to the standard processing this modified pipeline constructs and subtracts a median background and accounts for the shifts when combining the spectra. These additional steps remove the ”ghosting” inherent to the 830l/mm grating.
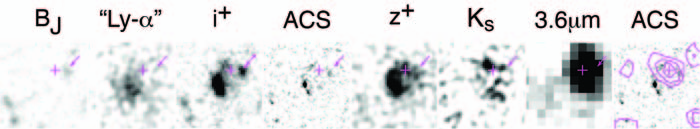
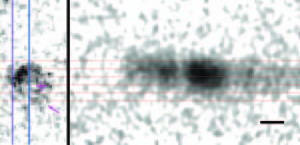
An image of the continuum and Ly- emission is shown in Figure 1, and indicates emission from all components of the source. The 2-D and 1-D spectra are shown in Figures 2 and 3 respectively. Ly emission is detected from both the compact and extended portions of the object with a velocity gradient across the slit. Ly- emission from the diffuse region is redshifted with respect to the compact source, and a deep Ly absorption feature is present at a redshift corresponding to other absorption features seen in the spectra. The dispersion of distinct peaks in the Ly- emission is km s-1 and the line asymmetry indicates outflow winds of up to km s-1, typical of a merger with heavy star formation. Several interstellar absorption features are clearly seen in the continuum yielding a best fit redshift of , but the dispersion in the Ly- line suggests some components could be from the continuum redshift.
A foreground object with an band flux of Jy is visible to the west of our source in the B band image (see Figure 1) and its spectrum shows [O II] emission at . The mass of this system is too low to significantly gravitationally lens our system and it is unlikely that the mm flux originates from this source because the object is outside the radio and Spitzer positional error and has an SED which indicates little obscuration. Furthermore, if the source of the mm emission is at the 24m, mm, and radio flux place the far infrared luminosity at and the dust temperature at less than K, which is physically unreasonable (Solomon & Vanden Bout, 2005; Dale & Helou, 2002; Carilli & Yun, 1999).
3. Pan-Chromatic Properties and Morphology
The rest-frame ultraviolet (UV) properties indicate a merger, typical of star-forming mm sources seen at (Chapman et al., 2005; Pope et al., 2005; Aretxaga et al., 2007). At least two distinct components are visible in the ACS image, and a region of extended emission is visible in the ground based and images which are more sensitive to extended emission than the HST data. The rest frame UV is centered at 10:00:54.516, +2:34:35.17 with the radio and rest frame optical emission centered at 10:00:54.48, +2:34:35.9.
| Emission | Age | Av | Mass | UV SFR | Model | |
|---|---|---|---|---|---|---|
| Source | (Myr) | () | () | |||
| Diffuse | 6.5 | 1.4 | 24.3 | M05 | ||
| 7.6 | 1.5 | 24.7 | BC03 | |||
| Compact | 2.5 | 0.0 | 54.5 | M05 | ||
| 2.9 | 0.0 | 55.7 | BC03 |
The majority (73%) of the rest frame UV flux originates from a compact (kpc) knot of emission at the south east corner of the object, with the remaining UV emission extended over 17.7 kpc (2.7′′ ), while the rest-frame optical (Spitzer-IRAC) flux of the source is centered on the diffuse UV and radio emission. The IA679 filter corresponds to the rest frame Ly- line and shows strong emission from all components of the source and an extended Ly- halo around the source (see Figure 1). In addition, a significant excess of flux is measured in the 3.6m band which is centered on the H line at . The Ly- image, the 3.6m excess, and the optical-IR colors of the diffuse region are consistent with all components residing at .
The possible presence of H in the 3.6m band and [O II] in the Ks band combined with the low S/N of the J band and multiple components with different SEDs make it difficult to constrain the age and mass of this object with stellar models because the 4000Å break strength is degenerate with the line ratio in some cases. To reduce these degeneracies H and [O II] line flux is added to the stellar models in proportion to the unobscured UV star formation rate (Kennicutt, 1998). The diffuse portion of the source fades rapidly between the Ks and bands, indicating significant obscuration. The UV compact region is not detected redwards of the band, indicating a very young ( Myr old) stellar population and little dust obscuration.
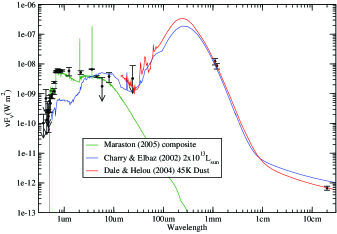
A two component fit to the total integrated light produced poor results. The UV and optical light are spatially separated, but the best fit model places the majority of both the UV and optical light in a single un-obscured Gyr old population. To overcome this degeneracy we attempt to deconvolve the UV bright knot and the diffuse component of the source. Flux measurements were made in all of the ground based images for the UV diffuse portion of the source using a 1′′ diameter aperture on the original stacked images without PSF matching (Capak et al., 2007). An aperture correction of 1.4 magnitudes, based on the ACS morphology, was then applied. A Maraston (2005) (M05) or Bruzual & Charlot (2003) (BC03) single burst model with solar metallicity, a Salpeter IMF and a Calzetti et al. (2000) extinction law were then fit to these and the IRAC measurements. The model fluxes were then subtracted from the total flux, and a second model was fit to the remaining flux. The resulting fits are tabulated in Table 2 and shown in Figure 4.
The present data do not constrain the peak or shape of the FIR emission, so the total luminosity is uncertain, but the mm and m data imply an infrared luminosity of , and a corresponding star formation rate (SFR) of (Dale & Helou, 2002; Chary & Elbaz, 2001; Carilli & Yun, 1999). The radio flux gives a second estimate of the SFR independent of dust obscuration at assuming a radio spectral slope of -0.8 (Kennicutt, 1998). Finally, assuming the excess flux in the 3.6m band is due to H originating from the diffuse component, we derive a dust corrected star formation rate of (Calzetti et al., 2000; Kennicutt, 1998), in good agreement with the UV, but lower than the mm, and radio determined values. This last measurement is largely independent of the models because the H flux was fixed to the model star formation rate rather than fit as an extra parameter.
The bolometric luminosity of this source appears to be dominated by star formation. The UV and radio morphology suggest a star formation rate density of , within the range of locally observed starbursts (Solomon & Vanden Bout, 2005; Sanders & Mirabel, 1996). However, without a high resolution map of the mm emission and gas it is not possible to form a clear picture of how the star formation is distributed. No X-ray flux is detected in a 200ks Chandra exposure placing the X-ray to FIR luminosity ratio in the star formation dominated regime (Alexander et al., 2005, 2003), and the radio to FIR flux ratio falls on the local starburst relation (Yun et al., 2001). However, the limit on the X-ray to radio luminosity ratio does not rule out an AGN . The SFR inferred by the diffuse UV and optical emission can explain the FIR emission if the two are spatially related. Finally, the Ly- line is narrow and AGN emission lines such as broad C IV or N V are not observed in the optical spectra, so any AGN must either be heavily obscured and/or outside the spectrograph slit.
4. Implications for galaxy formation
This object is a likely progenitor for the massive (M☉) old (Gyr) early type systems seen in large numbers at (McGrath et al., 2007; Kong et al., 2006; Daddi et al., 2005; Cimatti et al., 2004). The morphology and spectral properties of the passive galaxies indicate they formed in a single burst at (Cimatti et al., 2008; Stockton et al., 2008; Daddi et al., 2005). However, the density of passive systems is (Kong et al., 2006; Daddi et al., 2005), which is too high to be explained by the previous mm source redshift distribution (Cimatti et al., 2008).
The discovery of this object and other recent studies suggest the fraction of mm sources may be higher than previously thought. An 850m flux limited sample is equivalent to a star formation rate limited sample at and the objects must have formed by in order to have sufficient time to evolve into passive systems. With this redshift range and a star formation duration (duty cycle) of 50Myr, a surface density of objects per square degree is required for these sources to be progenitors of the passive galaxy population. Objects brighter than 4mJy at 850m would have a sufficiently high SFR to form M☉ passive systems within 50Myr and the density of such sources is sufficient to form the passive galaxies if of them are at (Borys et al., 2003). This fraction is well within the range recent studies place at (Younger et al., 2007; Wang et al., 2006; Chapman et al., 2005) .
References
- Alexander et al. (2003) Alexander et al., 2003, AJ, 125, 383
- Alexander et al. (2005) Alexander et al., 2005, ApJ, 632, 736
- Aretxaga et al. (2007) Aretxaga et al., 2007, MNRAS, 379, 1571
- Blain et al. (2002) Blain et al. 2002, Phys. Rep., 369, 111
- Borys et al. (2003) Borys et al., 2003, MNRAS, 344, 385
- Bruzual & Charlot (2003) Bruzual, G., & Charlot, S. 2003, MNRAS, 344, 1000
- Calzetti et al. (2000) Calzetti et al., 2000, ApJ, 533, 682
- Capak et al. (2007) Capak et al. 2007, ApJS, 172, 99
- Carilli et al. (2008) Carilli et al., 2008, ApJ
- Carilli & Yun (1999) Carilli, C. L., & Yun, M. S. 1999, ApJ, 513, L13
- Chapman et al. (2005) Chapman et al., 2005, ApJ, 622, 772
- Chary & Elbaz (2001) Chary, R., & Elbaz, D. 2001, ApJ, 556, 562
- Cimatti et al. (2008) Cimatti et al., 2008, ArXiv e-prints, 801
- Cimatti et al. (2004) Cimatti et al., 2004, Nature, 430, 184
- Daddi et al. (2005) Daddi et al., 2005, ApJ, 626, 680
- Dale & Helou (2002) Dale, D. A., & Helou, G. 2002, ApJ, 576, 159
- Hughes et al. (1998) Hughes et al., 1998, Nature, 394, 241
- Kennicutt (1998) Kennicutt, Jr., R. C. 1998, ARA&A, 36, 189
- Kong et al. (2006) Kong et al., 2006, ApJ, 638, 72
- Lee et al. (2008) Lee et al., 2008, ApJ
- Maraston (2005) Maraston, C. 2005, MNRAS, 362, 799
- Marinoni et al. (2001) Marinoni et al., 2001, ArXiv Astrophysics e-prints
- McGrath et al. (2007) McGrath, E. J., Stockton, A., & Canalizo, G. 2007, ApJ, 669, 241
- Pettini et al. (2000) Pettini et al., 2000, ApJ, 528, 96
- Pope et al. (2005) Pope et al., 2005, MNRAS, 358, 149
- Salpeter (1955) Salpeter, E. E. 1955, ApJ, 121, 161
- Sanders & Mirabel (1996) Sanders, D. B., & Mirabel, I. F. 1996, ARA&A, 34, 749
- Sanders et al. (2007) Sanders et al., 2007, ApJS, 172, 86
- Schinnerer et al. (2007) Schinnerer et al. 2007, ApJS, 172, 46
- Scott et al. (2008) Scott et al., 2008, MNRAS, 385, 2225
- Scoville et al. (2007) Scoville et al., 2007, ApJS, 172, 38
- Shapley et al. (2003) Shapley et al., 2003, ApJ, 588, 65
- Solomon & Vanden Bout (2005) Solomon, P. M., & Vanden Bout, P. A. 2005, ARA&A, 43, 677
- Stockton et al. (2008) Stockton et al., 2008, ApJ, 672, 146
- Wang et al. (2006) Wang, W.-H., Cowie, L. L., & Barger, A. J. 2006, ApJ, 647, 74
- Wang et al. (2007) Wang et al., 2007, ApJ, 670, L89
- Wilson et al. (2008) Wilson et al., 2008, MNRAS, 386, 807
- Younger et al. (2007) Younger et al., 2007, ApJ, 671, 1531
- Yun et al. (2001) Yun, M. S., Reddy, N. A., & Condon, J. J. 2001, ApJ, 554, 803