Optically tunable surfaces with trapped particles in microcavities
Abstract
We introduce optically tunable surfaces based upon metallic gold nanoparticles trapped in open, water-filled gold cavities. The optical properties of the surfaces change dramatically with the presence and location of the particles inside the cavities. The precise position of the particles is shown to be controllable through optical forces exerted by external illumination, thus leading to all-optical tunability, whereby the optical response of the surfaces is tuned through externally applied light. We discuss the performance of the cavity-particle complex in detail and provide theoretical support for its application as a novel concept of large-scale optically tunable system.
pacs:
73.20.Mf, 78.68.+m, 78.67.BfThe last decade has witnessed tremendous progress in optical trapping and manipulation of small particles with a wide range of applications ranging from physics and engineering to biology and medicine A1997 ; G03 . One of the most fascinating domains of those applications is directly related to the possibility of controlling and tuning the optical response of nanoscale systems, thus opening the field to bio-sensing and all-optical switching. Early attempts to bind small particles using light forces A1970 ; AD1975 ; A1980 ; AD1987 ; BFG led to the development of optical tweezers A1970 ; AD1987 , capable of trapping and aligning objects ranging from micro-organisms AD1987 to metallic nanoparticles HBH05 ; PLK06 . Manipulation of micro-particles using plasmons has been recently demonstrated as well RZG07 , whereas fine tuning of nanoparticle positions has been theoretically proved to be realizable by coupling to plasmonic nanostructures NBX97 ; paper126 .
In this Letter, we investigate the optical tunability performance of cavity-nanoparticle systems. More precisely, we consider an open metallic cavity in an otherwise flat gold surface surrounded by water and containing a gold nanorod in its interior. The nanoparticle is the key to purposely modify the optical response of the cavity-particle composite system. More precisely, we demonstrate through theoretical simulations the possibility of optically-trapping the particle at positions that depend on the wavelength of externally incident light, thus producing tunable changes in the optical response of the system. The driving optical force can be used to displace the trapped particle at will inside the cavity, which results in changes of the surface reflectivity. All calculations presented here, are performed using the boundary-element method, which we push to full converge within the scale of the figures BEM .
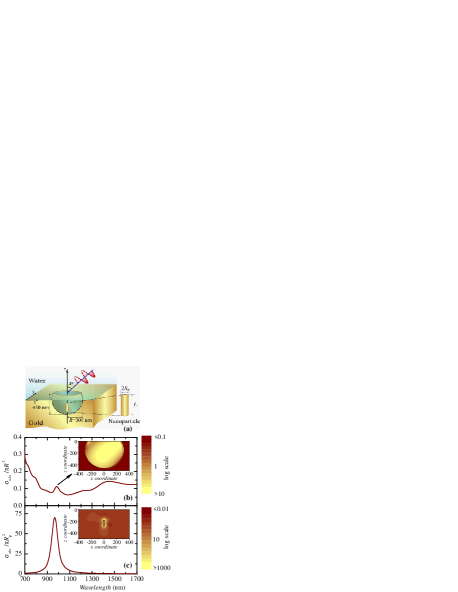
The optical properties of spherical nanocavities in planar gold surfaces are well understood from the experimental and theoretical points of view CNB01 ; paper128 , leading to such phenomena as omnidirectional total absorption of light paper150 . We consider in particular a cavity of radius and depth immersed in water, as shown in Fig. 1(a). The system is illuminated with -polarized light incident with an angle of with respect to the flat gold surface. The cavity exhibits resonances associated to trapped modes paper128 , which appear as sharp peaks in the absorption spectrum [see Fig. 1(b)]. In particular, the pronounced resonance at is associated to a near-field intensity distribution with an important localization at the center of the cavity [see inset of Fig. 1(b)], implying the possibility of strong interaction with the corresponding plasmon modes of any nanoparticle placed in that region. The nanoparticle itself will obviously exhibit plasmon modes, which can be tuned close to the cavity resonance wavelength. Gold nanorods are good candidates for that purpose, since their longitudinal plasmon modes can be easily excited BH98 . The wavelength position of these resonance modes depends strongly on the dimensions of the cylindrical rod, denoted here as . An example is given in Fig. 1(c) for a gold nanorod. A longitudinal plasmon is clearly observed at .
When the particle is placed inside the cavity, the interaction between their respective plasmon resonances will depend on the overlap between their associated fields. We will assume for simplicity that the particle is aligned along the rotational axis of the cavity (the axis), and therefore strong overlap will occur for cavity modes localized at the center of a cavity such as that of Fig. 1(b). Let us first assume that the rod is in the center of the cavity (i.e., away from the opening), close to the maximum of the cavity-mode intensity. The interaction between cavity and rod gives rise to two distinct peaks in the absorption spectrum of the composite system that are displaced with respect to the non-interacting cavity and rod modes. For instance, we observe modes at wavelengths and for the gold nanorod, far away from the initial resonances of the two individual constituents of the system, formerly at wavelengths of (rod) and (cavity), as shown in Fig. 1. The aspect ratio (AR) of the rod plays a crucial role for the wavelength position of these two resonances, as the longitudinal mode of the nanorod can be swapped over a wavelength interval around the cavity mode wavelength for varying AR. This is illustrated in Fig. 2(a), where an avoided crossing is clearly discernible.
In a quantum-mechanical analogy M1966 , we can assume that the cavity-nanoparticle composite system is governed by an effective Schrödinger equation of the form , where the Hamiltonian is the operator of the cavity-nanoparticle composite; is the operator describing the individual constituents of the system with eigenstates (cavity mode) and (rod mode) and corresponding eigenvalue frequencies and ; describes the interaction between cavity and particle; and we can approximate the state of the system as , that is, the hybridization of cavity and particle modes with superposition coefficients and , respectively. We can safely assume a linear dependence of the hopping parameter on the AR of the rod (i.e. ), and find that the two eigenfrequencies of the composite system are given by
| (1) |
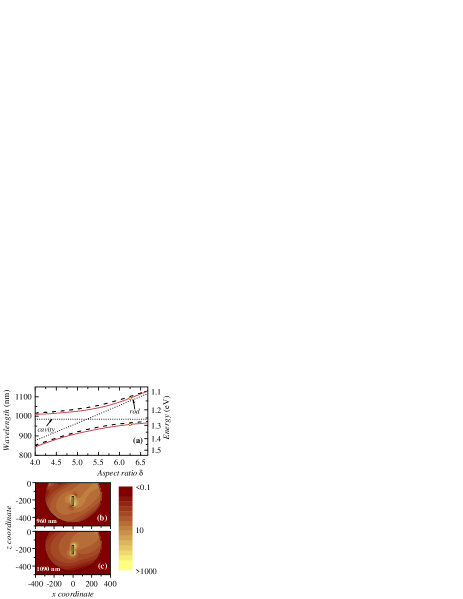
The quantities and are to be determined by fitting Eq. (1) to the values found numerically from the absorption spectra of Fig. 2(a), which are represented as solid curves in Fig. 3(a). We find and , and the analytical values of Eq. (1) for using these parameters are also shown for comparison [dashed curves in Fig. 3(a)].
The hybridization can be also observed in the near-field plots at the resonance wavelengths of the composite system. An example is given in Figs. 3(b) and (c) for the rod. The near-field plots clearly show a rod-like and a cavity-like profile at the corresponding resonance wavelengths of and [cf. insets in Figs. 1(b) and (c)], since they are located close to the single-rod () and single-cavity () modes, respectively. We intend to obtain significant changes in the resonance wavelength of the composite system triggered by the presence of the nanoparticle, and thus, we need to work close to the crossing point () of the single-rod and single-cavity modes [i.e., with AR , according to Fig. 3(a)] in order to maximize mode repulsion, approximately given by . Therefore, we will consider rods in what follows.
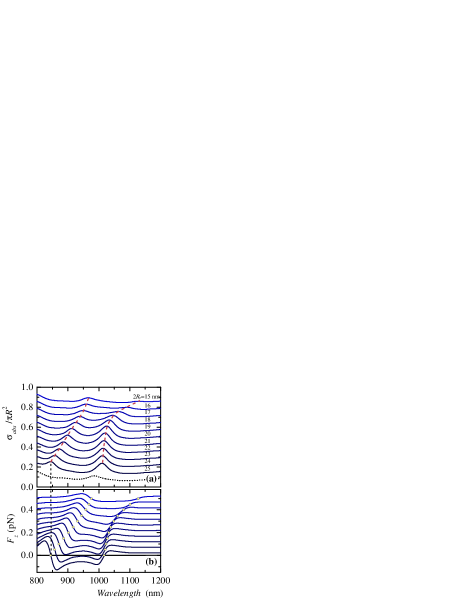
The observed change in the optical response of the cavity due to the presence of the nanorod in its interior cannot be realizable if we do not have a tool to keep the nanoparticle trapped inside the cavity at a designated position. In fact, our system offers such a possibility as we show next. We calculate the optical force exerted on the particle for a given external illumination following the methods described for instance in Ref. paper089 . Hereafter, we will only be concerned with the -component force, , assuming that its -component is canceled out by adding a second external light beam propagating to the opposite -direction with respect to the first one (i.e., the two beams are symmetrically placed with respect to the -plane). We represent in Fig. 2(b) the force acting on the nanorods considered in Fig. 2(a) for an external light-intensity of . The magnitude of the force is large enough to overcome effects due to friction or Brownian motion, which typically contribute with forces of a few forces . Also notice that the force is proportional to the light intensity, so that even much weaker incident illumination will produce sufficient trapping stability, particularly if one is concerned with the response of a statistically large number of cavities, as it is the case in macroscopic surfaces CNB01 .
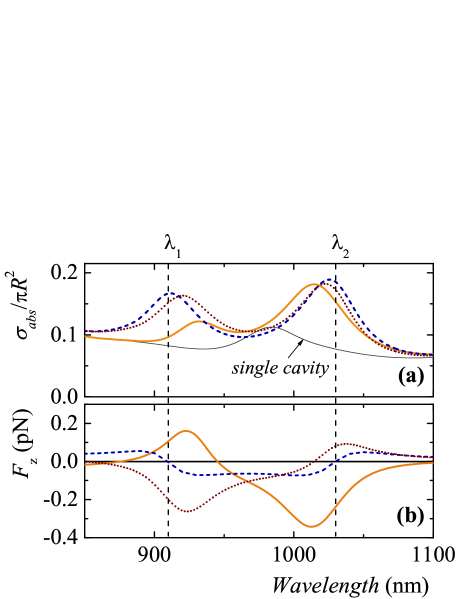
The absorption spectrum of the cavity-rod system is quite sensitive to changes in the position of the rod along the axis, as expected from the degree of overlap between the particle and the cavity mode intensity [see Fig. 1(b)]. This is illustrated in Fig. 4(a). Our system is thus a good candidate to exhibit all-optical tunability: the use of optical forces exerted on the particle through external illumination can displace the nanorod along the axis to trigger changes in the absorption/reflection of the system. We show in Fig. 4(b) these forces, calculated for an external light intensity of . Three different rod positions along the axis are considered (, and from the cavity aperture). For the first resonance mode located at lower wavelengths, the force is directed downwards when the particle lies at the deepest position (dotted curves), and it changes to upwards at less deep positions (dashed and solid curves). Considering for example an operating wavelength , the optical force can remove the particle from the cavity, thus changing the absorption of the composite system from to (see left vertical dashed line in Fig. 4). The opposite happens for the second resonance mode located at higher wavelengths: the force is directed downwards when the rod is placed close to the top of the cavity (solid curves), thus pushing the particle downwards. For an operating wavelength (see right vertical dashed line in Fig. 4) the trapping of the particle becomes possible inside the cavity.
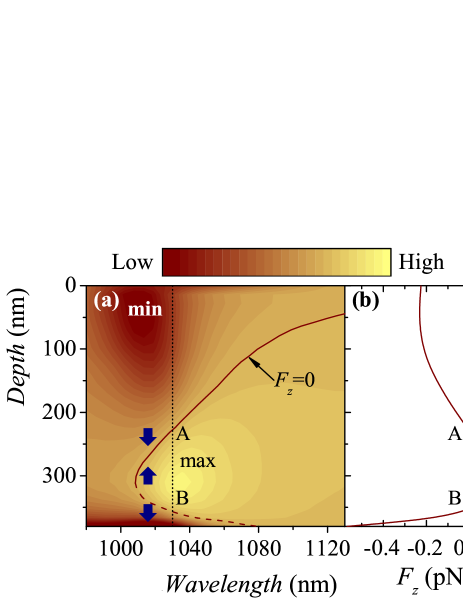
This is demonstrated in more detail in Fig. 5. The component of the force acting on the rod placed at different depths inside the cavity is shown for different wavelengths in Fig. 5(a) (light intensity equal to ). The force surface-map exhibits stable and unstable equilibrium (zero-force) points, denoted by solid and dashed curves in the figure, respectively. Stable trapping of the rod at a given depth inside the cavity occurs when the force changes direction from positive to negative when moving from below to above that depth. Consequently, this will be the case for wavelengths in the range and for points lying on the stable-equilibrium line [solid curve in Fig. 5(a)]. As an example, we choose the wavelength of . The corresponding depth-profile force is depicted in Fig. 5(b). For this specific wavelength, point A (depth) represents a trapping position for the rod, while point B (depth) is an anti-trapping position.
In conclusion, we have shown that composite systems formed by gold nanoparticles trapped inside water-filled gold nanocavities exhibit large variations in optical absorption as a function of the position of the particle inside the cavity. Optical forces acting on the particle have been shown to be sufficiently large to move the particles around, and in particular, positions and illumination wavelengths have been identified that lead to stable particle trapping. The combined cavity-nanoparticle system is thus tunable via the wavelength of a pump light source, which triggers dramatic changes in the reflectance spectrum experienced by a second probing light source. Our findings are thus opening a new path towards all-optical switching.
Acknowledgements.
This work was supported by the Spanish MEC (NAN2004-08843-C05-05 and MAT2007-66050) and by the EU-FP6 (NMP4-2006-016881 ”SPANS”).References
- (1) D. G. Grier, Nature 424, 810 (2003).
- (2) A. Ashkin, Proc. Natl. Academ. Sci. 94, 4853 (1997).
- (3) A. Ashkin, Phys. Rev. Lett. 24, 156 (1970).
- (4) C. A. Ashley and S. Doniach, Phys. Rev. B 11, 1279 (1975).
- (5) A. Ashkin, Science 210, 1081 (1980).
- (6) A. Ashkin and J. M. Dziedzic, Science 235, 1517 (1987).
- (7) M. M. Burns, J. M. Fournier, and J. A. Golovchenko, Phys. Rev. Lett. 63, 1233 (1989); Science 249, 749 (1990).
- (8) P. M. Hansen et al, Nano Lett. 5, 1937 (2005).
- (9) M. Pelton et al, Opt. Lett. 31, 2075 (2006); M. Righini et al, Phys. Rev. Lett. 100, 186804 (2008).
- (10) M. Righini et al, Nat. Phys. 3, 477 (2007).
- (11) L. Novotny, R. X. Bian, and X. S. Xie, Phys. Rev. Lett. 79, 645 (1997).
- (12) F. J. García de Abajo, T. Brixner, and W. Pfeiffer, J. Phys. B 40, S249 (2007).
- (13) F. J. García de Abajo and A. Howie, Phys. Rev. Lett. 80, 5180 (1998); Phys. Rev. B 65, 115418 (2002).
- (14) S. Coyle et al, Phys. Rev. Lett. 87, 176801 (2001).
- (15) R. M. Cole et al, Nano Lett. 7, 2094 (2007).
- (16) T. V. Teperik et al, Nat. Phot. 2, 299 (2008).
- (17) C. F. Bohren and D. R. Huffman, Absorption and Scattering of Light by Small Particles (Wiley-Interscience, New York, 1983).
- (18) A. Messiah, Quantum Mechanics (North-Holland, New York, 1966).
- (19) F. J. García de Abajo, J. Quant. Spectrosc. Radiat. Transfer 89, 3 (2004).
- (20) At room temperature and for distances of the order of (i.e., of the order of the cavity size), the thermal force can be roughly estimated from to be of the order of , where is the Boltzman constant.