Bulk-like band of SrVO3 under a self-protective cap layer
Abstract
We have performed a detailed angel-resolved photoemission spectroscopy study of in-situ prepared SrVO3 thin films. Naturally capped by a “transparent” protective layer, contributions from surface states centered at eV are dramatically reduced, enabling us to study the bulk V states. We have observed a clear band dispersion not only in the coherent quasiparticle part but also in the incoherent part, which are reproduced by dynamical mean-field theory calculations and the spectral weight of the incoherent part is stronger within the Fermi surface.
pacs:
71.18.+y, 71.27.+a, 71.30.+h, 79.60.DpMetal-insulator transition (MIT) has been extensively studied because of its fundamental importance in condensed matter physics MIT . To study bandwidth-control MIT, perovskite-type oxides ABO3 having formally the electronic configuration are ideal systems and have been studied extensively Fujimori-d1 ; CSVO-Inoue1 ; CSVOpes-Inoue . In ABO3, the bandwidth is controlled through the modification of the radius of the A-site ion, and hence the B-O-B bond angle . On the theoretical side, the recent development of dynamical mean-field theory (DMFT) has led to a major progress in understanding MIT in strongly correlated systems DMFT ; Sordi . According to DMFT, as increases, where is the on-site Coulomb energy, spectral weight is transferred from the coherent part [the quasiparticle band near Fermi level (EF)] to the incoherent part (the remnant of the Hubbard bands eV above and below EF) Zhang .
Ca1-xSrxVO3 (CSVO) is a typical bandwidth-controlled system, where the average -site ionic radius and hence the bandwidth can be continuously changed, although it remains metallic in the entire range CSVO-Inoue1 . Extensive studies on CSVO have been made to understand the evolution of the electronic structure as a function of but the result remains highly controversial till now. In an early photoemission spectroscopy (PES) study of CSVO, Inoue et al. CSVOpes-Inoue have reported that as one decreases in CSVO, that is, as one increases , spectral weight is transferred from the coherent part to the incoherent part centered 1.5 eV below EF. By measuring the photon-energy-dependent PES of CSVO, Maiti et al. CSVO-maiti have pointed out that the surface states are different from the bulk ones. Sekiyama et al. CSVO-Sekiyama have reported that the spectral weight of the incoherent part is considerably reduced and that spectral weight transfer is not observed in the PES spectra of CSVO taken using high energy photons, i.e., in so-called “bulk-sensitive” PES spectra. Another “bulk-sensitive” PES spectra using very low energy photons CSVO-Eguchi , however, has indicated small differences between SrVO3 (SVO) and CaVO3 (CVO) qualitatively consistent with Inoue et al. CSVOpes-Inoue . Moreover, a PES study using polarized and unpolarized photons has indicated that matrix-element effect is important and that there is finite spectral weight transfer from the coherent part to the incoherent part in going from SVO to CVO CSVO-maiti2 . A recent extended cluster-model analysis of the PES spectra, on the other hand, has suggested that contributions from the O states are more significant in the incoherent part than in the coherent part and that the reduction of spectral weight of the incoherent part at high photon energies is partly due to the effect of atomic-orbital cross-sections Mossanek . In contrast to the controversial results mentioned above, a recent angle-resolved photoemission spectroscopy (ARPES) study by Yoshida . SVO-yoshida have given clear-cut information. They successfully performed an ARPES study of cleaved bulk SVO crystals and observed the band dispersions of the coherent part SVO-yoshida . Recent DMFT calculations have given -resolved spectral functions and predicted a kink in the quasiparticle band dispersion due to the energy dependence of the self-energy Nekrasov ; Byczuk .
In the present work, we have fabricated SVO thin films having atomically flat surfaces using the pulsed laser deposition (PLD) technique and studied its detailed electronic structure by in-situ ARPES measurements. ARPES experiments on thin films prepared in-situ has recently turned out to have many advantage because their well-defined atomically flat surface enable us to obtain more detailed ARPES spectra LSMO2-chikamatsu ; PCMO-wadati . Such high-quality samples dramatically reduce surface states, and a clear dispersion of intrinsic origin can be observed.
The PES measurements were performed at BL-1C, 2C, and 28B of Photon Factory (PF), High Energy Accelerators Research Organization (KEK), using a combined laser molecular beam epitaxy-photoemission spectrometer system. Details of the experimental setup are described in Ref. Horiba . Epitaxial thin films of SVO were grown on single-crystal substrates of Nb-doped SrTiO3 by the PLD method. The substrates were annealed at 1050 ∘C under an oxygen pressure of Torr to obtain an atomically flat TiO2-terminated surface kawasaki . SVO thin films were deposited on the substrates at 900 ∘C under a high vacuum of Torr. The surface morphology of the measured SVO thin films was checked by ex-situ atomic force microscopy, showing atomically flat step-and-terrace structures. The crystal structure was characterized by four-circle X-ray diffraction, and a coherent growth on the substrate was confirmed. The in-plane lattice constant was Å, the same as that of SrTiO3, while the out-of-plane lattice constant was Å. All the PES measurements were performed in an ultrahigh vacuum of Torr at 20 K (unless otherwise noted) using a Scienta SES-100 electron-energy analyzer. The total energy resolution was set to about 30, 150, and 150-400 meV for the spectra near EF (BL-28B), in the entire valence-band region (BL-1C), and the spectra measured using soft x-rays (BL-2C), respectively. The EF position was determined by measuring gold spectra.
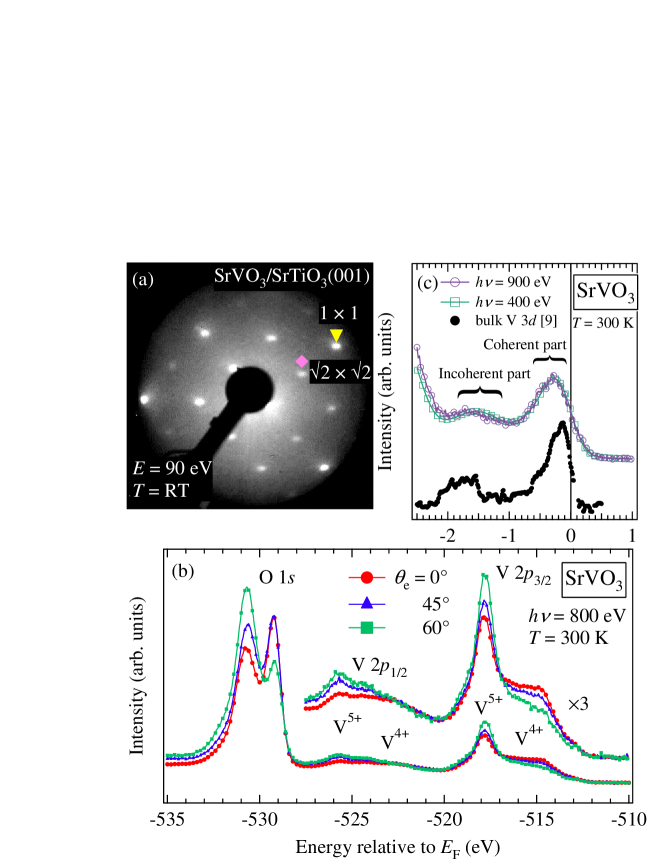
Results of the characterization of the surfaces of the SVO films thus prepared are shown in Fig. 1. As in Fig. 1 (a), low energy electron diffraction (LEED) patterns show sharp spots, with some super-structure spots of . For the O core level shown in Fig. 1 (b), one can see two components. Because we performed in-situ PES measurements, the strong high binding energy structure of O cannot be attributed to contaminations. For the V core level in the same panel, too, there appear two components which can be assigned to V4+ and V5+ Sawatzky . With increasing emission angle , i.e., with increasing surface sensitivity, the higher binding energy structure of O and the V5+ component increase. This indicates that the surface of the SVO thin films thus fabricated is covered with a “V5+ oxide” having a structure. From the emission-angle dependence of the intensity of the O and V emission, the thickness of the surface “V5+ oxide” layer is estimated to be 2 - 4 Å, consistent with a 0.5 - 1 unit cell thickness of SVO. The structure of the surface V5+ oxide layer is not known at present, but a possible candidate is a layer of one unit cell thickness with composition Sr0.5VO3 or SrVO3.5, where Sr vacancies or excess oxygen atoms form a super-lattice and V is oxidized to V5+.
As shown in Fig. 1 (c), the V spectra taken at 400 and 900 eV are identical to each other in spite of the different surface sensitivities. The relative intensity of the coherent part to the incoherent part is very high, similar to that of the “bulk” spectra reported in Refs. CSVO-Sekiyama ; CSVO-maiti ; CSVO-maiti2 . This fact indicates that contributions from surface states seen in the previous work CSVO-maiti ; CSVO-Sekiyama were strongly reduced in the present SVO thin films. Due to the suppression of the surface states, the V bulk electronic structures could be successfully investigated in APRES spectra, as we shall see below. Considering the observation of the surface reconstruction and the V5+ component in the V core-level spectra as shown in Fig. 1, we infer that the V5+-oxide capping layer has no electronic states within eV of EF, protects the surface of SVO and hence the V bands survive as in the bulk states within the band gap of the V5+ () oxide surface layer, just like in the case of the SrTiO3 capped LaTiO3 STOLTOtakizawa .
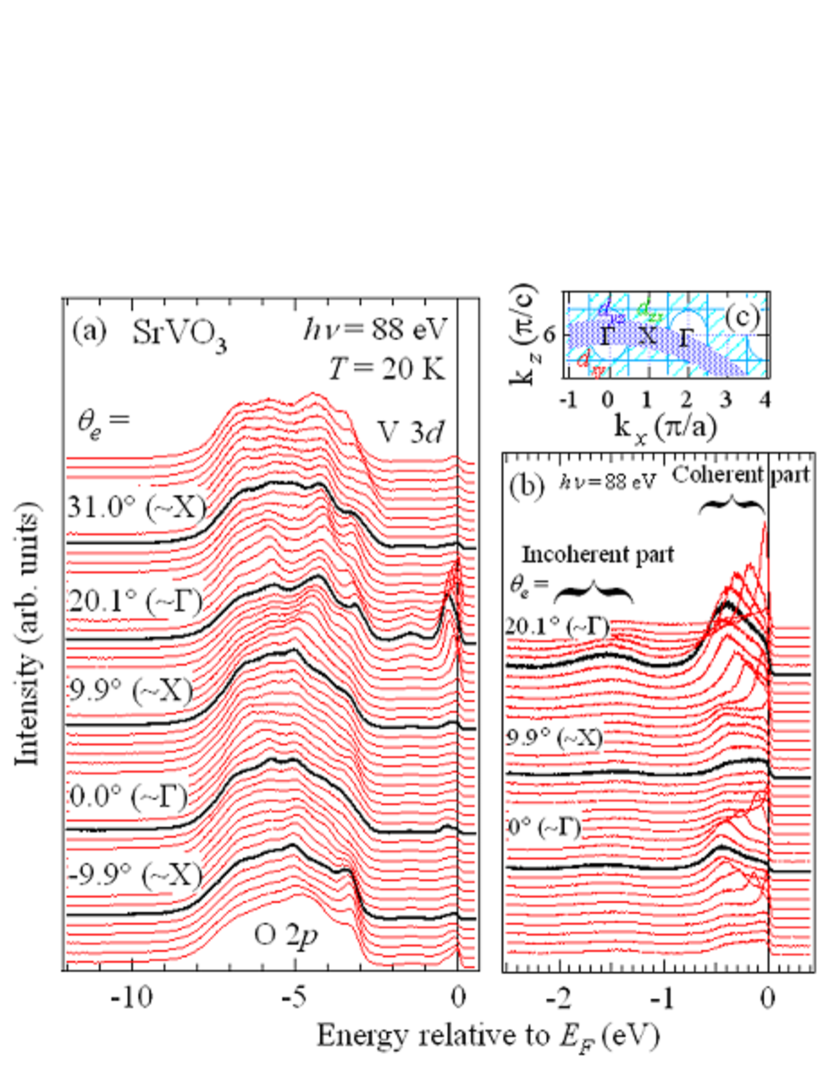
A series of ARPES spectra or energy distribution curves (EDCs) taken at 88 eV are shown in Fig. 2 (a) and (b) for various emission angles . The corresponding trace in -space is shown in Fig. 2 (c). Here, the free-electron final states, the work function of the sample eV, and the inner potential eV have been assumed to obtain the momentum perpendicular to the surface. Although is dependent on to some extent as shown in Fig. 2 (c), the ARPES spectra taken at 88 eV can be considered to trace the band in the - X direction since band dispersions along high symmetry lines are emphasized due to the finite width of and the high -resolved density of states around the high symmetry lines TB-wadati . For simplicity, we have also assumed the cubic Brillouin zone although the unit cell of SVO thin films is slightly distorted to the tetragonal structure (). Figure 2 (a) shows clear dispersions both in the O and V bands. The bands between eV to eV are mainly composed of O states while those between eV to EF mainly of V states. In the V band [Fig. 2 (b)], there are two features; the coherent part (the quasiparticle band near EF) and the incoherent part (regarded as the remnant of the lower Hubbard band). As reported previously SVO-yoshida , the coherent part shows clear dispersion. It should be noted that the coherent peak becomes much sharper and more intense than in the previous work SVO-yoshida due to the well-defined atomically flat surfaces of thin films and probably the protective V5+ oxide layer. As for the incoherent part, there is a weak but finite dispersion as we shall discuss below in detail.
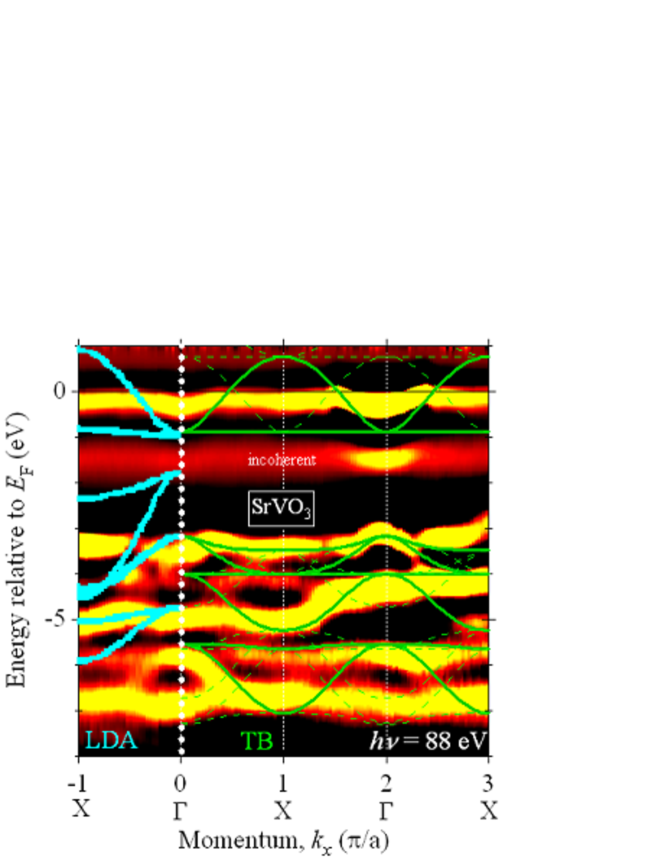
In order to see the band dispersions more clearly, we have taken the second derivatives of the EDCs and displayed as grey-scale plot in Fig. 3. (In this figure, bright parts correspond to energy bands.) Although the obtained band dispersions qualitatively agree with LDA calculation (left-hand side of Fig. 3) Nekrasov ; takegahara ; Pavarini-d1 , the position of the O bands does not. Therefore, we have performed tight-binding band calculation to adjust the O band position TB-wadati . As shown in Fig. 3, one obtains good agreement between experiment and calculation when we set the parameters: eV, eV, eV, eV, eV, eV, and eV. This was also confirmed by comparing the calculation with the other band dispersion along the X - M line obtained using eV (not shown). Some of the bands, especially in the O band region, which cannot be reproduced by the calculation may be attributed to the presence of the V5+ oxide surface layer. The detailed electronic structure of the V5+ oxide surface layer is not clear now, however, taking into account of the diffraction replica with respect to the surface super-structure, almost all the experimental O bands are well reproduced by the calculation (Fig. 3).
In order to see the V bands near EF in more detail, we show in Fig. 4 (a) the - spece intensity plot along the - X direction intplot . The peak positions determined from both EDCs and momentum distribution curves (MDCs) are also shown. The V and bands cross the Fermi level between the and X points. For the dispersion of the coherent part, one can see clear mass renormalization compared with the LDA calculation LDA-Pavarini . From the experimental ( eV) and calculated ( eV) occupied bandwidths, the global mass renormalization factor is estimated to be . That is, if the LDA band dispersions is reduced by a factor of 0.5, the experimental band dispersions are well reproduced as shown in Fig. 4 (a). This indicates that electron correlation strength is almost independent of momentum and of the , or bands of the degenerate band. The kink in the band dispersion is weak and broad, if exists, but the curvature changes its sign around eV as predicted by a recent DMFT calculation Nekrasov .
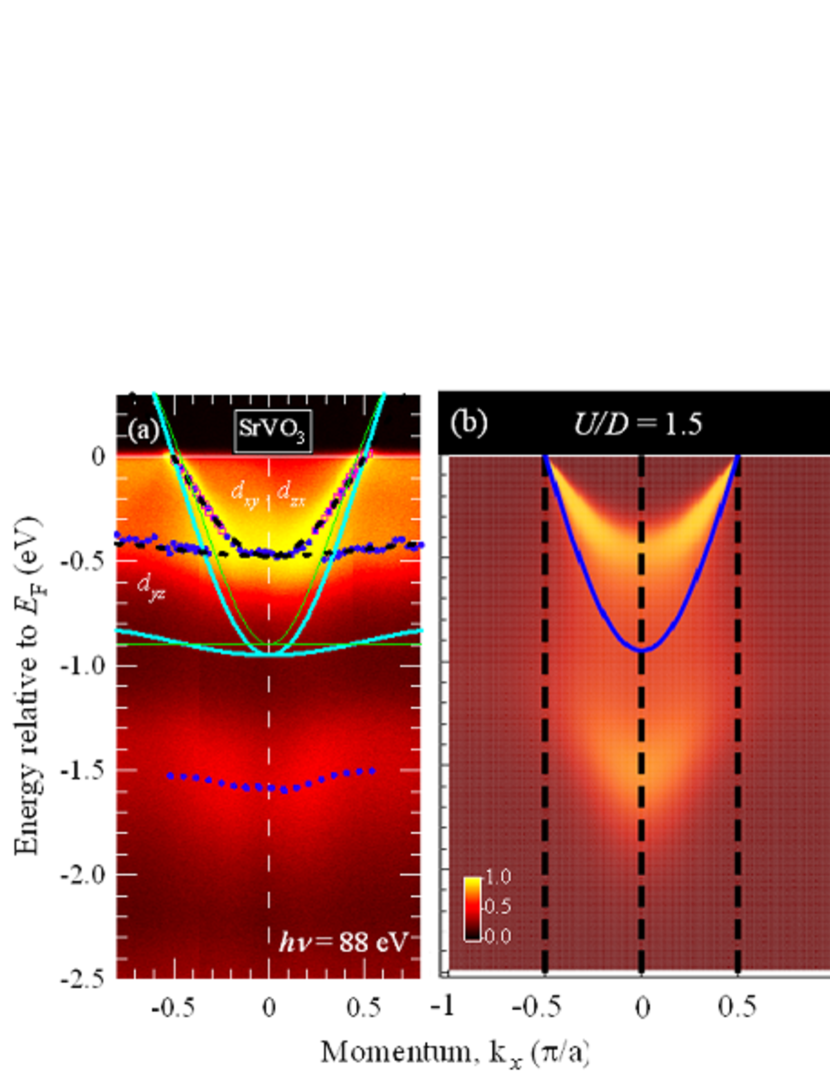
As for the incoherent part located around eV, one can see a weak but finite ( eV) dispersion. The intensity of the incoherent part is momentum dependent and becomes strong within the Fermi surface.
Figure 4 (b) shows the intensity plot of the spectral functions from the DMFT calculation intplot . The DMFT self-energy was computed using a single band model in the present case. One obtains agreement between experiment and theory when the correlation strength of is set to , where is the bandwidth of the occupied part of the non-interacting band. Although the DMFT calculation predicts that an incoherent part disperses as strongly as the bare band, the experimental dispersion of the incoherent part was weaker. This is probably due to the overlapping dispersiveless band along the - X direction, which has been neglected in the present DMFT calculation. In future, DMFT + LDA calculation which takes into account the three-fold degenerate of the orbitals are necessary to quantitatively understand the ARPES results.
In conclusion, we have studied the electronic structure of SrVO3 thin films by means of ARPES. Due to the “transparent” protective surface V5+ oxide layer, bulk-like V band structure was successfully observed. We have determined the occupied quasiparticle width of the V band to be eV. The band dispersions in the coherent part were reproduced by the renormalized LDA bands with the global mass renormalization factor of . There was a weak but finite dispersion in the incoherent part and its intensity was stronger within the Fermi surface. The experimental dispersions and intensities of the coherent part as well as of the incoherent part were reproduced by momentum-resolved DMFT calculation. Since we have employed the single-band model for the DMFT calculation, multi-orbital effect of the bands remains to be studied in future studies.
The authors would like to thank K. Ono and A. Yagishita for their support in the experiment at KEK-PF and T. Mizokawa and K. Nasu for enlightening discussion. This work was supported by a Grant-in-Aid for Scientific Research (A19204037 and A19684010) from JSPS and a Grant-in-Aid for Scientific Research in Priority Areas “Invention of Anomalous Quantum Materials” from MEXT. Two of us (MT and HW) were supported by JSPS. The work was done under the approval of Photon Factory Program Advisory Committee (Proposal Nos. 2005G101 and 2005S2-002) at the Institute of Material Structure Science, KEK.
References
- (1) M. Imada, A. Fujimori, and Y. Tokura, Rev. Mod. Phys. 70, 1039 (1998).
- (2) A. Fujimori, I. Hase, H. Namatame, Y. Fujishima, Y. Tokura, H. Eisaki, S. Uchida, K. Takegahara, and F. M. F. de Groot, Phys. Rev. Lett. 69, 1796 (1992).
- (3) I. H. Inoue, O. Goto, H. Makino, N. E. Hussey, and M. Ishikawa, Phys. Rev. B 58, 4372 (1998).
- (4) I. H. Inoue, I. Hase, Y. Aiura, A. Fujimori, Y. Haruyama, T. Maruyama, and Y. Nishihara, Phys. Rev. Lett. 74, 2539 (1995).
- (5) A. Georges, G. Kotliar, W. Krauth, and M. J. Rozenberg, Rev. Mod. Phys. 68, 13 (1996).
- (6) G. Sordi, A. Amaricci, and M. J. Rozenberg, Phys. Rev. Lett. 99, 196403 (2007).
- (7) X. Y. Zhang, M. J. Rozenberg, and G. Kotliar, Phys. Rev. Lett. 70, 1666 (1993).
- (8) K. Maiti, D. D. Sarma, M. J. Rozenberg, I. H. Inoue, H. Makino, O. Goto, M. Pedio, and R. Cimino, Europhys. Lett. 55, 246 (2001).
- (9) A. Sekiyama, H. Fujiwara, S. Imada, S. Suga, H. Eisaki, S. I. Uchida, K. Takegahara, H. Harima, Y. Saitoh, I. A. Nekrasov, G. Keller, D. E. Kondakov, A. V. Kozhevnikov, Th. Pruschke, K. Held, D. Vollhardt, and V. I. Anisimov, Phys. Rev. Lett. 93, 156402 (2004).
- (10) R. Eguchi, T. Kiss, S. Tsuda, T. Shimojima, T. Mizokami, T. Yokoya, A. Chainani, S. Shin, I. H. Inoue, T. Togashi, S. Watanabe, C. Q. Zhang, C. T. Chen, M. Arita, K. Shimada, H. Namatame, and M. Taniguchi, Phys. Rev. Lett. 96, 076402 (2006).
- (11) K. Maiti, U. Manju, S. Ray, P. Mahadevan, I. H. Inoue, C. Carbone, and D. D. Sarma, Phys. Rev. B 73, 052508 (2006).
- (12) R. J. O. Mossanek, M. Abbate, and A. Fujimori, Phys. Rev. B 74, 155127 (2006).
- (13) T. Yoshida, K. Tanaka, H. Yagi, A. Ino, H. Eisaki, A. Fujimori, and Z.-X. Shen, Phys. Rev. Lett. 95, 146404 (2005).
- (14) I. A. Nekrasov, K. Held, G. Keller, D. E. Kondakov, Th. Pruschke, M. Kollar, O. K. Andersen, V. I. Anisimov, and D. Vollhardt, Phys. Rev. B 73, 155112 (2006).
- (15) K. Byczuk, M. Kollar, K. Held, Y.-F. Yang, I. A. Nekrasov, Th. Pruschke, and D. Vollhardt, Nature Phys. 3, 168 (2007).
- (16) A. Chikamatsu, H. Wadati, H. Kumigashira, M. Oshima, A. Fujimori, M. Lippmaa, K. Ono, M. Kawasaki, and H. Koinuma, Phys. Rev. B 76, 201103(R) (2007).
- (17) H. Wadati, A. Maniwa, A. Chikamatsu, I. Ohkubo, H. Kumigashira, M. Oshima, A. Fujimori, M. Lippmaa, M. Kawasaki, and H. Koinuma, Phys. Rev. Lett. 100, 026402 (2008).
- (18) K. Horiba, H. Oguchi, H. Kumigashira, M. Oshima, K. Ono, N. Nakagawa, M. Lippmaa, M. Kawasaki, and H. Koinuma, Rev. Sci. Instr. 74, 3406 (2003).
- (19) M. Kawasaki, K. Takahashi, T. Maeda, R. Tsuchiya, M. Shinohara, O. Ishihara, T. Yonezawa, M. Yoshimoto, and H. Koinuma, Science 266, 1540 (1994).
- (20) G. A. Sawatzky and D. Post, Phys. Rev. B 20, 1546 (1979).
- (21) M. Takizawa, H. Wadati, K. Tanaka, M. Hashimoto, T. Yoshida, A. Fujimori, A. Chikamatsu, H. Kumigashira, M. Oshima, K. Shibuya, T. Mihara, T. Ohnishi, M. Lippmaa, M. Kawasaki, H. Koinuma, S. Okamoto, and A. J. Millis, Phys. Rev. Lett. 97, 057601 (2006).
- (22) K. Takegahara, J. Electron Spectrosc. Relat. Phenom. 66, 303 (1994).
- (23) E. Pavarini, A. Yamasaki, J. Nuss, and O. K. Andersen, New J. Phys. 7, 188 (2005).
- (24) H. Wadati, T. Yoshida, A. Chikamatsu, H. Kumigashira, M. Oshima, H. Eisaki, Shen Z.-X, T. Mizokawa, and A. Fujimori, Phase Transitions 79, 617 (2006).
- (25) In order to display the incoherent part visibly, the intensity has been modified using a hyperbolic tangent function after having appropriately normalized the experimental data.
- (26) Here, the simplified dispersion of a cubic band were assumed as in Ref. Pavarini-d1 : , where meV, meV, meV, and meV.