1pt \setkomafontpagehead \setkomafontpagenumber
Clumping in Hot Star Winds
W.-R. Hamann, A. Feldmeier & L. Oskinova, eds.
Potsdam: Univ.-Verl., 2007
URN: http://nbn-resolving.de/urn:nbn:de:kobv:517-opus-13981
X-raying clumped stellar winds
L.M. Oskinova1, W.-R. Hamann1 & A. Feldmeier1
1Universität Potsdam, Germany
Abstract
X-ray spectroscopy is a sensitive probe of stellar winds. X-rays
originate from optically thin shock-heated plasma deep inside the wind
and propagate outwards throughout absorbing cool material. Recent
analyses of the line ratios from He-like ions in the X-ray spectra of
O-stars highlighted problems with this general paradigm: the measured
line ratios of highest ions are consistent with the location of the
hottest X-ray emitting plasma very close to the base of the wind,
perhaps indicating the presence of a corona, while measurements from
lower ions conform with the wind-embedded shock model. Generally, to
correctly model the emerging X-ray spectra, a detailed knowledge of
the cool wind opacities based on stellar atmosphere models is
prerequisite. A nearly grey stellar wind opacity for the X-rays is
deduced from the analyses of high-resolution X-ray spectra. This
indicates that the stellar winds are strongly clumped. Furthermore,
the nearly symmetric shape of X-ray emission line profiles can be
explained if the wind clumps are radially compressed. In massive
binaries the orbital variations of X-ray emission allow to probe the
opacity of the stellar wind; results support the picture of strong
wind clumping. In high-mass X-ray binaries, the stochastic X-ray
variability and the extend of the stellar-wind part photoionized by
X-rays provide further strong evidence that stellar winds consist of
dense clumps.
1 Introduction
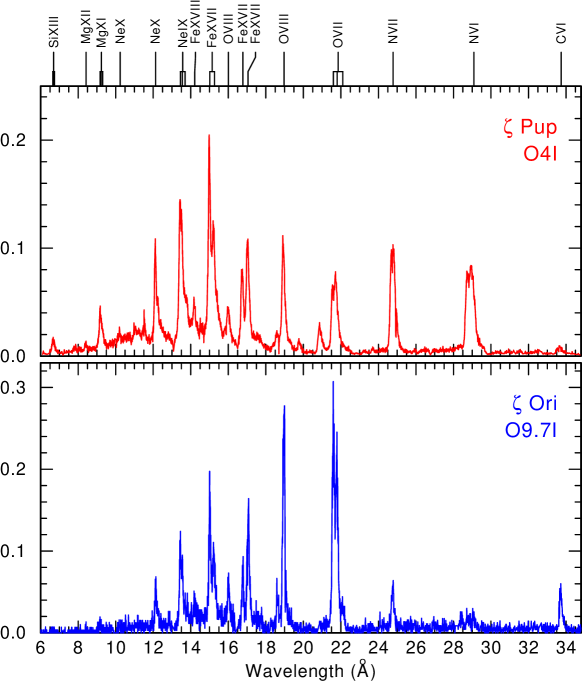
All OB-stars with spectral types earlier than B1.5 have X-ray luminosities exceeding erg s-1. Remarkably, their X-ray luminosity roughly correlates with stellar bolometric luminosities as (Seward et al. [1979], Berghöfer et al. [1994]). The high-resolution X-ray spectra of two O-stars, Pup and Ori, are shown in Figure 1. The spectra are dominated by strong emission lines that reflect stellar wind abundances, e.g. nitrogen lines are more prominent in the spectrum of the more evolved star Pup. X-ray spectra of single non-magnetic massive stars can be explained as emitted by optically thin plasma heated to temperatures keV (e.g. Wojdowski & Schulz [2005]).
There is a number of hypotheses to explain how X-rays are generated in stellar winds. Lucy & White ([1980]) put forward a theory where X-rays originate from bow shocks around a population of blobs (see also Cassinelli et al., these proceedings). Cassinelli & Swank ([1983]) proposed an analogy with coronal stars where X-rays originate from magnetically confined regions at the wind base. Owocki et al. ([1988]) performed numerical simulations of the evolution of instabilities in radiatively driven stellar winds and predicted a development of reverse shocks with postshock temperatures in the range K (i.e. as inferred from the observed X-ray spectra). Feldmeier et al. ([1997]) developed a model explaining the X-rays as originating from cooling zones behind shock fronts and were able to reproduce the low-resolution Rosat spectra of Pup and Ori.
In massive binaries a copious amount of X-ray emission is produced by the collision of two powerful stellar winds. X-ray spectra of colliding wind binaries reveal that the X-ray emitting plasma departs from collisional equilibrium (e.g. Pollock et al. [2005]). Colliding wind systems tend to have somewhat higher X-ray luminosities and their X-ray spectra can be “harder” compared to the single stars.
Another type of X-ray emitting plasma is found in high-mass X-ray binary systems (HMXBs) that consist of an OB supergiant and a degenerate companion, usually a neutron star (NS) deeply embedded in the stellar wind of the primary. Stellar wind accretion onto a NS powers strong X-ray emission that has a characteristic power-law spectrum, while the surrounding stellar wind is photoionized by this X-ray emission.
Independent on the formation mechanism, the X-rays registered by the observer are attenuated in the stellar wind and interstellar medium. The transport of X-rays in stellar winds can often be treated as pure absorption (Baum et al. [1992], Hillier et al. [1993]). This leads to a great simplification of the radiative transfer problem and allows modeling even in the case when the absorbing medium is inhomogeneous.
2 X-ray emission of single stars as a probe of clumped stellar wind
2.1 Line ratios in spectra of He-like ions
One of the key spectral diagnostics is provided by the ratio of line fluxes from He-like ions. These ions show characteristic ’fir triplets’ of a forbidden (f), an intercombination (i) and a resonance (r) line. In OB-type stars, the line ratio is sensitive to the local mean intensity of the UV radiative field, . The UV photons with wavelength excite the metastable 3S level to the 3P level, so that , where is the photoexcitation rate (constants and collisional terms are omitted). Neglecting the limb darkening, the average intensity can be substituted by the diluted photospheric flux, . If the photospheric flux is known, the dilution factor can be inferred from . This constrains the radius where the X-ray emitting plasma is located.
For wavelengths in the observable part of the UV the flux can be, in principle, directly inferred from observations. Unfortunately, especially for giant and supergiant stars, the photospheric fluxes are often contaminated by wind lines. E.g. O vi resonance doublet coincides with the transition at 1033 Å for the Mg xi line. The O vi doublet itself can only be reproduced by stellar atmosphere models if an X-ray field causing Auger ionization is included (e.g. Oskinova et al. [2006]). This example highlights the need of a full radiative transfer treatment for the correct interpretation of the fir line ratios – a task that has not been accomplished yet.
Commonly, the fluxes at the wavelengths of interest are obtained from stellar atmosphere models. Leutenegger et al. ([2006]) analyzed the lines of He-like ions in the spectra of four O-type giants and supergiants. The parameters of the O-stars were taken from Lamers & Leitherer ([1993]) and used to select a stellar atmosphere model from the TLUSTY static plane-parallel model grid. Leutenegger et al. find that the minimum radius of X-ray formation is typically in the range of .
Waldron & Cassinelli ([2007], WC07) analyzed fir line ratios for 17 OB stars, using plane-parallel Kurucz models, and found, in agreement with their earlier results, that high- ions are predominantly located closer to the photosphere. They highlighted a “near-star high-ion” problem. This problem can be illustrated by the S xv line in Puppis. WC07 constrained for this line to . This is in agreement with the results of Leutenegger et al. ([2006]) who estimated the minimum value of as . The emissivity of S xv has its maximum at MK. The presence of plasma with such high temperatures at , i.e. close to the photosphere, is contrary to the expectations from the shocked-wind model, but supports the base-corona model.
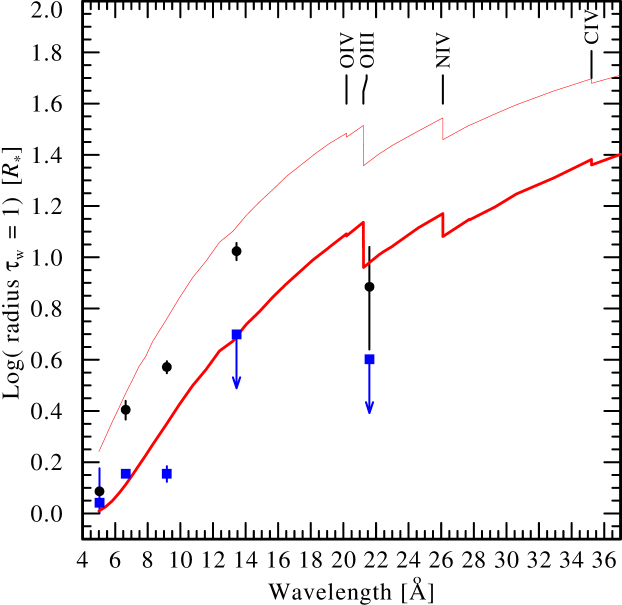
WC07 notice a correlation between the radius where the ambient cool wind becomes transparent for the X-rays , and the predominant location of He-like ion X-ray emission. This is illustrated in Fig. 2. We use a spherically-symmetric PoWR atmosphere model of Pup to calculate . The calculations are performed for two different evaluated under the assumption of unclumped wind (Repolust et al. [2004]) and allowing for macroclumping (Oskinova et al. [2007]). The measurements of by WC07 and Leutenegger et al. ([2006]) are also shown. As can be seen in Fig. 2, there is a good agreement between the measurements by WC07 of the fir-inferred radii and . However, there is an apparent disagreement with the results of Leutenegger et al. ([2006]). This can be due to a difference in measuring and/or different approaches to the analysis (see WC07).
2.2 X-ray emission line profiles
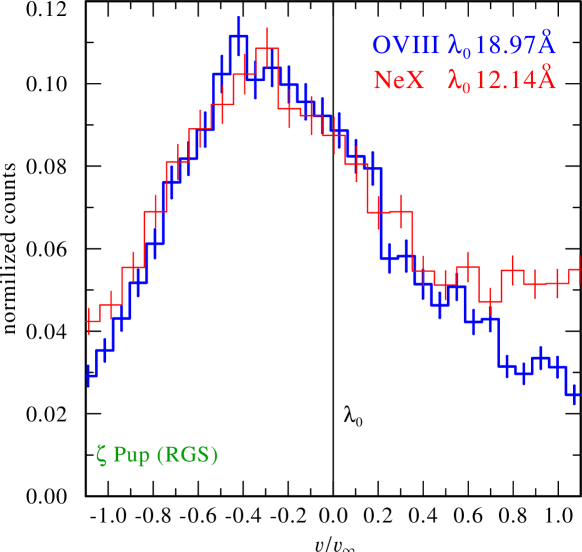
The analysis of fir-lines suggests that lines from lower ions are formed further out in the wind. Therefore, assuming that the wind velocity monotonically increasing with the radius, lines from ions with lower Z should be broader than from ions with higher Z. Contradictory to this expectation, the observed widths of all X-ray lines are similar (e.g Kramer et al. [2003]; Pollock [2007]). To illustrate this, the lines of Ne x and O viii in spectrum of Pup are shown in Fig. 3 (see also lines of C vi and Ne x in Ori spectrum shown in Pollock [2007]). Thus, there is a discrepancy between the location of the emission region inferred from the fir line ratios and from the fitting of the line profiles.
Radiative transfer in homogeneous wind predicts that the redshifted emission from the back side of the wind is more suppressed by the continuum opacity along the line of sight, than the blueshifted emission from the front hemisphere. This should lead to skewed, almost triangular-shaped profiles of the emission lines (MacFarlane et al. 1991; Ignace [2001]; Owocki & Cohen [2001]). Because the atomic opacity increases at longer wavelengths, the lines of ions with lower are expected to be more skewed compare to the higher ions. However, the majority of observed stellar X-ray lines are only slightly skewed and the shifts are similar for lines of all ions (WC07).
There are a number of different hypotheses to explain the puzzling properties of observed line profiles. Pollock ([2007]) proposes that X-rays originate in collisionless shocks. Two-component wind expansion is invoked by Mullan & Waldron ([2006]). Ignace & Galley ([2002]) show that if the X-ray emitting plasma is optically thick this would result in more symmetric line profiles (see also Leutenegger et al., these proceedings). Waldron & Cassinelli ([2001]) suggest that nearly symmetric line profiles can be explained by low opacity of the stellar wind.
Waldron & Cassinelli ([2001]) note that the wind opacity could be reduced if a large fraction of the wind were photoionized by X-rays. However, they observe that this is not compatible with the presence of low-ionisation species, e.g. C iv in the UV spectra. Our recent PoWR models of O star winds confirm this suggestion: there is no significant change in the ionisation structure of the wind when a realistic X-ray intensity is included.
Waldron & Cassinelli (2001) further suggest that if the adopted mass-loss rate is reduced this would lead to a better agreement between modeled and observed line shapes. This suggestion is supported by the modeling of line profiles emerging from a homogeneous wind by Kramer et al. (2003) and Cohen et al. (2006). They infer the wind optical depth by fitting a model with four free parameters to the lines observed in the X-ray spectra of Pup and Ori. The optical depth in the smooth wind with a monotonic velocity law scales with a parameter (Owocki & Cohen [2001]). Inferring from the model fits and assuming that the wind atomic opacity is a constant, Kramer et al. (2003) and Cohen et al. (2006) conclude that X-ray lines can be fitted only if for Pup and Ori are strongly reduced (see also Cohen, these proceedings). More realistic mass-absorption coefficients are presented in Oskinova et al. (2006). We use the best-fit values of obtained for different lines from Table 1 in Kramer et al. (2003) to estimate the mass-loss in Pup, however there is large disagreement when different lines are considered.
The smooth-wind line profile formalism can be easily adapted for an inhomogeneous wind, where all clumps are optically thin at any given wavelength (so-called microclumping approximation). The empirical mass-loss rates based on diagnostics are lower when microclumping is adopted, compared to models that assume a smooth wind. The mass-loss rates obtained from the fitting of X-ray lines by Kramer et al. (2003) can be reconciled with the radio and H measurements only if clumping filling factors are very small (see Puls et al. [2006]). Overall, the use of microclumping approximation, at least in dense winds, is questionable (see Hamann, these proceedings).
Waldron & Cassinelli (2001) also note that a clumped wind can be effectively optically thin even in stars with large . This suggestion was exploited in Feldmeier et al. ([2003]) by waiving the microclumping approximation.
Assume that the flow of clumps that constitutes the wind obeys the equation of continuity. The number of clumps per unit volume is , where is a constant. The effective opacity of clumped wind, , is the product of the clump number density , the clump cross-section , and the probability of an X-ray photon being absorbed when it encounters a clump, (Feldmeier et al. [2003]).
The optical depth across an average clump at the distance is . When the effective opacity does not depend on the atomic opacity (because ). Therefore, the wind effective opacity becomes grey.
To calculate emission line profiles, we assume for simplicity that the emission with emissivity originates between some specific radii and in the wind. The formal integral for the line profile reads where is the direction cosine.
Evaluating the wind optical depth as an integral over effective opacity along the line-of-sight gives:
| (1) |
To understand how the clump geometry alters the line profile shape, let us consider two extreme cases and compare isotropic clumps (balls) and anisotropic clumps in the form of infinitesimally thin shell-fragments (pancakes) oriented perpendicular to the radial direction, so-called a “Venetian blind” model. Assuming that the clumps keep constant solid angle as they propagate outwards, in the direction a ball has the cross-section , while a pancake has . Recalling that and inserting the above expressions for the cross-sections in the Eq. (1), it is immediately clear that in the case of pancakes the integral Eq. (1) transforms into an integral over , while it stays an integral over in case of the balls. The consequence is that pancakes yield nearly symmetric emission line profiles, similarly to the observed (Oskinova et al. [2006]).
Owocki & Cohen (2006) applied a porosity length formalism (Owocki et al. [2004]) with , where is a parameter. They studied a case of isotropic opacity, and concluded that large porosity lengths are required to reproduce the observed X-ray line profiles. However, Oskinova et al. (2006) computed synthetic X-ray lines for anisotropic opacity. Stellar wind parameters, i.e. , , and were adopted from most recent stellar atmosphere models and it was assumed that the average separation between clumps at distance is , as compatible with predictions of hydrodynamic simulations (e.g Feldmeier et al. 1997). Synthetic lines were computed without allowing any free parameter and compared with the observed lines. The remarkable similarity between synthetic and observed lines provides an evidence that the wind clumps are not optically thin, and are compressed in radial direction.
3 X-ray emission of binaries as a probe of clumped stellar wind
The collision of stellar winds in massive binary systems (CWB) results in a bow shock that concaves around the star with the weaker wind. In close binaries the shocked material cools radiatively and hence the intrinsic X-ray luminosity is (Pittard & Stevens [2002]). In the wide binaries with sufficiently large separation , the shocked material cools adiabatically resulting in (Stevens et al. [1992]).
Hydrodynamic studies of colliding clumped winds were conducted by Walder & Folini (2002) and Pittard (2007). Walder & Folini considered WR 140 at periastron. They showed that the collision of clumped winds in a radiatively cooling system leads to the fragmentation of the colliding wind region (CWR). Carbon enriched dense WR-wind clumps with dimensions exceeding cm can effectively cool and serve as the seeds for the formation of the dust. Pittard (2007) considered WR 140 at apastron when the CWR is likely to cool adiabatically. It was shown that in this case the CWR becomes highly turbulent. This leads to a rapid destruction of the clumps in the CWR. Therefore in adiabatic CWB, wind clumping does not affect the intrinsic X-ray luminosity. Therefore such systems may provide a diagnostic of mass-loss that is independent on clumping.
The X-rays generated in the bow shock propagate along the line of sight through the stellar wind of the foremost star, resulting in X-ray eclipses due to the orbital motion. The duration and the depth of the eclipses depends on the orbital parameters, the wind geometry, and its opacity. When the intrinsic X-ray luminosity from the bow shock is known, the stellar mass-loss rate can be probed by inferring the absorbing column from the X-ray spectrum.
Schild et al. ([2004]) derived the mass-loss rate of the WC8 component of Vel in this way. The obtained is a factor of four smaller than what is derived from spectral analysis with homogeneous wind models. This was interpreted in terms of WR wind clumping, with a volume filling factor of . For Car, Pittard & Corcoran (2002) derived a mass-loss rate from an analysis of the X-ray spectrum that is lower by a factor of few compared to the conventionally adopted value, thus indicating wind clumping. Similarly, Pollock et al. ([2005]) derived smaller than expected wind absorption from their analysis of the X-ray spectrum of WR140.
Supergiant HMXBs consist of a supergiant OB star and (usually) a neutron star (NS), that orbits deep inside the stellar wind. An X-ray emission with a power-law spectrum results from the accretion of the stellar wind onto the NS. These X-rays photoionize the surrounding stellar wind. The wind X-ray spectrum shows a large variety of emission features, including a number of fluorescent lines. Sako et al. (2003) reviewed the spectroscopic results obtained with X-ray observatories for several wind-fed HMXBs. They concluded that the observed spectra can be explained only as originating in a wind where cool dense clumps are embedded in rarefied photoionized gas. Sako et al. (1999) constrained the volume filling factor of clumps in the wind of Vela X-1 as . Similar conclusions were reached by Van der Meer et al. ([2005]). They studied the X-ray light curve of 4U 1700-37 and found that the feeding of the NS by stellar wind clumps explains the observed stochastic variability. The clump separation at the distance was constrained to . Recently, the advances in the -ray and X-ray observations lead to the discovery of new HMXBs that are highly absorbed and display fast stochastic variability. This spectral and temporal variability is consistent with strong wind clumping. The inferred clumping parameters are similar to those obtained from the analysis of X-ray emission in single stars and in CWBs (see Romero et al. and Walter et al., these proceedings).
4 Conclusions
The spectral and temporal properties of the X-ray emission from single stars, colliding wind binaries and high-mass X-ray binaries provide consistent evidence of wind clumping. The multitude of data requires strongly clumped winds where clumps are separated by a few tenths of the stellar radius in the wind acceleration zone. The approximation that clumps are optically thin at all wavelengths in the X-ray band is not justified and cannot be applied universally. Clumped stellar winds have a reduced opacity for X-rays, compared to a homogeneous wind, due to a reduction of empirically determined mass-loss rates and to the effect of wind porosity.
References
- 1992 Baum, E., Hamann, W.-R., Koesterke, L., & Wessolowski, U., 1992, A&A, 266, 402
- 1994 Berghöfer, T.W., Schmitt, J.H.M.M., Danner, R., & Cassinelli, J.P., 1997, A&A, 322, 167
- 1983 Cassinelli, J.P. & Swank, J.H., 1983, ApJ, 271, 681
- 2006 Cohen, D.H., et al., 2006, MNRAS, 368, 1905
- 2000 Ignace, R., Oskinova, L.M., & Foullon, C., 2000, MNRAS, 318, 214
- 2001 Ignace, R., 2001, ApJ, 549, 119
- 2002 Ignace, R. & Gayley, K.G., 2002, ApJ, 568, 954
- 1997 Feldmeier, A., Puls, J., & Pauldrach, A.W.A., 1997, A&A, 322, 878
- 2003 Feldmeier, A., Oskinova, L., & Hamann, W.-R., 2003, A&A, 403, 217
- 1993 Hillier, D.J., et al., 1993, A&A, 276, 117
- 2003 Kramer, R.H., Cohen, D., & Owocki, S.P., 2003, ApJ, 592, 532
- 1993 Lamers, H.J.G.L.M. & Leitherer, C., 1993, ApJ, 412, 771
- 2006 Leutenegger, M.A., et al., 2006, ApJ, 650, 1096
- 1980 Lucy, L.B. & White, R.L. 1980, ApJ, 241, 300
- 1991 MacFarlane, J.J., et al., 1991, ApJ, 380, 564
- 2006 Mullan, D.J. & Waldron, W.L. 2006, ApJ, 637, 506
- 2004 Oskinova, L.M., Feldmeier, A., & Hamann, W.-R., 2004, A&A, 422, 675
- 2006 Oskinova, L.M., Feldmeier, A., & Hamann, W.-R., 2006, MNRAS, 372, 313
- 2007 Oskinova, L.M., Hamann, W.-R., & Feldmeier, A., 2007, A&A, 476, 1331
- 1988 Owocki, S.P., Castor, J.I.,& Rybicki, G.B. 1988, ApJ, 335, 914
- 2001 Owocki, S.P & Cohen, D.H., 2001, ApJ, 559, 1108
- 2004 Owocki, S.P., Gayley, K.G., & Shaviv, N.J., 2004, ApJ, 616, 525
- 2006 Owocki, S.P & Cohen, D.H., 2006, ApJ, 648, 565
- 2002 Pittard, J.M. & Stevens, I.R., 2002, A&A, 388, 20
- 2002 Pittard, J.M., & Corcoran, M.F., 2002, A&A, 383, 636
- 2007 Pittard, J.M., 2007, ApJ, 660, 141
- 2005 Pollock, A.M.T., et al., 2005, ApJ, 629, 482
- 2007 Pollock, A.M.T., 2007, A&A, 463, 1111
- 2006 Puls, J., et al., 2006,A&A, 454, 625
- 2004 Repolust, T., Puls, J., & Herrero, A., 2004, A&A, 415, 349
- 2003 Sako, M., et al., 2003, astro-ph/0309503
- 1999 Sako, M., et al., 1999, ApJ, 525, 921
- 2004 Schild, H., et al., 2004, A&A, 422, 177
- 1979 Seward F.D., et al., 1979, ApJ, 234, 55
- 1992 Stevens, I.R., Blondin, J.M., & Pollock, A.M.T., 1992, ApJ, 386, 265
- 2005 van der Meer, A., et al., 2005, A&A, 432, 999
- 2002 Walder, R. & Folini, D., 2002, ASPC, 260, 595
- 2001 Waldron, W.L & Cassinelli, J.P. , 2001, ApJ, 548, 45
- 2007 Waldron, W.L & Cassinelli, J.P. , 2007, ApJ, 668, 456 (WC07)
- 2005 Wojdowski, P.S. & Schulz, N.S., 2005, ApJ, 627, 953