Detrended fluctuation analysis of intertrade durations
Abstract
The intraday pattern, long memory, and multifractal nature of the intertrade durations, which are defined as the waiting times between two consecutive transactions, are investigated based upon the limit order book data and order flows of 23 liquid Chinese stocks listed on the Shenzhen Stock Exchange in 2003. An inverse -shaped intraday pattern in the intertrade durations with an abrupt drop in the first minute of the afternoon trading is observed. Based on the detrended fluctuation analysis, we find a crossover of power-law scaling behaviors for small box sizes (trade numbers in boxes) and large box sizes and strong evidence in favor of long memory in both regimes. In addition, the multifractal nature of intertrade durations in both regimes is confirmed by a multifractal detrended fluctuation analysis for individual stocks with a few exceptions in the small-duration regime. The intraday pattern has little influence on the long memory and multifractaility.
keywords:
Econophysics; Intertrade duration; Intraday pattern; Long memory; Multifractal naturePACS:
89.65.Gh, 02.50.-r, 89.90.+n, ,
1 Introduction
The interevent time, which is defined as the waiting time between two consecutive events, has attracted considerable interests in various fields including ecology Viswanathan-Afanasyev-Buldyrev-Murphy-Prince-Stanley-1996-Nature , Edwards-Phillips-Watkins-Freeman-Murphy-Afanasyev-Buldyrev-daLuz-Raposo-Stanley-Viswanathan-2007-Nature , sociology Oliveira-Barabasi-2005-Nature , Brokmann-Hufnagel-Geisel-2006-Nature , Barabasi-2005-Nature , Vazquez-2005-PRL , Vazquez-Oliveira-Dezso-Goh-Kondor-Barabasi-2006-PRE , finance Engle-Russell-1998-Em , Engle-Russell-1997-JEF , Engle-2000-Em , Scalas-Gorenflo-Mainardi-2000-PA , Mainardi-Raberto-Gorenflo-Scalas-2000-PA , Masoliver-Montero-Weiss-2003-PRE , Scalas-2006-PA , Masoliver-Montero-Perello-Weiss-2006-JEBO , Jiang-Chen-Zhou-2008-XXX , seismology Telesca-Cuomo-Lapenna-Macchiato-2004-CSF , Corral-2004-PRL , Shcherbakov-Yakovlev-Turcotte-Rundle-2005-PRL , Molchan-2005-PAG , Saichev-Sornette-2006-PRL , Molchan-Kronrod-2007-PAG , and so on. When we regard the transaction dynamics as a point process in financial market Cox-Isham-1980 , trades are defined as events and intertrade durations are a kind of interevent time. Several important statistical properties (probability distribution, long-range dependence and multifractal nature) of the intertrade durations have been studied.
Empirical analysis of the intertrade durations for different financial data unveils that the probability distribution can be described by the Mattag-Leffler function Mainardi-Raberto-Gorenflo-Scalas-2000-PA , Sabatelli-Keating-Dudley-Richmond-2002-EPJB , power laws Sabatelli-Keating-Dudley-Richmond-2002-EPJB , Yoon-Choi-Lee-Yum-Kim-2006-PA , modified power laws Masoliver-Montero-Weiss-2003-PRE , Masoliver-Montero-Perello-Weiss-2006-JEBO , stretched exponentials (or Weibull) Bartiromo-2004-PRE , Raberto-Scalas-Mainardi-2002-PA , Ivanov-Yuen-Podobnik-Lee-2004-PRE , Vazquez-Oliveira-Dezso-Goh-Kondor-Barabasi-2006-PRE , Sazuka-2007-PA , stretched exponentials followed power laws Kim-Yoon-2003-Fractals , Kim-Yoon-Kim-Lee-Scalas-2007-JKPS , to name a few. Recently, Politi and Scalas rejected the hypothesis that the waiting time distributions are described by an exponential Scalas-Gorenflo-Luckock-Mainardi-Mantelli-Raberto-2004-QF , Scalas-Gorenflo-Luckock-Mainardi-Mantelli-Raberto-2005-FL or a power law and found that the -exponential compares well to the Weibull for waiting time distribution fitting Poloti-Scalas-2008-PA . They also argued that the distribution differing from an exponential is the consequence of the varying trade activities during the trading period Scalas-Gorenflo-Luckock-Mainardi-Mantelli-Raberto-2004-QF , Scalas-Gorenflo-Luckock-Mainardi-Mantelli-Raberto-2005-FL , Scalas-Kaizoji-Kirchler-Huber-Tedeschi-2006-PA , Politi-Scalas-2007-PA . Jiang, Chen, and Zhou found that the intertrade durations exhibit a scaling behavior and the distribution is Weibull followed by a power law tail Jiang-Chen-Zhou-2008-XXX .
The long memory feature of the intertrade durations is very important in the ACD model Engle-Russell-1998-Em , Engle-Russell-1997-JEF , Engle-2000-Em and its variants Jasiak-1999-Finance , Bauwens-Giot-2000-AES , Zhang-Russell-Tsay-2001-JEm , Bauwens-Veredas-2004-JEm . In the econophysics community, to our best knowledge, the first research was conducted by Ivanov et al., applying the detrended fluctuation analysis (DFA) approach to analyze the intertrade durations of 30 stocks listed on the NYSE from January 1993 to December 1996 Ivanov-Yuen-Podobnik-Lee-2004-PRE . They found that there are two scaling ranges in the fluctuation function, where long-range power law correlations within a trading day followed by a crossover to even stronger correlations over time scale more than one trading day. They also argued that the appearance of two scaling regimes is linked to the timescales over which information disseminates. Yuen and Ivanov further analyzed the intertrade times of 100 stocks listed on the NYSE and 100 stocks traded on the NASDAQ and found that the crossover behavior also exists for all stocks on both markets Yuen-Ivanov-2005-XXX . In addition, it is found that the stocks on NASDAQ show much stronger correlations within one trading day than that on the NYSE, albeit both markets display the same memory feature for time scale larger than one day. This result is interpreted by the institutional difference between the two markets (multi-dealer in NASDAQ, one market maker in NYSE). By investigating 3924 stocks from 1994 to 1995 and 4044 stocks in the whole year 2000 traded on the NYSE, Eisler and Kertész found the crossover behavior again based on the fluctuation analysis Eisler-Kertesz-2006-EPJB . More interesting, the Hurst exponents of the intertrade durations decrease with the logarithm of mean intertrade duration, .
In addition, the multifractal nature in the intertrade durations of 30 DAX stocks (from 28 November 1997 to 31 December 1999) was studied by Oświȩcimka et al., based on the multifractal detrended fluctuation analysis (MFDFA) approach Oswiecimka-Kwapien-Drozdz-2005-PA . This property has not been well documented for other markets. In this work, we shall perform detailed (multifractal) detrended fluctuation analyses of the intertrade durations of 23 Chinese stocks traded on the Shenzhen Stock Exchange in 2003. We find that the intraday pattern of the intertrade durations does not have significant impact on the long-range dependence and the multifractal nature. We note that the multifractal nature of the returns, the capital fluxes, and the bid-ask spreads of Chinese stocks has been investigated thoroughly Gu-Chen-Zhou-2007-EPJB , Jiang-Guo-Zhou-2007-EPJB , Jiang-Zhou-2007-PA , Jiang-Zhou-2008a-PA , Jiang-Zhou-2008b-PA , Jiang-Zhou-2008-XXX . The current work thus complements this literature.
This paper is organized as follows. In Section 2, we briefly describe the data sets adopted. Section 3 investigates the intraday pattern of intertrade durations. Section 4 studies the memory behavior and the multifractal nature of the intertrade durations using the DFA approach. Section 5 concludes.
2 Data sets
The Chinese stock market is an order-driven market. The organized stock market in mainland China is composed of two stock exchanges, the Shenzhen Stock Exchange (SZSE) and the Shanghai Stock Exchange (SHZE). On the SZSE, each trading day is partitioned into three parts before 1 July 2007, named open call action, cooling period, and continuous double auction. The open call action begins at 9:15 AM and ends at 9:25 AM. Orders are allowed to be submitted and canceled before 9:20 AM. After 9:20, order cancelation is prohibited. At 9:25 AM, part of the submitted orders are executed based on the maximal transaction volume principle, while unsatisfied orders are left on the order book. It is followed by a cooling period from 9:25 AM to 9:30 AM. During the cooling period, all orders are allowed to add into the limit-order book, but no one is executed till 9:30 AM. The continuous double auction operates from 9:30 AM to 11:30 AM and from 13:00 PM to 15:00 PM. According to price-time priority, transaction occurs based on one by one matching of incoming effective market orders and limit orders waiting on the limit-order book. Note that the time interval from 11:30 AM to 13:00 PM is also a cooling period for lunch. Our primary purpose is to investigate the waiting time between two consecutive transactions. Hence, only trades during the continuous auction are considered in this work.
Our study is based on the data of the limit-order books of 23 liquid stocks listed on the Shenzhen Stock Exchange (SZSE) in the whole year 2003. These stocks are representative since they were included as constituents in the Shenzhen Component Index. The limit-order book records ultra-high-frequency data whose time stamps are accurate to 0.01 second including details of every event. Assuming that there are trades at times during the time interval from 9:30 AM to 11:30 AM or from 13:00 PM to 15:00 PM on a trading day, we obtain intertrade durations with . The variables of time are in units of second. In addition, we stress that no intertrade duration is calculated between two trades overnight or crossing the noon closing. Although the time resolution of our data is as precise as 0.01 second, there are still trades stamped with the same time, indicating that the intertrade duration is vanishing between the two corresponding trades. For convenience, we treat the trades occurring at the same time as one trade at that time. Therefore, vanishing durations are excluded. For the 23 stocks, the average intertrade duration varies from 3.8 seconds to 49.4 seconds Jiang-Chen-Zhou-2008-XXX .
3 Intraday pattern
Many empirical studies show that the high-frequency financial variables exhibit intraday patterns, such as the returns Cornell-Schwarz-Szakmary-1995-JBanF , volatilities Andersen-Bollerslev-1997-JEF , bid-ask spreads Mcinish-Wood-1992-JF , Chan-Christie-Schultz-1995-JB , Gu-Chen-Zhou-2007-EPJB , Ni-Zhou-2007-XXX , trading volumes Jain-Joh-1988-JFQA , Admati-Pfleiderer-1988-RFS , and so on. The intertrade durations are also found to exhibit an inverse -shaped pattern in the NYSE market Engle-Russell-1998-Em , Hafner-2005-QF and Russian stock market Anatolyev-Shakin-2007-AFE , which indicates higher trading activities in the open and close than in other time during each trading day. Therefore, it is necessary to investigate the intraday patterns in the intertrade durations of the Chinese stocks under investigation to check if such patterns have influence on the possible long-range dependence and multifractal property.
We segment the continuous double auction of each trading day into 240 successive 1-min intervals. For a given stock, we define an average intertrade duration for each interval as follows,
| (1) |
where is the average duration of the -th interval in the -th trading day, represents the number of intertrade durations of the -th interval in the -th trading day. The average intertrade duration in the -th time interval is calculated as follows,
| (2) |
where is the number of trading days.
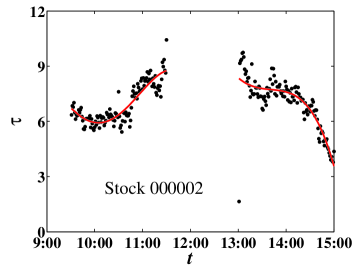
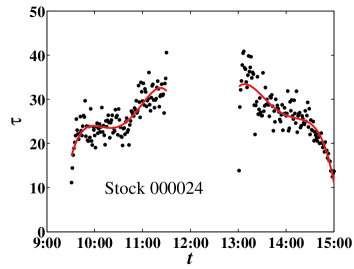
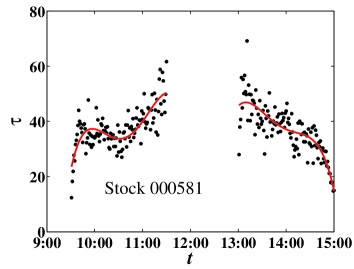
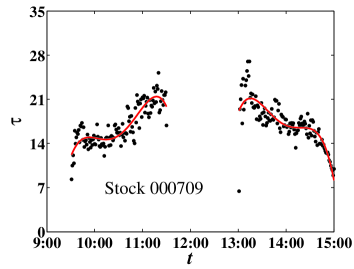
Four stocks (000002, 000024, 000581, 000709) are randomly chosen from the 23 stocks as typical examples to illustrate the results. Fig. 1 depicts the intraday pattern of the intertrade durations for the four stocks. The durations exhibit a crude inverse -shaped pattern. For most stocks, the mean durations in the open and close are much smaller than those in the rest time of the trading day, which indicates heavier trades in the open and close. Our results are in line with the results of IBM transaction data Engle-Russell-1998-Em . More interesting, the duration during the first minute in the afternoon is very low. This phenomenon arises from the institutional features of the Chinese stock market. The traders can submit orders during the nontrading period from 11:30 to 13:00 and these orders are disposed immediately at 13:00, which leads to very high trading activity and small average duration during the 1-min interval right after 13:00.
4 Detrended fluctuation analysis
4.1 Long-range dependence
We first study the temporal correlation in the intertrade duration series. The detrended fluctuation analysis is utilized, which has the ability to extract long-range power-law correlation in non-stationary time series Peng-Buldyrev-Havlin-Simons-Stanley-Goldberger-1994-PRE , Kantelhardt-Bunde-Rego-Havlin-Bunde-2001-PA . For a given intertrade duration series , we can define the cumulative summation series as follows,
| (3) |
The series is covered by disjoint boxes with the same size . When the whole series cannot be completely covered by boxes, we can utilize boxes to cover the series from both ends of the series. In each box, a cubic polynomial trend function of the sub-series is determined. The local detrended fluctuation function in the -th box is defined as the r.m.s. of the fitting residuals:
| (4) |
The overall detrended fluctuation is estimated as follows
| (5) |
As the box size varies in the range of , one can determine a power law relationship between the overall fluctuation function and the box size , which reads,
| (6) |
where signifies the Hurst index, which is related to the power spectrum exponent by and to the autocorrelation exponent by .
We apply the DFA approach to analyze both the original data and the adjusted data. The adjusted data are obtained by removing the intraday pattern from the original data:
| (7) |
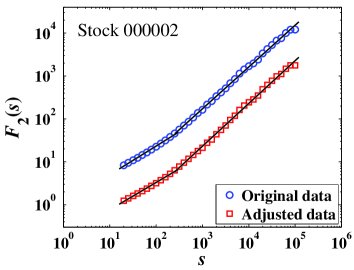
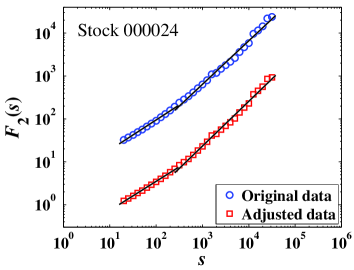
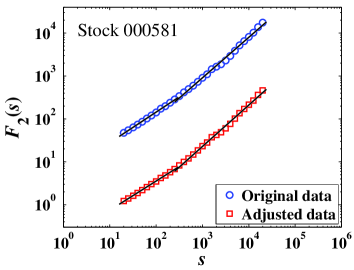
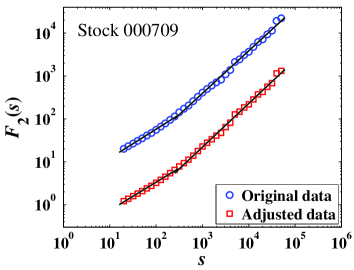
where is the average duration in the -th 1-min interval to which the -th trade belongs. Performing the same analysis on adjusted data can test whether the long dependence of intertrade duration stems from the seasonal periodicity. Fig. 2 shows the log-log plots of the overall fluctuations as a function of the box size for the selected four stocks. For each stock, one can observe a crossover from a scaling range with a lower exponent over to a scaling range with a higher exponent over in the scaling curves for both original and adjusted data. Note that the crossover happens at about . We find that there is only one stock (000720) which does not have a crossover of regimes and, as shown in Table 1, for this stock. Indeed, this stock exhibited very different behavior, whose prices were controlled and manipulated by block investors Zhou-2007-XXX .
The Hurst indexes and for all the stocks are listed in Table 1. One can see that both and are significantly greater than 0.5, indicating the long-range dependence in the intertrade durations. Except for stock 000720, we observe that for all the 22 remaining stocks, which means much stronger correlation for larger in the intertrade durations. Excluding stock 000720, we find that and for the original data and and for the adjusted data. We can conclude that the intraday pattern has minor influence on the long-range dependence in the durations. Furthermore, a systematic difference between the scaling exponents is for the original data and for the adjusted data, which is comparable to the value for the NYSE Ivanov-Yuen-Podobnik-Lee-2004-PRE . In addition, stocks with higher trade activities appear to have stronger autocorrelations in the NYSE and NASDAQ Eisler-Kertesz-2006-EPJB , Yuen-Ivanov-2005-XXX . However, in our dataset, we find no clear dependence between the Hurst index and the average trading activity measured by mean intertrade duration. This observation is far from conclusive, since our database contains only 23 stocks.
| Code | Original data | Adjusted data | |||||||
|---|---|---|---|---|---|---|---|---|---|
| 000001 | 3676 | 0.91 | 0.81 | ||||||
| 000002 | 2084 | 0.90 | 0.82 | ||||||
| 000009 | 1842 | 0.97 | 0.96 | ||||||
| 000012 | 1210 | 0.60 | 0.59 | ||||||
| 000016 | 778 | 0.83 | 0.79 | ||||||
| 000021 | 1695 | 0.83 | 0.77 | ||||||
| 000024 | 553 | 0.82 | 0.76 | ||||||
| 000027 | 1275 | 0.66 | 0.64 | ||||||
| 000063 | 1073 | 0.76 | 0.76 | ||||||
| 000066 | 1146 | 0.77 | 0.78 | ||||||
| 000088 | 376 | 0.68 | 0.67 | ||||||
| 000089 | 775 | 0.85 | 0.79 | ||||||
| 000406 | 1116 | 0.90 | 0.81 | ||||||
| 000429 | 488 | 1.03 | 0.98 | ||||||
| 000488 | 496 | 0.77 | 0.73 | ||||||
| 000539 | 417 | 1.00 | 1.01 | ||||||
| 000541 | 283 | 0.87 | 0.82 | ||||||
| 000550 | 1405 | 0.76 | 0.69 | ||||||
| 000581 | 373 | 0.78 | 0.78 | ||||||
| 000625 | 1643 | 0.63 | 0.52 | ||||||
| 000709 | 853 | 0.69 | 0.61 | ||||||
| 000720 | 486 | 0.61 | 0.59 | ||||||
| 000778 | 651 | 0.72 | 0.64 | ||||||
4.2 Multifractal nature
In this section, we apply a multifractal detrended fluctuation analysis to investigate the multifractal nature of intertrade durations. The overall detrended fluctuation in Eq. (5) is generalized to the following form
| (8) |
where can take any real number except . When , we have
| (9) |
By varying the value of in the range from to , one can expect the detrended fluctuation function scales with the size :
| (10) |
where is the generalized Hurst index. Note that when , is nothing but the Hurst index . The scaling exponent function , which is used to reveal the multifractality in the standard multifractal formalism based on partition function, can be obtained numerically as follows:
| (11) |
where is the fractal dimension of the geometric support of the multifractal measure (in the current case ). The local singularity exponent and its spectrum are related to through the Legendre transformation Halsey-Jensen-Kadanoff-Procaccia-Shraiman-1986-PRA ,
| (12) |
Since the size of each time series is finite, the estimate of will fluctuate remarkably for large values of , especially for large . We focus on to obtain reasonable statistics in the estimation of .
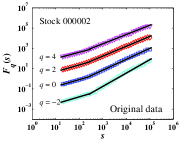
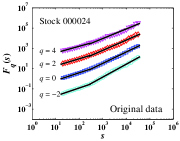
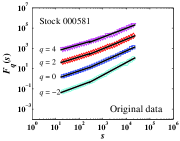
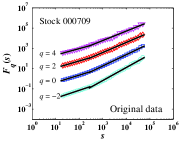
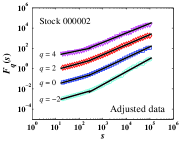
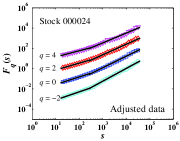
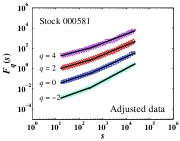
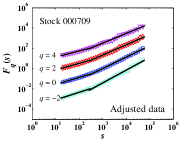
We present the results of the four typical stocks. For comparison, the raw data and the adjusted data after removing the intraday patterns are analyzed. Fig. 3 shows the dependence of the overall fluctuation function on the box size for different values of in log-log coordinates. Nice power laws are observed between and . For each curve, there is a clear kink indicating the crossover from a power-law scaling regime at small sizes to a power-law scaling regime at large sizes. The crossover phenomenon is very common in the detrended fluctuation analysis of many other financial and physical quantities.
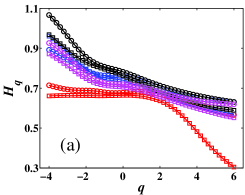
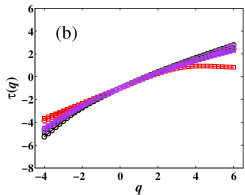
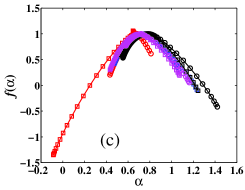
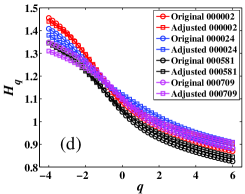
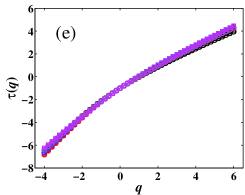
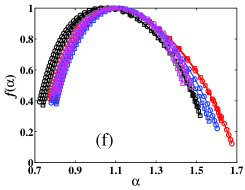
For each case, the scaling exponents in both regimes can be obtained by the linear regression between and in the two scaling ranges. The estimated generalized Hurst indexes are illustrated in Fig. 4(a) for the small-size regime and in Fig. 4(d) for the large-size regime. According to Eq. (11), the mass exponents are estimated. As shown in Fig. 4(b) and Fig. 4(e), the functions exhibit strong nonlinearity, which is a hallmark of multifractality. Fig. 4(c) and Fig. 4(f) illustrate the multifractal singularity spectra , which are obtained by the Legendre transformation of the mass exponents . It is well-known that is an important parameter qualifying the width of the extracted multifractal spectrum. The lager the value, the stronger the multifractality. The values of the singularity width are listed in Table 1 for all the 23 stocks. According to the lower panel of Fig. 4, the intertrade durations in large-size regime show a very neat multifractal nature and the multifractal behaviors of different stocks are comparable to each other. The situation for the small-size regime is more complicated, in which several stocks show different behaviors. For instance, the multifractal spectrum of stock 000002 in Fig. 4(c) has a knot around . For other stocks, the curves are normal. The weakness of the multifractal nature of some stocks are not surprising due to the narrow scaling ranges at small box sizes.
5 Conclusion
We have investigated the intraday pattern, long memory, and multifractaliy of the intertrade durations using the limit order book data and order flows of 23 liquid Chinese stocks traded on the SZSE in 2003. The intertrade duration shows an inverse -shaped intraday pattern for all the 23 stocks, which means much smaller intertrade durations and higher trading activities in the open and close of a trading day. During the noon closure of the market, new information arrives and the average intertrade duration within the first minute of the afternoon trading is also significantly smaller.
The original data and the adjusted data after removing the intraday pattern from the original data are analyzed with the DFA approach. Except stock 000720, all the other stocks exhibit a crossover between two power-law scaling regimes. Intertrade durations in the small-size regime have a relatively small Hurst index, while those in the large-size regime have a relatively large Hurst index. In both regimes, the Hurst indexes are evidently greater than 0.5, confirming long-range memory in the intertrade durations. We also find that the intraday pattern has little influence on the long-range dependence.
In addition, the multifractality in intertrade durations is studied for the two regimes based on the multifractal DFA method. The large-duration regime exhibits a sound multifractal feature for all stocks. In contrast, most of the stocks show multifractality in the small-duration regime. The scaling range of the small-duration regime is narrow and thus the resultant multifractal properties are more or less sensitive to the determination of the crossover point. These results imply that the trading activities are intermittent.
Acknowledgments:
This work was partly supported by the National Natural Science Foundation of China (Grant Nos. 70501011 and 70502007), the Fok Ying Tong Education Foundation (Grant No. 101086), and the Program for New Century Excellent Talents in University (Grant No. NCET-07-0288).
References
- [1] G. M. Viswanathan, V. Afanasyev, S. V. Buldyrev, E. J. Murphy, P. A. Prince, H. E. Stanley, Lévy flight search patterns of wandering albatrosses, Nature 381 (1996) 413–415.
- [2] A. M. Edwards, R. A. Phillips, N. W. Watkins, M. P. Freeman, E. J. Murphy, V. Afanasyev, S. V. Buldyrev, M. G. E. da Luz, E. P. Raposo, H. E. Stanley, G. M. Viswanathan, Revisiting Lévy flight search patterns of wandering albatrosses, bumblebees and deer, Nature 449 (2007) 1044–1049.
- [3] J. G. Oliveira, A.-L. Barabási, Darwin and Einstein correspondence patterns, Nature 437 (2005) 1251.
- [4] D. Brokmann, L. Hufnagel, T. Geisel, The scaling laws of human travel, Nature 439 (2006) 462–465.
- [5] A.-L. Barabási, The origin of bursts and heavy tails in human dynamics, Nature 435 (2005) 207–211.
- [6] A. Vázquez, Exact results for the Barabási model of human dynamics, Phys. Rev. Lett. 95 (2005) 248701.
- [7] A. Vázquez, J. G. Oliveira, Z. Dezsö, K.-I. Goh, I. Kondor, A.-L. Barabási, Modeling bursts and heavy tails in human dynamics, Phys. Rev. E 73 (2006) 036127.
- [8] R. Engle, J. R. Russell, The Autoregressive Conditional Duration Model, Econometrica 66 (1998) 1127–1163.
- [9] R. F. Engle, J. R. Russell, Forecasting the frequency of changes in quoted foreign exchange prices with the autoregressive conditional duration model, J. Emp. Financ. 4 (1997) 187–212.
- [10] R. F. Engle, The econometrics of ultra-high-frequency data, Econometrica 68 (2000) 1–20.
- [11] E. Scalas, R. Gorenflo, F. Mainardi, Fractional calculus and continuous-time finance, Physica A 284 (2000) 376–384.
- [12] F. Mainardi, M. Raberto, R. Gorenflo, E. Scalas, Fractional calculus and continuous-time finance II: The waiting-time distribution, Physica A 287 (2000) 468–481.
- [13] J. Masoliver, M. Montero, G. H. Weiss, Continuous-time random walk model for financial distribution, Phys. Rev. E 67 (2003) 021112.
- [14] E. Scalas, The application of continuous-time random walks in finance and economics, Physica A 362 (2006) 225–239.
- [15] J. Masoliver, M. Montero, J. Perelló, G. H. Weiss, The continunous time random walk formalism in financial markets, J. Econ. Behav. Org. 61 (2006) 577–598.
- [16] Z.-Q. Jiang, W. Chen, W.-X. Zhou, Scaling in the distribution of intertrade durations of Chinese stocks, arXiv:0804.3431 (2008).
- [17] L. Telesca, V. Cuomo, V. Lapenna, M. Macchiato, Detrended fluctuation analysis of the spatial variability of the temporal distribution of Southern California seismicity, Chaos, Solitons & Fractals 21 (2004) 335–342.
- [18] G. Molchan, Interevent time distribution in seismicity: A theoretical approach, Pure Appl. Geophys. 162 (2005) 1135–1150.
- [19] G. Molchan, T. Kronrod, Seismic interevent time: A spatial scaling and multifractality, Pure Appl. Geophys. 164 (2007) 75–96.
- [20] A. Saichev, D. Sornette, “Universal” distribution of interearthquake times explained, Phys. Rev. Lett. 97 (2006) 078501.
- [21] R. Shcherbakov, G. Yakovlev, D. L. Turcotte, J. B. Rundle, Model for the distribution of aftershock interoccurrence times, Phys. Rev. Lett. 95 (2005) 218501.
- [22] A. Corral, Long-term clustering, scaling, and universality in the temporal occurrence of earthquakes, Phys. Rev. Lett. 92 (2004) 108501.
- [23] D. R. Cox, V. Isham, Point Process, 1st Edition, Chapman and Hall, London and New York, 1980.
- [24] L. Sabatelli, S. Keating, J. Dudley, P. Richmond, Waiting time distributions in financial markets, Eur. Phys. J. B 27 (2002) 273–275.
- [25] S.-M. Yoon, J. S. Choi, C. C. Lee, M.-K. Yum, K. Kim, Dynamical volatilities for yen-dollar exchange rates, Physica A 59 (2006) 569–575.
- [26] R. Bartiromo, Dynamic of stock price, Phys. Rev. E 60 (2004) 067108.
- [27] M. Raberto, E. Scalas, F. Mainardi, Waiting-times and returns in high-frequency financial data: An empirical study, Physica A 314 (2002) 749–755.
- [28] P. C. Ivanov, A. Yuen, B. Podobnik, Y.-K. Lee, Common scaling patterns in intertrade times of U. S. stocks, Phys. Rev. E 69 (2004) 056107.
- [29] N. Sazuka, On the gap between an empirical distribution and an exponential distribution of waiting times for price changes in a financial market, Physica A 376 (2007) 500–506.
- [30] K. Kim, S.-M. Yoon, Dynamic behavior of continuous tick data in futures exchange market, Fractals 11 (2) (2003) 131–136.
- [31] K. Kim, S.-M. Yoon, S. Y. Kim, D.-I. Lee, E. Scalas, Dynamical Mechanisms of the Continuous-Time Random Walk, Multifractals,Herd Behaviors and Minority Games in Financial Markets, J. Korean Phys. Soc. 50 (2007) 182–190.
- [32] E. Scalas, R. Gorenflo, H. Luckock, F. Mainardi, M. Mantelli, M. Raberto, Anomalous waiting times in high-frequency financial data, Quant. Financ. 4 (2004) 695–702.
- [33] E. Scalas, R. Gorenflo, H. Luckock, F. Mainardi, M. Mantelli, M. Raberto, On the Intertrade Waiting-time Distribution, Financ. Lett. 3 (2005) 695–702.
- [34] M. Politi, E. Scalas, Fitting the empirical distribution of intertrade durations, Physica A 387 (2008) 2025–2034.
- [35] E. Scalas, T. Kaizoji, M. Kirchler, J. Huber, A. Tedeschi, Waiting times between orders and trades in double-auction markets, Physica A 366 (2006) 463–471.
- [36] M. Politi, E. Scalas, Activity spectrum from waiting-time distribution, Physica A 383 (2007) 43–48.
- [37] J. Jasiak, Persistence in Intertrade durations, Finance 19 (1998) 166–195.
- [38] L. Bauwens, P. Giot, The logarithmic ACD model: An application to the bid-ask quote process of three NYSE stocks, Ann. Econ. Stat. 60 (2000) 117–149.
- [39] M. Y. J. Zhang, J. R. Russell, R. S. Tsay, A nonlinear autoregressive conditional duration model with applications to financial transaction data, J. Econometrics 104 (2001) 179–207.
- [40] L. Bauwens, D. Veredas, The stochastic conditional duration model: A latent variable model for the analysis of financial durations, J. Econometrics 119 (2004) 381–412.
- [41] A. Yuen, P. C. Ivanov, Impact of Stock Market Structure on Intertrade Time and Price Dynamics, physics/0508203 (2005).
- [42] Z. Eisler, J. Kertész, Size matters: Some stylized facts of the stock market revisited, Eur. Phys. J. B 51 (2006) 145–154.
- [43] P. Oświȩcimka, J. Kwapień, S. Drożdż, Multifractality in the stock market: price increments versus waiting times, Physica A 347 (2005) 626–638.
- [44] G.-F. Gu, W. Chen, W.-X. Zhou, Quantifying bid-ask spreads in the Chinese stock market using limit-order book data: Intraday pattern, probability distribution, long memory, and multifractal nature, Eur. Phys. J. B 57 (2007) 81–87.
- [45] Z.-Q. Jiang, L. Guo, W.-X. Zhou, Endogenous and exogenous dynamics in the fluctuations of capital fluxes: An empirical analysis of the Chinese stock market, Eur. Phys. J. B 57 (2007) 347–355.
- [46] Z.-Q. Jiang, W.-X. Zhou, Scale invariant distribution and multifractality of volatility multiplier in stock markets, Physica A 381 (2007) 343–350.
- [47] Z.-Q. Jiang, W.-X. Zhou, Multifractality in stock indexes: Fact or Fiction?, Physica A 387 (2008) 3605–3614.
- [48] Z.-Q. Jiang, W.-X. Zhou, Multifractal analysis of Chinese stocks based on partition function approach, Physica A 387 (2008) 4881–4888.
- [49] Z.-Q. Jiang, W.-X. Zhou, Direct evidence for inversion formula in multifractal financial volatility measure, arXiv:0801.3494 (2008).
- [50] M. M. Cornett, T. V. Schwarz, A. C. Szakmary, Seasonalities and intraday return patterns in the foreign currency futures market, J. Bank. Financ. 19 (1995) 843–869.
- [51] T. G. Andersen, T. Bollerslev, Intraday periodicity and volatility persistence in financial markets, J. Emp. Financ. 4 (1997) 115–158.
- [52] T. H. Mcinish, R. A. Wood, An analysis of intraday patterns in bid/ask spreads for NYSE stocks, J. Financ. 47 (1992) 753–764.
- [53] K. C. Chan, W. G. Christie, P. H. Schultz, Market structure and the intraday pattern of bid-ask spreads for NASDAQ securities, J. Business 68 (1995) 35–60.
- [54] X.-H. Ni, W.-X. Zhou, Intraday pattern in bid-ask spreads and its power-law relaxation for Chinese A-share stocks, arXiv:0710.2402 (2007).
- [55] P. C. Jain, G.-H. Joh, The dependence between hourly prices and trading volume, J. Financ. Quart. Anal. 23 (3) (1988) 269–283.
- [56] A. R. Admati, P. Pfleiderer, A theory of intraday patterns: Volume and price variability, Rev. Financ. Stud. 1 (1988) 3–40.
- [57] C. M. Hafner, Durations, volume and the prediction of financial returns in transaction time, Quant. Financ. 5 (2005) 145–152.
- [58] S. Anatolyev, D. Shakin, Trade intensity in the Russian stock market: dynamics, distribution and determinants, Appl. Financ. Econ. 17 (2007) 87–104.
- [59] J. W. Kantelhardt, E. Koscielny-Bunde, H. H. A. Rego, S. Havlin, A. Bunde, Detecting long-range correlations with detrended fluctuation analysis, Physica A 295 (2001) 441–454.
- [60] C.-K. Peng, S. V. Buldyrev, S. Havlin, M. Simons, H. E. Stanley, A. L. Goldberger, Mosaic organization of DNA nucleotides, Phys. Rev. E 49 (1994) 1685–1689.
- [61] W.-X. Zhou, Universal price impact functions of individual trades in an order-driven market, http://arxiv.org/abs/0708.3198v2 (2007).
- [62] T. C. Halsey, M. H. Jensen, L. P. Kadanoff, I. Procaccia, B. I. Shraiman, Fractal measures and their singularities: The characterization of strange sets, Phys. Rev. A 33 (1986) 1141–1151.