Klingelbergstrasse 82, CH-4056 Basel, Switzerland. 22email: g-a.tammann@unibas.ch 33institutetext: A. Sandage 44institutetext: Observatories of the Carnegie Institution of Washington,
813 Santa Barbara Street, Pasadena, CA 91101
The expansion field: The value of
Abstract
Any calibration of the present value of the Hubble constant () requires recession velocities and distances of galaxies. While the conversion of observed velocities into true recession velocities has only a small effect on the result, the derivation of unbiased distances which rest on a solid zero point and cover a useful range of about 4 to 30 Mpc is crucial. A list of 279 such galaxy distances within is given which are derived from the tip of the red-giant branch (TRGB), from Cepheids, and/or from supernovae of type Ia (SNe Ia). Their random errors are not more than as shown by intercomparison. They trace a linear expansion field within narrow margins, supported also by external evidence, from to at least . Additional 62 distant SNe Ia confirm the linearity to at least . The dispersion about the Hubble line is dominated by random peculiar velocities, amounting locally to but increasing outwards. Due to the linearity of the expansion field the Hubble constant can be found at any distance Mpc. RR Lyr star-calibrated TRGB distances of 78 galaxies above this limit give at an effective distance of Mpc. They compensate the effect of peculiar motions by their large number. Support for this result comes from 28 independently calibrated Cepheids that give at 15 Mpc. This agrees also with the large-scale value of from the distant, Cepheid-calibrated SNe Ia. A mean value of is adopted. Because the value depends on two independent zero points of the distance scale its systematic error is estimated to be 6%. – Other determinations of are discussed. They either conform with the quoted value (e.g. line width data of spirals or the method of E galaxies) or are judged to be inconclusive. Typical errors of come from the use of a universal, yet unjustified P-L relation of Cepheids, the neglect of selection bias in magnitude-limited samples, or they are inherent to the adopted models.
Keywords:
Stars: Population II Cepheids supernovae: general distance scale cosmological parameters1 Introduction
It is said sometimes that once in a career, every astronomer is entitled to write a paper on the value of the Hubble constant. To the point, several compilations of the growing literature on since 1970 have been made. Those by Press (1997), Tammann & Reindl (2006) and Huchra (2007) are examples.
These authors plot histograms of the distribution of from about 400 papers since 1970. The sample is so large that the formal error on the average of the histogram is so small that one might infer that the Hubble constant is now known to better than say 1%. Of course, what is missing is the fact that most of the values in the literature are not correct. Many suffer from the neglect of the effects of an observational selection bias that varies with distance.
We are faced with a problem in writing this review. Do we strive to give a comprehensive history of the distance scale problem beginning with the first determination of the Hubble constant by Lemaître (1927, 1931); Robertson (1928); Hubble (1929b), and Hubble & Humason (1931, 1934) to be about (units assumed hereafter), coming into modern times with the debates between the principal players? Or do we only write about the situation as it exists today, comparing the “concordance” value of by Freedman et al. (2001) with the HST supernovae calibration value (Hamuy et al. 1996; Tripp & Branch 1999; Suntzeff et al. 1999; Saha et al. 2006, hereafter STT 06; Sandage et al. 2006, hereafter STS 06) that gives ? We have decided to take the latter course but also to sketch as a skeleton the beginning of the correction to Hubble’s 1930-1950 distance scale that started with the commissioning of the 200-inch telescope in 1949. An important comprehensive review of this early period before the Hubble Space Telescope (HST) is by Rowan-Robinson (1985); the details are not repeated here.
1.1 Early work on the revision to Hubble’s distance scale (1950-1990)
Hubble’s extragalactic distance scale was generally believed from 1927 to about 1950, beginning with the first determinations of the Hubble constant by the four independent authors cited above. This scale lasted until Hubble’s (1929a) distance to M 31 was nearly tripled by Baade (1954) in his report to the 1952 Rome meeting of the IAU. He proposed a revision of the Cepheid P-L relation zero point by about based on his discovery that RR Lyrae stars could not be detected with the newly commissioned 200-inch Palomar telescope in M 31 at . From this he concluded that M 31 must be well beyond the modulus of given earlier by Hubble. The story is well known and is recounted again by Osterbrock (2001, Chapter 6), in the Introduction to Tammann et al. (2008), hereafter TSR 08, and often in histories elsewhere (e.g. Trimble, 1996; Sandage, 1999a) .
Following Baade’s discovery, the revision of 1930-1950 scale was begun anew with the Palomar 200-inch telescope, largely following Hubble’s (1951) proposed cosmological program for it. Observational work on the first Cepheid distance beyond the Local Group was completed for NGC 2403. Here we made photoelectric calibrations of magnitude scales and used new calibrations of the Cepheid P-L relations (Kraft, 1961, 1963; Sandage & Tammann, 1968, 1969), and we obtained a revised distance modulus of (Tammann & Sandage, 1968). Comparing this with Hubble’s modulus of 24.0 showed the large scale difference by a factor of 5.2. Next, the modulus of the more remote galaxy, M 101, was determined to be (Sandage & Tammann, 1974a) compared with Hubble’s modulus of 24.0, giving the large correction factor of 11.5 to Hubble’s scale at M 101 (Mpc). This large stretching was again found in our distance modulus of for the Virgo cluster (Sandage & Tammann, 1974b, 1976, 1990, 1995), compared with Hubble’s modulus of 26.8. The distance ratio here is a factor of 9.6.
These large factors and their progression with distance came as a major shock in the mid 1970s and were not generally believed (eg. Madore, 1976; Hanes, 1982; de Vaucouleurs, 1982, etc.). However, the new large distances were confirmed for NGC 2403 by Freedman & Madore (1988), and for M 101 by Kelson et al. (1996) and Kennicutt et al. (1998). Although our distance to the Virgo cluster core is still in contention at the 20% level, there is no question that the correction factor here is also between 7 and 10 at Mpc.
1.2 The difficulty of finding
The determination of , the present and hence nearby value of the Hubble parameter, requires – besides true recession velocities – distance indicators with known zero point and with known intrinsic dispersion. The scatter of the Hubble diagram, versus or , would in principle be a good diagnostic for the goodness of a given distance indicator if it were not also caused by peculiar motions. It is of prime importance to disentangle these two sources of scatter because unacknowledged intrinsic scatter of the available distances introduces a systematic increase of with distance if flux-limited samples are considered, which is normally the case. This is because the mean absolute magnitude of objects in such samples increases with distance due to the increasing discrimination against the less luminous objects. It is important to note that, strictly speaking, this incompleteness bias is not the Malmquist (1920, 1922) bias which applies only to the average effect integrated over the sample being studied; not to individual distances within that sample, each of which must be corrected by a sliding scale.
Neglect of the individual bias values that become progressively larger with increasing distance always gives a Hubble constant that incorrectly appears to increase outward (de Vaucouleurs, 1958, 1976, 1977; Tully, 1988).
The widely held view that the increase of with distance (up to an unspecified limit) was real deprived the Hubble diagram of its second diagnostic power. The slope of the Hubble line had no longer to be , which is the case for linear expansion (see hereafter Eq. 1). The apparent increase of with distance was not anymore accepted as proof for bias (e.g. Tammann 1987 versus Aaronson 1987). It also led to proposals that not only varied with distance, but also with direction (de Vaucouleurs & Bollinger, 1979; de Vaucouleurs & Peters, 1985). The search for the asymptotic value of became self-defeating: one tried to calibrate it at the largest possible distances where, however, the effects of bias are largest.
The bias is always present in a flux limited sample of field galaxies (Sandage, 1994a, b, 1995; Federspiel et al., 1994, as analyzed using Spaenhauer diagrams). It is also present in cluster data that are incomplete (Teerikorpi, 1987, 1990; Kraan-Korteweg et al., 1988; Fouqué et al., 1990; Sandage et al., 1995; Sandage, 2008), and even in field galaxies of any sample that is distance limited but if the data are incomplete in the coverage of the distance indicator (apparent magnitude, 21cm line width, etc.) (Sandage, 2008).
However, claims for increasing outwards were contradicted by the apparent magnitudes of first-ranked galaxies in clusters and groups. The Hubble diagram of brightest cluster galaxies shows no deviations from linear expansion down to (Sandage et al., 1972; Sandage & Hardy, 1973; Kristian et al., 1978, and references therein). This was confirmed down to in a study of northern and southern groups (Sandage, 1975), which also showed a smooth linear Hubble diagram with no discontinuities over the range of . The limit on was , and a proof was given that the Hubble constant does not increase outward. These results were confirmed by Federspiel et al. (1994) based on the large catalog of 21cm line widths and magnitudes by Mathewson et al. (1992a, b), and also in the large archive literature cited therein by many others. However, it was so far not possible to tie the local expansion field below Mpc into the large-scale field because of small-number statistics and of large scatter caused by the important effects of peculiar velocities and distance errors. This problem is the subject of Sect. 2.
In parallel to the discussion on distance errors there were many attempts to determine the mean size of the random one-dimensional peculiar velocities by reading the deviations from the Hubble line vertically as velocity residuals, but this is not easier than to determine the dispersion of the distance indicators because the latter have to be known. In fact the problem is here even deeper. The halted expansion of the Local Group, the retarded expansion by the gravity of the Virgo complex, the large virial velocities in clusters, and the increase of peculiar motions with distance, as manifested by the important velocity of a large volume with respect to the CMB dipole all make it difficult to find the characteristic peculiar velocities of field galaxies.
One of the earliest attempts to determine a cosmological parameter of interest (other than ) was that by Hubble and Humason to measure the mean random velocity of galaxies about an ideal Hubble flow. This, in turn, is related to any systematic streaming, or more complicated systematic motions (a dipole plus even a quadrupole, a shear, or a local rotation) relative to a cosmic frame (Davis & Peebles 1983a for a review; see also Dekel 1994). The discussion by Hubble & Humason (1931) gave values between and for the mean random motion (they do not quote an rms value) about the ridge line of the redshift-distance relation for local galaxies ().
By 1972 a limit was set of on local scales (Sandage, 1972). In subsequent papers, too numerous to be cited here, rather lower values were favored (e.g. Sandage & Tammann, 1975a; Giraud, 1986; Sandage, 1986a; Ekholm et al., 2001; Thim et al., 2003). In a representative study Karachentsev & Makarov (1996) found , supported by later papers of Karachentsev and collaborators. The values of in function of scale length agree locally (see Sect. 2.5), but clearly increase with distance.
2 The local expansion field
The search for the cosmic (global) value of the Hubble constant requires some a priori knowledge of the expansion field. How linear is the expansion? Does vary with distance? How large are typical peculiar motions and/or streaming velocities which may lead to incorrect results on ? Only once these questions are answered it is possible to judge the goodness of other distance indicators by the shape and the tightness of their Hubble diagrams. While a detailed mapping of non-Hubble motions in function of individual density fluctuations is important in its own right, it is not necessary here. For the average value of from an all-sky sample of galaxies it is enough to know the dependence of on distance over scales of Mpc as well as the effect of peculiar motions on the available sample. The problem of large virial motions in clusters can be circumvented by assigning the mean cluster velocity to individual members.
Mapping the expansion field requires hence a significant number of relative distances with a sufficient range and with minimum intrinsic scatter to guard against selection effects which distort the field. Even in case of more than one distance indicator used for the mapping, only relative distances are needed because they can be combined by requiring that they obey the same expansion rate within a given distance range, i.e. that they have the same intercept of the Hubble diagram. Note that
| (1) |
| (2) |
( is the apparent, absorption-corrected magnitude of a galaxy at wavelength ; is the corresponding absolute magnitude). In case that the mean absolute magnitude is assumed to be known or that the true distance moduli are known this becomes
| (3) |
| (4) |
Many data have become available during the last years for three distance indicators that are ideally suited for the purpose of expansion field mapping because they provide distance moduli with random errors of only (corresponding to 7.5% in distance) as shown in Section 3 by intercomparison. These distance indicators are the tip of the red-giant branch (TRGB), classical Cepheids, and supernovae of type Ia at maximum luminosity (SNe Ia). Table LABEL:tab:dist below lists 240 TRGB, 43 Cepheid, and 22 SNe Ia distances outside the Local Group, which provide the backbone of the determination of .
Although relative distances are all that is needed to test the linearity of the expansion field and its peculiar motions, absolute distances as zero-pointed in Section 3 will be used in the following simply because they are available. This has the advantage that differences of the intercept of the particular Hubble diagrams yield an estimate of the systematic error of the adopted distance scale.
2.1 Corrections of the distances and of the velocities
All distances in this paper (outside the Local Group) are transformed to the barycenter of the Local Group which is assumed to lie at the distance of Mpc in the direction of M 31, i.e. at two thirds of the way to this galaxy, because the galaxies outside the Local Group expand presumably away from the barycenter and not away from the observer. Distance moduli from the observer, corrected for Galactic absorption, are designated with , while stands for the moduli reduced to the barycenter.
The heliocentric velocities are corrected to the barycenter of the Local Group following Yahil et al. (1977) and – except for Local Group galaxies – for a self-consistent Virgocentric infall model assuming a local infall vector of and a density profile of the Virgo complex of (Yahil et al. 1980, Dressler 1984, Kraan-Korteweg 1986, de Freitas Pacheco 1986, Giraud 1990, Jerjen & Tammann 1993, see Eq. (5) in STS 06). The choice of these particular corrections among others proposed in the literature is justified because they give the smallest scatter in the Hubble diagrams (STS 06). Velocities relative to the barycenter are designated with ; velocities corrected for Virgocentric infall (which makes of course no sense for members of the bound Local Group) are designated with . – The velocities of galaxies outside the Local Group are also corrected for the projection angle between the observer and the Local Group barycenter as seen from the galaxy, but the correction is negligible except for the very nearest galaxies.
The Virgocentric infall corrections are only a first approximation. The actual velocity field is much more complex as seen in the model of Klypin et al. (2003). But any such corrections have surprisingly little influence on the all-sky value of even at small distances (Sect. 3.4.2). The main effect of the adopted infall-corrected velocities is that they yield a noticeably smaller dispersion of the Hubble diagram, as stated before, than velocities which are simply reduced to the barycenter of the Local Group.
Galaxies with are in addition corrected for the CMB dipole motion on the assumption that the comoving local volume extends out to this distance (Federspiel et al., 1994). Even if the merging into the background field kinematics takes place as far out as (Dale & Giovanelli, 2000) it has no noticeable effect on the present conclusions.
2.2 The Hubble diagram of TRGB distances
The galaxies outside the Local Group with available TRGB distances are listed in Table LABEL:tab:dist. The identifications of the galaxies in Col. 1 are from the NED (NASA Extragalactic Database, http://nedwww.ipac.caltech.edu/index.html); in some cases they are here slightly abbreviated. Alternative designations are given in the same source. The group assignments in Col. 2 are evaluated from various sources. The heliocentric velocities in Col. 3 are from the NED. The distances in Col. 9 are the straight mean of the available distance determinations as seen from the observer. Col. 10 gives the mean distances reduced to the barycenter of the Local Group. The latter are plotted in a Hubble diagram (Fig. 1a). The 78 galaxies with distances Mpc and up to Mpc yield a free-fit Hubble line with slope if is used as the independent variable, and with slope if is used as the independent variable. The orthogonal solution, i.e. the mean of the two previous solutions, gives a slope of , which is so close to 0.2 that a forced fit with slope 0.2 is justified even for this very local volume.
The dispersion in Fig. 1a, read in , is . This value rests mainly on the effect of peculiar motions. The random error of the distances is not more than (Sect. 3.4.1). Also observational errors of the velocities contribute little to the dispersion. Hence the contribution of the peculiar motions must be close to .
A still closer sample of 20 TRGB galaxies in Table LABEL:tab:dist within the narrow distance interval Mpc can of course not provide a test for the slope. Yet assuming a slope of 0.2 gives the same intercept and hence the same mean Hubble constant as from the more distant TRGB distances to within 5%. The dispersion of this nearby sample is large at . It may be increased by observational velocity errors, which for some dwarf galaxies may amount to . Therefore the contribution of the peculiar velocities is here not well determined.
| Galaxy | Group | Ref | ||||||||
|---|---|---|---|---|---|---|---|---|---|---|
| (1) | (2) | (3) | (4) | (5) | (6) | (7) | (8) | (9) | (10) | (11) |
| WLM | LG | -122 | -11 | 24.87 | 24.82 | 24.84 | 24.47 | 1,2 | ||
| E349-031 | 221 | 222 | 27.53 | 27.53 | 27.47 | 3 | ||||
| N0055 | Scl1 | 129 | 117 | 26.64 | 26.41 | 26.53 | 26.51 | 4,5 | ||
| E410-05 | 26.43 | 26.43 | 26.34 | 5,6 | ||||||
| I0010 | LG | -348 | -50 | 23.56 | 23.56 | 21.15 | 7 | |||
| Sc22 | Scl2 | 28.12 | 28.12 | 28.02 | 6 | |||||
| Cetus | LG | 24.42 | 24.42 | 23.93 | 1,6 | |||||
| E294-10 | 117 | 89 | 26.49 | 26.49 | 26.50 | 6,8 | ||||
| N0147 | LG | -193 | 103 | 24.20 | 24.27 | 24.23 | 21.28 | 1,6 | ||
| And III | M31 | -351 | -71 | 24.36 | 24.39 | 24.38 | 21.70 | 1,6 | ||
| N0185 | LG | -202 | 92 | 24.13 | 24.03 | 24.08 | 20.67 | 2,9 | ||
| N0205 | M31 | -241 | 48 | 24.65 | 24.59 | 24.62 | 22.38 | 1,6 | ||
| And IV | M31 | 256 | 545 | 28.93 | 28.93 | 28.73 | 6 | |||
| N0221 | M31 | -200 | 87 | 24.43 | 24.43 | 21.80 | 6 | |||
| N0224 | M31 | -300 | -13 | 24.60 | 24.46 | 24.27 | 24.44 | 21.83 | 1,2 | |
| I1574 | 363 | 393 | 28.56 | 28.56 | 28.47 | 6,8 | ||||
| And I | M31 | -368 | -87 | 24.44 | 24.44 | 24.44 | 21.86 | 1,6 | ||
| N0247 | Scl2 | 156 | 202 | 27.81 | 27.81 | 27.68 | 3 | |||
| N0253 | Scl2 | 243 | 267 | 27.98 | 27.98 | 27.88 | 6 | |||
| E540-30 | Scl2 | 27.66 | 27.66 | 27.50 | 6 | |||||
| E540-31 | Scl2 | 295 | 344 | 27.62 | 27.62 | 27.48 | 6 | |||
| E540-32 | Scl2 | 27.67 | 27.67 | 27.52 | 6 | |||||
| SMC | LG | 158 | -24 | 18.98 | 19.00 | 18.99 | 23.77 | 2 | ||
| And IX | -216 | 72 | 24.40 | 24.40 | 21.72 | 1 | ||||
| N0300 | Scl1 | 144 | 128 | 26.56 | 26.48 | 26.52 | 26.49 | 2 | ||
| Sculptor | LG | 110 | 111 | 19.59 | 19.61 | 19.60 | 23.60 | 2 | ||
| LGS-3 | -287 | -70 | 24.20 | 24.20 | 22.08 | 1,6 | ||||
| I1613 | LG | -234 | -65 | 24.35 | 24.33 | 24.32 | 24.33 | 23.35 | 2 | |
| U685 | 157 | 353 | 28.38 | 28.38 | 28.15 | 5,6 | ||||
| KKH5 | 61 | 368 | 28.15 | 28.15 | 27.86 | 6 | ||||
| N0404 | -48 | 221 | 27.43 | 27.43 | 27.01 | 6 | ||||
| And V | M31 | -403 | -121 | 24.47 | 24.47 | 22.07 | 1,10 | |||
| And II | M31 | -188 | 90 | 24.15 | 24.11 | 24.13 | 21.14 | 1,6 | ||
| UA17 | Cet | 1959 | 1940 | 33.18 | 33.18 | 33.16 | ||||
| N0598 | LG | -179 | 70 | 24.77 | 24.66 | 24.64 | 24.69 | 22.85 | 1,2 | |
| KKH6 | 53 | 352 | 27.86 | 27.86 | 27.53 | 3 | ||||
| N0625 | 396 | 338 | 28.05 | 28.05 | 28.04 | 6 | ||||
| E245-05 | 391 | 319 | 28.23 | 28.23 | 28.23 | 6 | ||||
| U1281 | 156 | 399 | 28.55 | 28.55 | 28.32 | 5,8 | ||||
| Phoenix | LG | 56 | -16 | 23.05: | 23.22 | 23.22 | 24.16 | 6 | ||
| KK16 | 207 | 430 | 28.62 | 28.62 | 28.40 | 5,11 | ||||
| KK17 | 168 | 394 | 28.41 | 28.41 | 28.17 | 5,6 | ||||
| N0784 | 198 | 423 | 28.58 | 28.58 | 28.36 | 5 | ||||
| N0891 | 528 | 793 | 29.96 | 29.96 | 29.84 | 12 | ||||
| N0925 | 553 | 782 | 29.84 | 29.84 | 29.72 | |||||
| E115-21 | 515 | 373 | 28.43 | 28.43 | 28.50 | 5,8 | ||||
| Fornax | LG | 53 | 3 | 20.67 | 20.72 | 20.70 | 23.64 | 13 | ||
| E154-23 | 574 | 444 | 28.80 | 28.80 | 28.84 | 5 | ||||
| KKH18 | 216 | 437 | 28.23 | 28.23 | 27.99 | 6 | ||||
| N1313 | 470 | 307 | 28.15 | 28.15 | 28.26 | 2 | ||||
| N1311 | 568 | 439 | 28.68 | 28.68 | 28.73 | 5 | ||||
| KK27 | 28.04 | 28.04 | 28.16 | 5,6 | ||||||
| N1316 | For | 1760 | 1371 | 31.48 | 31.48 | 31.48 | ||||
| N1326A | For | 1831 | 1371 | 31.17 | 31.17 | 31.17 | ||||
| I1959 | 640 | 511 | 28.91 | 28.91 | 28.95 | 5 | ||||
| N1365 | For | 1636 | 1371 | 31.46 | 31.46 | 31.46 | ||||
| N1380 | For | 1877 | 1371 | 31.81 | 31.81 | 31.81 | ||||
| N1425 | For | 1510 | 1371 | 31.96 | 31.96 | 31.95 | ||||
| N1448 | 1168 | 1015 | 31.78 | 31.78 | 31.79 | |||||
| KK35 | I342 | 105 | 382 | 27.50 | 27.50 | 27.19 | 6 | |||
| UA86 | I342 | 67 | 337 | 27.36 | 27.36 | 27.04 | 3 | |||
| Cam A | I342 | -46 | 232 | 27.97 | 27.97 | 27.74 | 6 | |||
| UA92 | I342 | -99 | 155 | 27.39 | 27.39 | 27.09 | 3 | |||
| N1560 | I342 | -36 | 234 | 27.70 | 27.70 | 27.44 | 6,8 | |||
| N1637 | 717 | 740 | 30.40 | 30.40 | 30.37 | |||||
| Cam B | I342 | 77 | 335 | 27.62 | 27.62 | 27.36 | 6 | |||
| N1705 | 633 | 474 | 28.54 | 28.54 | 28.62 | 6 | ||||
| UA105 | I342 | 111 | 351 | 27.49 | 27.49 | 27.23 | 6 | |||
| LMC | LG | 278 | 42 | 18.53 | 18.59 | 18.56 | 23.78 | 2 | ||
| N2090 | 921 | 810 | 30.48 | 30.48 | 30.50 | |||||
| KKH34 | 110 | 374 | 28.32 | 28.32 | 28.15 | 6 | ||||
| E121-20 | 575 | 390 | 28.91 | 28.91 | 29.01 | 3 | ||||
| E489-56 | 492 | 371 | 28.49 | 28.49 | 28.56 | 6 | ||||
| E490-17 | 504 | 371 | 28.13 | 28.13 | 28.22 | 6 | ||||
| Carina | LG | 229 | -14 | 20.09 | 20.00 | 20.05 | 23.89 | 6 | ||
| KKH37 | -148 | 106 | 27.65 | 27.65 | 27.43 | 3 | ||||
| FG202 | 564 | 358 | 28.45 | 28.45 | 28.60 | 6 | ||||
| U3755 | 315 | 335 | 29.35 | 29.35 | 29.35 | 5,11 | ||||
| DDO43 | 354 | 507 | 29.46 | 29.46 | 29.42 | 6 | ||||
| N2366 | N2403 | 80 | 293 | 27.55 | 27.55 | 27.36 | 11 | |||
| E059-01 | 530 | 312 | 28.30 | 28.30 | 28.47 | 3 | ||||
| DDO44 | N2403 | 27.52 | 27.52 | 27.34 | 6,14 | |||||
| N2403 | N2403 | 131 | 327 | 27.43 | 27.43 | 27.25 | ||||
| DDO47 | 272 | 309 | 29.53 | 29.53 | 29.53 | 5 | ||||
| KK65 | 279 | 314 | 29.52 | 29.52 | 29.52 | 5 | ||||
| U4115 | 341 | 352 | 29.44 | 29.44 | 29.46 | 5 | ||||
| N2541 | 548 | 780 | 30.50 | 30.50 | 30.47 | |||||
| Ho II | N2403 | 142 | 350 | 27.65 | 27.65 | 27.49 | 6 | |||
| KDG52 | N2403 | 113 | 322 | 27.75 | 27.75 | 27.59 | 6 | |||
| DDO52 | 397 | 555 | 30.06 | 30.06 | 30.04 | 3 | ||||
| DDO53 | N2403 | 20 | 204 | 27.76 | 27.76 | 27.63 | 6 | |||
| U4483 | N2403 | 156 | 354 | 27.53 | 27.53 | 27.37 | 6 | |||
| D564-08 | 483 | 473 | 29.69 | 29.69 | 29.72 | 3 | ||||
| D634-03 | 318 | 290 | 29.90 | 29.90 | 29.94 | 3 | ||||
| D565-06 | 498 | 483 | 29.79 | 29.79 | 29.82 | 3 | ||||
| N2841 | 638 | 882 | 30.75 | 30.75 | 30.73 | |||||
| U4998 | 623 | 870 | 29.63 | 29.63 | 29.57 | 14 | ||||
| N2915 | 468 | 238 | 27.89 | 27.89 | 28.12 | 6 | ||||
| I Zw 18 | 751 | 971 | 30.32 | 30.32 | 30.30 | 15 | ||||
| Ho I | M81 | 139 | 337 | 27.92 | 27.92 | 27.80 | 6 | |||
| F8D1 | M81 | 27.88 | 27.88 | 27.77 | 6 | |||||
| FM1 | M81 | 27.67 | 27.67 | 27.55 | 6 | |||||
| N2976 | M81 | 3 | 179 | 27.76 | 27.76 | 27.64 | 6 | |||
| KK77 | M81 | 27.71 | 27.71 | 27.60 | 6 | |||||
| N3021 | 1541 | 1840 | 32.62 | 32.62 | 32.62 | |||||
| BK3N | M81 | -40 | 145 | 28.02 | 28.02 | 27.91 | 6 | |||
| N3031 | M81 | -34 | 147 | 27.80 | 27.80 | 27.80 | 27.68 | 2 | ||
| N3034 | M81 | 203 | 390 | 27.85 | 27.85 | 27.73 | 6,8 | |||
| KDG61 | M81 | -135 | 42 | 27.78 | 27.78 | 27.67 | 6 | |||
| Ho IX | M81 | 46 | 228 | 27.84 | 27.84 | 27.73 | 16 | |||
| A0952+69 | M81 | 99 | 285 | 27.94 | 27.94 | 27.83 | 6 | |||
| Leo A | LG | 24 | -12 | 24.54 | 24.19 | 24.37 | 24.97 | 6 | ||
| SexB | LG | 300 | 138 | 25.75 | 25.75 | 26.21 | 2 | |||
| KKH57 | M81 | 27.97 | 27.97 | 27.89 | 6 | |||||
| N3109 | LG | 403 | 129 | 25.54 | 25.45 | 25.50 | 26.18 | 2 | ||
| N3077 | M81 | 14 | 194 | 27.91 | 27.91 | 27.80 | 6 | |||
| Antlia | LG | 362 | 85 | 25.55 | 25.55 | 26.22 | 5,6 | |||
| BK5N | M81 | 27.89 | 27.89 | 27.78 | 6 | |||||
| KDG63 | M81 | -129 | 34 | 27.72 | 27.72 | 27.62 | 6 | |||
| KDG64 | M81 | -18 | 155 | 27.84 | 27.84 | 27.73 | 6 | |||
| U5456 | 544 | 391 | 27.90 | 27.90 | 28.05 | 6 | ||||
| IKN | M81 | 27.87 | 27.87 | 27.76 | 3 | |||||
| Leo I | LG | 285 | 154 | 22.01 | 22.01 | 24.19 | ||||
| SexA | LG | 324 | 117 | 25.74 | 25.74 | 26.28 | 2 | |||
| Sex dSph | LG | 224 | 29 | 19.69 | 19.77 | 19.73 | 23.88 | 6 | ||
| N3190 | 1271 | 1574 | 32.15 | 32.15 | 32.16 | |||||
| N3198 | 663 | 858 | 30.80 | 30.80 | 30.80 | |||||
| HS117 | M81 | -37 | 155 | 27.99 | 27.99 | 27.88 | 3 | |||
| DDO78 | M81 | 55 | 226 | 27.85 | 27.85 | 27.75 | 6 | |||
| I2574 | M81 | 57 | 235 | 28.02 | 28.02 | 27.92 | 6 | |||
| DDO82 | M81 | 56 | 246 | 28.01 | 28.01 | 27.90 | 6 | |||
| BK6N | M81 | 27.93 | 27.93 | 27.84 | 6 | |||||
| N3319 | 739 | 878 | 30.74 | 30.74 | 30.75 | |||||
| N3351 | LeoI | 778 | 588 | 30.23 | 30.10 | 30.17 | 30.23 | 2,17 | ||
| N3368 | LeoI | 897 | 715 | 30.34 | 30.50 | 30.42 | 30.47 | |||
| N3370 | 1279 | 1606 | 32.37 | 32.47 | 32.42 | 32.44 | ||||
| N3379 | LeoI | 911 | 721 | 30.32 | 30.32 | 30.37 | 18 | |||
| KDG73 | 116 | 297 | 27.91 | 27.91 | 27.81 | 19 | ||||
| E215-09 | 598 | 345 | 28.60 | 28.60 | 28.80 | 20 | ||||
| Leo II | LG | -87 | -172 | 21.58 | 21.72 | 21.65 | 24.08 | 6,21 | ||
| N3621 | 730 | 487 | 29.27 | 29.30 | 29.29 | 29.44 | 2 | |||
| N3627 | LeoI | 727 | 428 | 30.50 | 30.41 | 30.46 | 30.51 | |||
| U6456 | -103 | 133 | 28.19 | 28.19 | 28.06 | 6,8 | ||||
| U6541 | CVn | 250 | 297 | 27.95 | 27.95 | 27.96 | 6 | |||
| N3738 | CVn | 229 | 316 | 28.45 | 28.45 | 28.43 | 6 | |||
| N3741 | CVn | 229 | 251 | 27.46 | 27.46 | 27.51 | 5,6 | |||
| E320-14 | 654 | 402 | 28.92 | 28.92 | 29.10 | 20 | ||||
| KK109 | CVn | 212 | 217 | 28.27 | 28.27 | 28.30 | 6 | |||
| DDO99 | 242 | 228 | 27.11 | 27.11 | 27.22 | 5,6 | ||||
| E379-07 | 641 | 376 | 28.59 | 28.59 | 28.80 | 6 | ||||
| N3982 | UMa | 1109 | 1515 | 31.87 | 32.02 | 31.94 | 31.93 | |||
| N4038 | 1642 | 1435 | 30.46 | 30.46 | 30.55 | 22 | ||||
| N4068 | 210 | 282 | 28.17 | 28.17 | 28.17 | 3 | ||||
| N4144 | 265 | 294 | 29.32 | 29.32 | 29.33 | 4,12 | ||||
| N4163 | 165 | 132 | 27.35 | 27.35 | 27.46 | 3,5 | ||||
| E321-14 | 610 | 335 | 27.52 | 27.52 | 27.86 | 6,8 | ||||
| U7242 | N4236 | 68 | 243 | 28.67 | 28.67 | 28.61 | 3 | |||
| DDO113 | 284 | 253 | 27.40 | 27.40 | 27.51 | 5,6 | ||||
| N4214 | 291 | 262 | 27.34 | 27.34 | 27.45 | 5,6 | ||||
| U7298 | CVn | 173 | 243 | 28.12 | 28.12 | 28.12 | 6 | |||
| N4236 | N4236 | 0 | 187 | 28.24 | 28.24 | 28.16 | 6 | |||
| N4244 | CVn | 244 | 212 | 28.09 | 28.09 | 28.16 | 4,9,12 | |||
| I3104 | 429 | 191 | 26.80 | 26.80 | 27.18 | 6,8 | ||||
| N4258 | 448 | 488 | 29.32 | 29.50 | 29.41 | 29.42 | 9,11 | |||
| I0779 | 222 | 7 | 30.32 | 30.32 | 30.36 | 3 | ||||
| N4321 | Vir A | 1571 | 1152 | 31.18 | 31.18 | 31.22 | ||||
| N4395 | CVn | 319 | 258 | 28.32 | 28.02 | 28.17 | 28.25 | 6 | ||
| N4414 | 716 | 983 | 31.65 | 31.28 | 31.46 | 31.48 | ||||
| N4419 | Vir A | -261 | 1152 | 31.15 | 31.15 | 31.19 | ||||
| DDO126 | CVn | 218 | 176 | 28.44 | 28.44 | 28.50 | 6 | |||
| DDO125 | 195 | 215 | 27.11 | 27.11 | 27.19 | 5,6 | ||||
| N4449 | CVn | 207 | 221 | 28.12 | 28.12 | 28.16 | 6 | |||
| U7605 | CVn | 310 | 263 | 28.23 | 28.23 | 28.30 | 6 | |||
| N4496A | Vir W | 1730 | 1075 | 31.18 | 30.77 | 30.97 | 31.02 | |||
| N4501 | Vir A | 2281 | 1152 | (30.84) | ||||||
| N4526 | Vir B | 448 | 1152 | 31.30 | 31.30 | 31.34 | ||||
| N4527 | Vir W | 1736 | 1204 | 30.76 | 30.76 | 30.82 | ||||
| N4535 | Vir B | 1961 | 1152 | 31.25 | 31.25 | 31.29 | ||||
| N4536 | Vir W | 1808 | 1424 | 31.24 | 31.28 | 31.26 | 31.31 | |||
| N4548 | Vir A | 486 | 1152 | 30.99 | 30.99 | 31.03 | ||||
| Arp211 | 458 | 419 | 29.13 | 29.13 | 29.17 | 6 | ||||
| N4605 | 143 | 292 | 28.72 | 28.72 | 28.68 | 2 | ||||
| N4631 | 606 | 501 | 29.42 | 29.42 | 29.47 | 4 | ||||
| I3687 | CVn | 354 | 330 | 28.30 | 28.30 | 28.36 | 6 | |||
| N4639 | Vir A | 1018 | 1152 | 32.20 | 32.05 | 32.12 | 32.15 | |||
| E381-18 | 624 | 371 | 28.55 | 28.55 | 28.77 | 8,20 | ||||
| E381-20 | 589 | 338 | 28.68 | 28.68 | 28.88 | 20 | ||||
| HI J1247-77 | 413 | 181 | 27.50 | 27.50 | 27.79 | 3 | ||||
| KK166 | CVn | 28.38 | 28.38 | 28.45 | 6 | |||||
| N4725 | 1206 | 904 | 30.65 | 30.65 | 30.69 | |||||
| N4736 | CVn | 308 | 306 | 28.34 | 28.34 | 28.39 | 6 | |||
| N4753 | 1239 | 1310 | 31.41 | 31.41 | 31.46 | |||||
| E443-09 | 645 | 397 | 28.88 | 28.88 | 29.06 | 20 | ||||
| DDO155 | 214 | 88 | 26.63 | 26.63 | 26.96 | 5,6 | ||||
| E269-37 | CenA | 27.71 | 27.71 | 28.02 | 6 | |||||
| KK182 | 617 | 381 | 28.81 | 28.81 | 29.00 | 20 | ||||
| N4945 | CenA | 563 | 300 | 27.25 | 27.25 | 27.63 | 9 | |||
| I4182 | CVn | 321 | 301 | 28.19 | 28.21 | 28.45 | 28.28 | 28.34 | 2 | |
| DDO165 | 31 | 216 | 28.30 | 28.30 | 28.23 | 6 | ||||
| U8215 | N4236 | 218 | 264 | 28.29 | 28.29 | 28.31 | 3 | |||
| E269-58 | CenA | 400 | 148 | 27.90 | 27.90 | 28.19 | 20 | |||
| N5023 | 407 | 433 | 29.02 | 29.02 | 29.04 | 4,23 | ||||
| KK189 | CenA | 28.23 | 28.23 | 28.48 | 20 | |||||
| E269-66 | CenA | 784 | 533 | 27.91 | 27.91 | 28.20 | 20 | |||
| DDO167 | CVn | 163 | 208 | 28.11 | 28.11 | 28.14 | 6 | |||
| DDO168 | CVn | 192 | 235 | 28.18 | 28.18 | 28.21 | 6 | |||
| KK195 | M83 | 571 | 334 | 28.59 | 28.59 | 28.80 | 6 | |||
| KK196 | CenA | 741 | 495 | 28.00 | 28.00 | 28.27 | 20 | |||
| N5102 | CenA | 468 | 218 | 27.66 | 27.66 | 27.98 | 6 | |||
| KK197 | CenA | 27.94 | 27.94 | 28.22 | 20 | |||||
| KKs55 | CenA | 27.98 | 27.98 | 28.26 | 20 | |||||
| KK200 | M83 | 487 | 248 | 28.33 | 28.33 | 28.56 | 6 | |||
| N5128 | CenA | 547 | 298 | 27.89 | 27.67 | 27.78 | 28.08 | 6,24 | ||
| I4247 | M83 | 274 | 38 | 28.48 | 28.48 | 28.70 | 20 | |||
| E324-24 | CenA | 516 | 270 | 27.86 | 27.86 | 28.15 | 6 | |||
| CVn dSph | LG | 36 | 46 | 21.83 | 21.83 | 24.03 | 25 | |||
| N5204 | CVn | 201 | 336 | 28.34 | 28.34 | 28.31 | 6 | |||
| U8508 | 62 | 169 | 27.10 | 27.10 | 27.09 | 5,6 | ||||
| N5206 | CenA | 571 | 325 | 27.70 | 27.70 | 28.01 | 20 | |||
| E444-78 | M83 | 573 | 346 | 28.60 | 28.60 | 28.81 | 20 | |||
| KK208 | M83 | 381 | 150 | 28.35 | 28.35 | 28.58 | 6 | |||
| DE J1337-33 | M83 | 591 | 358 | 28.27 | 28.27 | 28.51 | 6 | |||
| N5236 | M83 | 513 | 283 | 28.56 | 28.32 | 28.44 | 28.66 | 20 | ||
| E444-084 | CenA | 587 | 357 | 28.32 | 28.32 | 28.55 | 6 | |||
| HI J1337-39 | 492 | 262 | 28.45 | 28.45 | 28.67 | 6 | ||||
| N5237 | CenA | 361 | 116 | 27.66 | 27.66 | 27.98 | 20 | |||
| U8638 | 274 | 198 | 28.15 | 28.15 | 28.27 | 3 | ||||
| DDO181 | 202 | 231 | 27.40 | 27.40 | 27.48 | 5,6 | ||||
| N5253 | CenA | 407 | 172 | 27.89 | 28.05 | 27.95 | 27.96 | 28.23 | 17 | |
| I4316 | M83 | 674 | 444 | 28.22 | 28.22 | 28.46 | 6 | |||
| N5264 | M83 | 478 | 249 | 28.28 | 28.28 | 28.52 | 6 | |||
| KKs57 | CenA | 27.97 | 27.97 | 28.25 | 20 | |||||
| KK211 | CenA | 27.77 | 27.77 | 28.07 | 6 | |||||
| KK213 | CenA | 27.80 | 27.80 | 28.10 | 6 | |||||
| E325-11 | CenA | 545 | 304 | 27.66 | 27.66 | 27.97 | 6 | |||
| KK217 | CenA | 27.92 | 27.92 | 28.20 | 6 | |||||
| CenN | CenA | 27.88 | 27.88 | 28.16 | 20 | |||||
| KK221 | CenA | 28.00 | 28.00 | 28.27 | 6 | |||||
| HI 1348-37 | 581 | 367 | 28.80 | 28.80 | 28.99 | 20 | ||||
| E383-87 | CenA | 326 | 91 | 27.69 | 27.69 | 28.00 | 20 | |||
| DDO183 | 192 | 211 | 27.55 | 27.55 | 27.63 | 5 | ||||
| HI 1351-47 | 529 | 317 | 28.79 | 28.79 | 28.98 | 20 | ||||
| KKH86 | 287 | 148 | 27.08 | 27.08 | 27.38 | 5,6 | ||||
| U8833 | CVn | 227 | 236 | 27.52 | 27.52 | 27.62 | 5,6 | |||
| E384-016 | CenA | 561 | 340 | 28.28 | 28.28 | 28.52 | 20 | |||
| N5457 | 241 | 387 | 29.39 | 29.17 | 29.28 | 29.27 | 2,17 | |||
| N5408 | 506 | 289 | 28.41 | 28.41 | 28.63 | 6 | ||||
| KK230 | 62 | 82 | 26.54 | 26.54 | 26.71 | 3,5 | ||||
| DDO187 | 153 | 117 | 26.87 | 26.87 | 27.09 | 5,6 | ||||
| SBS1415+437 | 609 | 805 | 30.70 | 30.70 | 30.71 | 26 | ||||
| DDO190 | 150 | 229 | 27.23 | 27.23 | 27.28 | 5,6 | ||||
| P51659 | CenA | 390 | 172 | 27.77 | 27.77 | 28.06 | 6 | |||
| E223-09 | 588 | 423 | 29.06 | 29.06 | 29.22 | 20 | ||||
| UMi | LG | -247 | -57 | 19.29 | 19.51 | 19.40 | 23.56 | 27 | ||
| E274-01 | 522 | 325 | 27.45 | 27.45 | 27.77 | 20 | ||||
| KKR25 | -139 | 44 | 26.50 | 26.50 | 26.42 | 5,6 | ||||
| E137-18 | 605 | 456 | 29.03 | 29.03 | 29.17 | 20 | ||||
| Draco | LG | -292 | -75 | 19.59 | 19.92 | 19.76 | 23.53 | 27 | ||
| I4662 | 302 | 135 | 26.94 | 26.94 | 27.26 | 3 | ||||
| N6503 | 60 | 357 | 28.61 | 28.61 | 28.49 | 6 | ||||
| Sag dSph | LG | 140 | 101 | 17.22 | 16.51 | 16.87 | 23.69 | 6 | ||
| N6789 | -141 | 162 | 27.78 | 27.78 | 27.58 | 6 | ||||
| Sag DIG | LG | -79 | -37 | 25.09 | 25.09 | 25.39 | 6 | |||
| N6822 | LG | -57 | 7 | 23.43 | 23.37 | 23.31 | 23.37 | 24.25 | 17 | |
| E461-36 | 427 | 454 | 29.47 | 29.47 | 29.49 | 3 | ||||
| N6951 | 1424 | 1814 | 31.89 | 31.89 | 31.85 | |||||
| DDO210 | LG | -141 | -36 | 25.01 | 25.01 | 25.05 | 1,6 | |||
| I5052 | 584 | 455 | 28.89 | 28.89 | 28.99 | 4 | ||||
| I5152 | 122 | 63 | 26.52 | 26.52 | 26.68 | 5,6 | ||||
| N7331 | 816 | 1099 | 30.89 | 30.89 | 30.82 | |||||
| Tucana | LG | 130 | -6 | 24.72 | 24.72 | 25.34 | 6 | |||
| I5270 | 1983 | 1914 | 31.90 | 31.90 | 31.89 | |||||
| UA438 | 62 | 89 | 26.74 | 26.74 | 26.67 | 5,6 | ||||
| Cas dSph | LG | -307 | 0 | 24.45 | 24.45 | 22.37 | 1,6 | |||
| Pegasus | LG | -183 | 61 | 24.60 | 24.60 | 23.32 | 1,6 | |||
| UA442 | 267 | 276 | 28.24 | 28.24 | 28.18 | 6,8 | ||||
| KKH98 | -137 | 162 | 26.95 | 26.95 | 26.43 | 6 | ||||
| And VI | M31 | -354 | -103 | 24.59 | 24.48 | 24.53 | 22.71 | 1,10 | ||
| N7793 | 227 | 234 | 27.96 | 27.96 | 27.90 | 6 | ||||
| References — (1) McConnachie et al. 2005 (2) Rizzi et al. 2007b (3) Karachentsev et al. 2006 (4) Seth et al. 2005 (5) Tully et al. 2006 (6) Karachentsev et al. 2004 (7) Sakai et al. 1999 (8) Tikhonov 2006 (9) Mouhcine et al. 2005 (10) Armandroff et al. 1999 (11) Macri et al. 2006 (12) Tikhonov & Galazutdinova 2005 (13) Rizzi et al. 2007a (14) Alonso-García et al. 2006 (15) Aloisi et al. 2007 (16) Karachentsev & Kashibadze 2006 (17) Sakai et al. 2004 (18) Sakai et al. 1997 (19) Karachentsev et al. 2002 (20) Karachentsev et al. 2007 (21) Bellazzini et al. 2005 (22) Saviane et al. 2004 (23) Tikhonov et al. 2006 (24) Rejkuba et al. 2005; Karataeva et al. 2006; (25) Zucker et al. 2006 (26) Aloisi et al. 2005 (27) Bellazzini et al. 2002 | ||||||||||

2.3 The Hubble diagram of Cepheid distances
The 37 Cepheid distances in Table LABEL:tab:dist are plotted in a Hubble diagram in Fig. 1b. A linear regression, omitting seven galaxies with and the deviating case of NGC 3627, gives a free orthogonal fit for the slope of in excellent agreement with linear expansion.
The dispersion about the Hubble line is small at . Subtracting in quadrature for random errors of the Cepheid moduli leaves a contribution of for the peculiar velocities.
2.4 The Hubble diagram of SNe Ia
22 SNe Ia distances are listed in Table LABEL:tab:dist. Omitting SN 1937C in IC 4182, which has , and the deviating SN 1989B in NGC 3627 yields an orthogonal fit for the Hubble line with slope , giving additional support for the nearly perfect linear expansion with slope (Fig. 1c). The dispersion is in , , and .
In addition there are 62 SNe Ia with (Fig. 15 in Reindl et al., 2005) whose magnitudes are uniformly reduced as in the case of the nearer SNe Ia. They give an orthogonal slope of which is significantly smaller than 0.2, but it is almost exactly the value predicted for a linearly expanding flat Universe with (Carroll et al., 1992).
The scatter about the Hubble line in , , and beyond is only after absorption corrections and normalization to a fiducial decline rate; in dust-poor S0 and E galaxies it is even smaller. The small scatter is a confirmation that properly reduced SNe Ia yield distance moduli to within as claimed above. Differently treated SNe Ia by Wang et al. (2006) lead essentially to the same results.
Wood-Vasey et al. (2007) have constructed a Hubble diagram from the near-infrared magnitudes, which are less affected by absorption, of 32 SNe Ia in the distance range . Again the slope is as close to 0.2 as can be measured. The scatter amounts to only even without normalization to a fixed decline rate or light curve width.
Jha et al. (2007) have presented a Hubble diagram with a dispersion of for 95 SNe Ia with . At low redshifts its asymptotic slope is very close to and fits at higher redshifts the slope corresponding to , . Yet the authors, reviving similar suggestions by Tammann (1998) and Zehavi et al. (1998), propose a break of the Hubble line of SNe Ia at , implying a decrease of at larger distances by , but the effect is not seen in the aforementioned studies.
There are other relative distance indicators which confirm the linearity of the expansion field. They are not on a uniform zero point, but strengthen the conclusion of linearity or are at least in agreement with it. The difficulty is in general the large intrinsic scatter which prohibits a stringent test. A way out is to use mean cluster distances from a subset of cluster members. Examples of relative cluster distances reaching out to are in Dressler (1987), Lynden-Bell et al. (1988), and Jerjen & Tammann (1993). The mean distances of 10 clusters with about 20 distances each are given by Jørgensen et al. (1996, see also , Fig. 7). Hudson et al. (2004) have derived relative distances of 56 Abell clusters within from an inverse fit to the fundamental plane relation (FP); they find local streaming motions, but their overall expansion is linear in close approximation.
Also the mean distances of 31 clusters with about 15 21cm line width (TF) distances each (Masters et al., 2006) define a Hubble line for with a dispersion of . The latter sample illustrates the inherent problem to select a fair subset of cluster members independent of distance: their three nearest clusters fall systematically off the Hubble line (TSR 08, Fig. 8), whose slope is otherwise almost precisely 0.2.
2.5 Characteristics of the expansion field
The evidence from relative TRGB, Cepheid, and SNe Ia distances in Sect. 2.2-2.4 strongly confines the all-sky-averaged deviations from linear expansion and shows that a single value of applies for all practical purposes from or even , at which distance the cosmic value of must be reached for all classical models. Moreover, the dispersion about the Hubble line is in some cases significantly larger than the observational error of the distance indicators. In these cases it is possible to give meaningful estimates of the random motion of field galaxies. The results are laid out in Table 1. In Col. 1 the distance range (in Mpc nearby and in for the more distant galaxies) is given for a particular distance indicator in Col. 2 with the number of galaxies involved in Col. 3. The free-fit slope of the Hubble line for versus (or ) is in Col. 4. The slopes for the inverse and orthogonal regressions are in Cols. 5 and 6, respectively. The median velocity of the sample follows in Col. 7. The observed magnitude dispersion is shown in Col. 8 for the case of a fixed slope of 0.2. The dispersion is reduced in quadrature for the mean observational error of the distance determination, which is assumed to be for the distance indicators used. The remaining scatter must be due to peculiar velocities. Multiplying the magnitude scatter by 0.2 leads to the scatter in and hence to shown in Col. 9. The product of the latter and the corresponding median velocity yields an estimate of the mean peculiar velocity (Col. 10) at the distance of the median velocity. Finally the intercept for the case of a forced slope of 0.2 in Col. 11 and the value of in Col. 12 will be discussed in Sect. 3.
| distance | slope | slope | slope | ||||||||
|---|---|---|---|---|---|---|---|---|---|---|---|
| range | indicator | n | direct | inverse | orthogonal | median | (0.2 fixed) | ||||
| (1) | (2) | (3) | (4) | (5) | (6) | (7) | (8) | (9) | (10) | (11) | (12) |
| 3.9-4.4 Mpc | TRGB | 20 | 282 | (0.74) | (0.41) | (114) | |||||
| Mpc | TRGB | 78 | 371 | 0.47 | 0.24 | 90 | |||||
| 260-1550 | Cep | 29 | 904 | 0.30 | 0.15 | 130 | |||||
| 310-2000 | SNe Ia | 20 | 1575 | 0.40 | 0.20 | 320 | |||||
| 2000-10,000 | TF clusters | 28 | 5089 | ||||||||
| 3000-20,000 | SNe Ia | 62 | 7720 | ||||||||
| same with | |||||||||||
| based upon mean of , , and magnitudes | |||||||||||
The main result from Table 2 is the mean weighted slope of the Hubble lines in Col. 6 from different distance indicators. It amounts to . This is impressively close to the case of linear expansion with slope 0.2. It is stressed again that the value of is therefore the same everywhere in the free expansion field. can hence be determined at any distance where the most suitable distance indicators are available. “Suitable” means in this context high quality and a sufficient quantity to reduce the random error caused by peculiar motions. The influence of the latter is of course larger at small distances requiring in that case a larger number of good distances.
The values in Col. 10 of Table 2 hold for field galaxies, but also include galaxies in groups because their velocity dispersion is not significantly different. The few cluster galaxies are entered with the mean cluster velocity. Even if the tabulated peculiar velocities carry statistical errors of the order of there is no doubt that they increase with distance. While the individual distances of 100 field and group galaxies from the Hubble line give a mean value of within Mpc, increases to at a distance of (14.4 Mpc). At still larger distances the contribution of the peculiar velocities is of the same size as the distance errors and only upper limits can be set for . The upper limit of at a median velocity of seems realistic if it is compared with the three-dimensional velocity of (after subtraction of the Virgocentric infall vector) of the entire Virgo complex comprising a volume out to with respect to the CMB (Sandage & Tammann, 1985).
3 The zero-point calibration of TRGB, Cepheid, and SNe Ia distances
In the previous section it was shown that the variation of the all-sky value of with distance is unmeasurably small. For this demonstration only relative distances were needed, yet for purely practical purposes zero-pointed TRGB, Cepheid, and SNe Ia distances were used. Their zero-point calibration follows now here.
3.1 The zero-point calibration of the TRGB
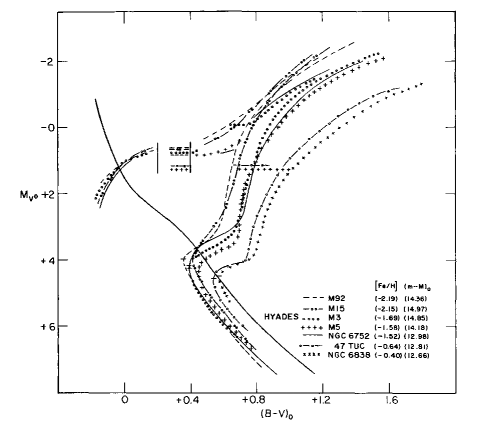
When Baade (1944a, b), using red-sensitive plates, pushed to resolve the brightest stars in population II galaxies such as M 32, NGC 205, NGC 147, and NGC 185 he noticed that resolution occurs abruptly upon reaching a fixed apparent magnitude. He explained the sudden onset of resolution, later coined “Baade’s sheet”, as the top of globular cluster like red-giant branches having approximately constant luminosity. On modern plates the occurrence of Baade’s sheet is striking (see e.g. Sandage & Bedke, 1994, Panels 14, 15, 16, and 25). The fixed luminosity of the brightest metal-poor giants was theoretically explained by Rood (1972) and Sweigart & Gross (1978) by their degenerate cores which make the helium flash independent of mass, and it was observationally confirmed when improved RR Lyrae distances of globular clusters allowed an alignment of their CMDs (Fig. 2). From early beginnings as a distance indicator (Sandage, 1971) Baade’s sheet – now named tip of the red-giant branch (TRGB) – has become by now the most powerful and most easily to use tool to determine distances out to Mpc of galaxies containing an old population. The development is marked by important papers by Da Costa & Armandroff (1990), who introduced magnitudes for the TRGB, Lee et al. (1993), Salaris & Cassisi (1997), and Sakai et al. (2004).
The absolute magnitude of the TRGB was calibrated in TSR 08 using 24 galaxies for which RR Lyrae distances and apparent magnitudes are available. The latter were compiled from the literature and averaged where necessary. The RR Lyrae distances are taken from Table 1 of TSR 08, where also the original sources are referenced. The calibration for evolved RR Lyr stars is taken from Sandage & Tammann (2006, Eq. (8)). The resulting TRGB luminosity is (omitting Sag dSph and the Phoenix dwarf with less reliable observations)
| (5) |
for an old population with average metallicity [Fe/H] in the system of Zinn & West (1984). The systematic error is entirely determined by the RR Lyrae stars; it is estimated to be . It is stressed that the calibration is independent of any Cepheid distances.
The calibration in Eq. (5) agrees to better than with other results (e.g. Bergbusch & VandenBerg, 2001; Sakai et al., 2004; Bellazzini et al., 2004; Rejkuba et al., 2005). Rizzi et al. (2007b) have fitted the Horizontal Branch (HB) of five galaxies to the metal-dependent HB of Carretta et al. (2000) whose zero point rests on trigonometric parallaxes. Their result is identical to Eq. (5) for the same average metallicity.
Model calculations show that the tip luminosity depends on metallicity (Salaris & Cassisi, 1998; Bellazzini et al., 2004; Rizzi et al., 2007b). The sign of the change is not clear, however the authors agree that it is not more than over the range of ; only for still higher metallicities the tip magnitude is significantly fainter. The observational evidence fits into these results (see Fig. 1 of TSR 08). The compromise here is to adopt Eq. (5) throughout, independent of metallicity. The resulting error is certainly for red giants in the quoted metallicity range. For many galaxies the tip metallicity (or color) is not known; the few cases which fall possibly outside this wide metallicity range are statistically negligible.
For 240 galaxies with magnitudes of the TRGB in the literature distance moduli (corrected for Galactic absorption) out to Mpc are given in Table LABEL:tab:dist Col. 6, on the uniform basis of Eq. (5). The original sources are listed in Col. 11.
3.2 The P-L relation of Cepheids and their zero point
Since Leavitt’s (1908, ) discovery of the period-luminosity (P-L) relation of Cepheids it was assumed that the P-L relation of classical Cepheids is universal. Hence calibrated P-L relations in different wavelengths were derived (e.g. Kraft, 1961; Sandage & Tammann, 1968; Madore & Freedman, 1991) and indiscriminately applied. The assumption of universality, however, was early on shattered when Gascoigne & Kron (1965) found that the Cepheids in LMC are bluer than those in the Galaxy – which alone precludes universal P-L relations – and moreover when Laney & Stobie (1986) found the LMC Cepheids to be hotter than their Galactic counterparts at given period. More recent data confirm the dissimilarity of metal-rich Galactic Cepheids and metal-poor LMC Cepheids.
Turning first to the Galactic Cepheids, good colors are available for them mainly through the individual reddening corrections of Fernie (1990, ; slightly revised by ). Distances are known of 33 Cepheids in clusters and associations (Feast, 1999). Seven of the cluster distances have recently been confirmed to within by An et al. (2007). All cluster distances rest on an adopted Pleiades modulus of 5.61 which is secure to 0.02.
In addition absolute magnitudes of 36 Galactic Cepheids come from the so-called BBW method (Baade, 1926; Becker, 1940; Wesselink, 1946) of moving atmospheres as improved by Barnes & Evans (1976). In 33 cases the absolute magnitudes rest on radial-velocity measurements (Fouqué et al., 2003; Barnes et al., 2003) and in three cases on interferometric diameter measurements (Kervella et al., 2004, and references therein). The 36 Cepheids and the cluster Cepheids give quite similar slopes of their respective P-L relations and agree at a period of to within . If the two data sets are combined with equal weight they give the following Galactic P-L relations in (Sandage et al., 2004):
| (6) | |||||
| (7) | |||||
| (8) |
They are adopted in the following. They give absolute magnitudes at which are only fainter than from trigonometric HST parallaxes of 10 Cepheids (Benedict et al., 2007) or fainter if some Hipparcos parallaxes are added (van Leeuwen et al., 2007). This excellent agreement does not hold over the entire period interval as discussed below.
In a second step the LMC P-L relations can independently be derived from 680 Cepheids with dereddened , , and magnitudes from Udalski et al. (1999), to which 97 longer-period Cepheids are added from various sources. They cannot be fitted by a single slope, but show a break at . The resulting LMC P-L relations are (Sandage et al., 2004)
| (9) | |||||
| (10) | |||||
| (11) |
The zero point is set here by an adopted LMC modulus of 18.54. The value is the mean of 29 determinations from different authors and methods from 1997 to 2007 as compiled in STS 06 and TSR 08. Lower values in the literature come mostly from the unjustified assumption that Galactic and LMC Cepheids are directly comparable. – The break at withstands several statistical tests (Ngeow et al., 2005; Kanbur et al., 2007; Koen & Siluyele, 2007), besides being well visible by eye. Also the pulsation models of Marconi et al. (2005) show the break for the metallicity of LMC; it is, however, absent for the higher metallicity of the Galaxy.
It is suggestive that the difference of the P-C and P-L relations in the Galaxy and LMC is caused, at least in part, by the different metallicity of the two galaxies. This leads to the following procedure to derive Cepheid distances of galaxies with intermediate metallicities. Two distances are derived for a given galaxy, one from the Galactic and one from the LMC P-L relation. Noting that Galactic Cepheids have [O/H] and LMC Cepheids [O/H] – in the [O/H]Te scale of Kennicutt et al. (2003) and Sakai et al. (2004) – the two distances are then interpolated and slightly extrapolated according to the metallicity of the galaxy under study (STT 06). The resulting Cepheid distances show no significant metallicity effect if compared with TRGB, SNe Ia, and velocity distances (TSR 08). There are indications that eventually other parameters like He-abundance (Marconi et al., 2005) must be involved to explain all differences of the P-L relations.
The determination of Cepheid distances is complicated by the necessity to deredden external Cepheids. This requires P-L relations in at least two colors, which implies that an assumption on the intrinsic color (P-C relation) must be made. Most Cepheids outside the Local Group were observed with HST in and magnitudes. For distances derived from the LMC P-L relation in the P-C relation must consistently be applied to derive . Distances derived from the Galactic P-L relation must correspondingly be dereddened with the Galactic P-C relation. Since Galactic Cepheids are redder in than LMC Cepheids of the same period, the reddening and the absorption corrections of a Galactic Cepheid is therefore smaller than of an LMC Cepheid of the same observed color and period.
The smaller absorption correction of the red, metal-rich Galactic Cepheids is partially offset by the overluminosity of the blue, metal-poor LMC Cepheids. As Eqs. (6)–(11) show LMC Cepheids with are brighter in , , and than Galactic Cepheids by , , and . The difference decreases with increasing period and changes sign at about (depending on wavelength).
| Galaxy | LMC | ||||||||
|---|---|---|---|---|---|---|---|---|---|
| “” | “” | “” | |||||||
| (1) | (2) | (3) | (4) | (5) | (6) | (7) | (8) | (9) | (10) |
| 5 | 0.70 | -3.07 | 0.676 | -3.49 | 0.613 | 0.063 | 0.21 | -3.28 | 0.21 |
| 10 | 1.00 | -4.00 | 0.753 | -4.25 | 0.678 | 0.075 | 0.25 | -4.00 | 0.00 |
| 15 | 1.18 | -4.56 | 0.799 | -4.66 | 0.752 | 0.047 | 0.15 | -4.51 | 0.05 |
| 20 | 1.30 | -4.93 | 0.830 | -4.97 | 0.790 | 0.040 | 0.13 | -4.84 | 0.07 |
| 25 | 1.40 | -5.24 | 0.355 | -5.23 | 0.821 | 0.034 | 0.11 | -5.12 | 0.12 |
| 30 | 1.48 | -5.48 | 0.876 | -5.42 | 0.846 | 0.030 | 0.10 | -5.38 | 0.15 |
Table 3 shows the effect on distance if an unreddened Galactic Cepheid with period and Galactic properties is “mistreated” with the and P-L relations of LMC. Cols. 3 and 4 give and for a Galactic Cepheid, Cols. 5 and 6 the same for an LMC Cepheid. If the latter values are applied to a Galactic Cepheid one derives the spurious reddenings and absorptions in Cols. 7 and 8. The absorption diminishes the effective LMC luminosity in Col. 5 to the values in Col. 9. A comparison of Col. 9 with Col. 3 gives then the distance error in the sense . The change of sign of the distance error with period makes that a Cepheid sample with a wide period distribution will be assigned a rather reasonable mean distance. But most Cepheids outside the Local Group have long periods () and, if metal-rich, their distances will be systematically underestimated by , or even more in case of very metal-rich Cepheids with particularly long periods.
The steep P-L relations of the Galaxy are shared by the metal-rich Cepheids of some other galaxies (NGC 3351, NGC 4321, M 31), and there is a general trend for less metal-rich Cepheids to exhibit progressively flatter slopes (TSR 08, Fig.4). This supports the interpretation that metallicity is at least one of the parameters that determines the P-L slope. But the metal-rich Cepheids in an inner field of NGC 4258 (Macri et al., 2006) define a P-L slope as flat as in LMC. It follows from this that still another parameter than metallicity affects the P-L relations. The models of Marconi et al. (2005) identify the He content as a prime candidate.
The difference of the P-L relations in the Galaxy and in LMC cannot be questioned, but the Galactic slope, resting on only 69 open-cluster and BBW calibrators, may still be open to revisions. Gieren et al. (2005) and Fouqué et al. (2007) have in fact proposed less steep slopes by changing in case of the BBW method the period dependence of the projection factor , which converts observed radial velocities into pulsational velocities. Also Benedict et al. (2007) and van Leeuwen et al. (2007) plead for a flatter slope on the basis of a dozen parallax measurements. However, one must then discard the evidence of cluster Cepheids. In any case the assumption of one universal flat, LMC-like P-L relation would leave unexplained the redness of the Galactic Cepheids and the break of the LMC P-L relation at and its absence in the Galaxy.
The absorption-corrected distance moduli of 37 galaxies, adjusted for metallicity as described above, were derived by STT 06 and of four additional galaxies by TSR 08, where also the original sources are given. The Cepheids of three very metal-poor galaxies were tied without further metallicity corrections to those of SMC for which a mean modulus of was adopted from five independent methods (see TSR 08, Table 7). The total of 43 Cepheid distances is compiled in Table LABEL:tab:dist, Col. 7. The 29 galaxies with distances Mpc are shown in a distance-calibrated Hubble diagram (Fig. 1b). The slope of the Hubble line has been discussed in Sect. 3.2 without the necessity of zero-pointed distances. With the calibration now in hand the intercept becomes (Table 2).
The random error of the Cepheid distances will be discussed in Sect. 3.4. For a Cepheid with Galactic metallicity the systematic error of the distance, which depends on cluster Cepheids, BBW distances, and which agrees so well with trigonometric parallaxes, is not more than . For other metallicities the distance error may increase with as shown from a comparison of Cepheid distances with TRGB, SNe Ia, and velocity distances (TSR 08). The dependence is insignificant and will in any case, even for the lowest metallicities, introduce an additional distance error of less than .
3.3 The zero-point calibration of SNe Ia
The luminosity calibration of SNeIa was discussed in detail by STT 06 and is not repeated here. For 10 normal SNe Ia, corrected for Galactic and internal absorption and homogenized to a common decline rate and color, Cepheid distances are available. They yield the following absolute magnitudes at maximum (STS 06):
| (12) |
They are brighter by than adopted by Freedman et al. (2001) and by than derived from only four calibrators by Riess et al. (2005). A strict comparison of these values is not possible because the magnitudes are reduced to standard decline rates and colors, but the fainter values are based on a version of the P-L relation adopted for the metal-poor LMC Cepheids, although most of the calibrators are metal-rich. Since most of the relevant Cepheids have also long periods the difference in metallicity is important (cf. Table 3).
A first attempt to independently calibrate SNe Ia through the TRGB rests so far on only two galaxies with their own TRGB distances and on two more galaxies in the Leo I group, for which a mean TRGB distance can be used. The quite preliminary result is (TSR 08) which is in statistical agreement with Eq. (12). As more TRGB distances to SNe Ia will become available the method will become highly competitive.
If Eq. (12) is combined with the consistently reduced apparent magnitudes in , , and of 98 normal SNe Ia from Reindl et al. (2005) one obtains their true distance moduli. The sample has been divided into two subsets. The one comprises the 22 SNe Ia with already discussed in Sect. 2.4. They define the distance-calibrated Hubble diagram in Fig. 1c and an intercept of which is shown in Table 2. The more distant subset contains the 62 SNeIa with . They yield an intercept of after allowance for . (For a flat Universe with , , the intercept becomes , cf. Table 2).
The intercept of the Hubble line cannot be compared with the one obtained by Jha et al. (2007), because the apparent SN Ia magnitudes were normalized in a different way and reduced to different standard parameters than in Reindl et al. (2005). The same holds for the work of Wang et al. (2006). They obtain from 73 SNe Ia a Hubble diagram with a dispersion of only in and derive a value of (statistical error) using low Cepheid distances for their calibrating SNe Ia. However, if the Cepheid distances in Table LABEL:tab:dist are used for their calibrators one finds . The 5% difference from our preferred value reflects the uncertainties caused by the dereddening and normalization of the observed SN Ia magnitudes.
The intercepts obtained from the zero-point calibration of the TRGB, Cepheid, and SN Ia distances are collected in Table 2, Col. 11.
3.4 Comparison of different distance determinations
3.4.1 Comparison of individual galaxies
The internal accuracy of the TRGB and Cepheid distances in Table LABEL:tab:dist can be determined by comparison with RR Lyrae distances and by intercomparison (Table 4).
| N | |||
|---|---|---|---|
| 20 | 0.08 | ||
| 17 | 0.13 |
The zero difference of the TRGB and RR Lyr distances is no surprise because the latter have served as calibrators. More remarkable is the small dispersion which implies that the random error of either distance indicator is certainly less than . A generous error of has been adopted above. Still more remarkable is in view of the independent zero points the barely significant difference of between the Cepheid and TRGB distances, the former being smaller. The difference is neglected because it is not seen in the intercepts (Table 2), which involve a larger number of galaxies. The dispersion of between the two distance indicators sets again an upper limit of say for the random error of the Cepheid distances. Also the SN Ia distances carry a random error of not more than as seen from the dispersion of the Hubble diagram of the distant SNe Ia.
There is only a limited number of galaxies with independent distances of comparable accuracy and with presumably small systematic errors. One case is NGC 4258 for which Herrnstein et al. (1999) have determined a modulus of from the Keplerian motion of water maser sources about the galaxy center; the value is in statistical agreement with from the mean of the TRGB and Cepheid distance. Ribas et al. (2005) have derived the distance of NGC 224 (M 31) from an eclipsing binary to be in perfect agreement with the mean RR Lyr, TRGB, and Cepheid distance. The eclipsing binary distance of NGC 598 (M 33) of by Bonanos et al. (2006) is only marginally larger than the mean of from the RR Lyr stars, the TRGB, and the Cepheids. Interesting are also the four Cepheid distances that involve near-infrared magnitudes in and , which are believed to be less susceptible to metallicity effects and which are tied to the , P-L relation of LMC by Persson et al. (2004). The distances of NGC 300 (Rizzi et al., 2006), NGC 3109 (Soszyński et al., 2006), NGC 6822 (Gieren et al., 2006), and IC 1613 (Pietrzyński et al., 2006) differ on average from the independent distances in Table LABEL:tab:dist by only if is adopted.
From this it seems that the distances in Table LABEL:tab:dist form a homogeneous system based on a common zero point. The random distance error is probably for a galaxy with one distance determination and accordingly smaller in cases of two and three determinations. Table LABEL:tab:dist is therefore believed to be the best net of local distances presently available. It comprises a wide range of galaxy types; normal E/S0 galaxies with , however, are painfully missing.
3.4.2 Comparison of the intercept
The most interesting result of the previous Section is the close agreement of the intercepts , as compiled in Table 2, Col. 11, from the Population II (old stars) TRGB distances larger than 4.5 Mpc and from the young-Population I Cepheid distances, because they rest on independent zero points. The difference of (corresponding to ) is as good as could be expected and reflects on the quality of the mutual zero-point calibrations. One could object that the agreement is coincidental because the median distance of the Cepheids is 2.4 times larger than that of the TRGB galaxies, but the invariance of with distance is just what was predicted in Sect. 2 from only the slopes of the different Hubble diagrams.
To include also the weight of the numerous nearby and distant SNe Ia (in the latter case with allowance for ) their -values were averaged with the one from Cepheids to give . The SNe Ia cannot improve the zero point since they are calibrated with a subset of the same Cepheids, but they help to decrease the statistical error and directly lead into the large-scale expansion field. The preferred solution here is the mean of the latter Cepheid-based value of and from the independent TRGB galaxies, i.e. .
From Eq. (4) follows then that
| (13) |
The systematic error here is estimated in the following way. A 10% error could be explained only if 1) varied noticeably with distance which is excluded by the slope of the Hubble line very close to (Sect. 2), or 2) if the adopted zero points of the TRGB and of Cepheids were both changed in the same direction by , which seems impossible. Therefore the systematic error is still rather pessimistically estimated to be 6%. It may be noted that omission of the Virgocentric infall correction would decrease the local value of by units.
4 Additional distance indicators
Too many proposals have been made, how to measure galaxy distances, to do justice to them here. Only a few methods are mentioned which have been used widely and which have provided sufficient distances for statistical tests.
4.1 21cm line widths Tully-Fisher (TF) method
The spectral line width of the 21cm line or of optical lines (see Mathewson et al., 1992a), corrected for inclination , are a measure of the rotation velocity of spirals and hence correlate with galaxy mass and luminosity (Gouguenheim, 1969). The relation has been applied by Tully & Fisher (1977) and many subsequent authors (some of which are quoted in Tammann & Reindl 2006) for the distance determination of spirals. A reliable rotation velocity requires which unfortunately implies large corrections for internal absorption. A Hubble diagram of a complete distance-limited sample of 104 inclined spirals with from Federspiel (1999) gives the Hubble diagram shown in Fig. 3a. The scatter of is very large, too large in fact to define an independent slope of the Hubble line. Even the assumption that peculiar velocities contribute leaves an intrinsic scatter of . This invites in case of flux-limited samples large selection effects and too large values of as well as too small estimates of the intrinsic dispersion. With the zero point from 31 Cepheids (STS 06) one obtains for the distance-limited sample . This result, depending directly on the Cepheid calibrations, is statistically different from the result of the Cepheids themselves, which reveals some of the intricacies of the method.
With the above calibration one obtains from a complete sample of 49 inclined, untruncated Virgo cluster spirals, as compiled by Federspiel et al. (1998), and after a small correction for the color difference between calibrators and cluster galaxies a mean TF distance of , or reduced to the center of the Local Group (STS 06). – Tully & Pierce (2000) have derived for an almost complete sample of 38 inclined spirals of the UMa cluster with , , , and photometry . After recalibrating their 24 calibrators with the present Cepheid distances one obtains . However, the UMa field is complex and may be divided into two groups at slightly different distances giving moduli of for UMa I and for UMa II (Sandage, 2008) – The Fornax cluster with only few inclined spirals does not yield well to the TF method.

4.2 or the fundamental plane (FP)
The correlation of the velocity dispersion of E galaxies with their luminosity was pointed out by Minkowski (1962) and Faber & Jackson (1976). Later the luminosity was replaced by a suitably normalized diameter (Dressler et al., 1987) or by surface brightness (Djorgovski & Davis, 1987). The method was extended to bulges of spiral galaxies by (Dressler, 1987) who derived . Faber et al. (1989) have presented a wealth of measurements from which they have derived relative distances . A subset of 73 of their galaxies brighter than and with constitute not a strictly complete, but apparently a quite fair sample. Their Hubble diagram is shown in Fig. 3b. The data do not allow to determine the slope, but a forced slope of 0.2 is acceptable. The large observed scatter of is about the same as for the TF method. Since no primary calibrators are available for E galaxies a value of is assumed. This leads to the following calibration
| (14) |
If this relation is applied to the 15 Virgo cluster members of the sample one obtains , which is still useful because it is independent of the cluster velocity. The corresponding mean of the 10 E galaxies in the sample, which are members of the Fornax cluster, give .
4.3 Other distance indicators
Surface Brightness Fluctuations (SBF).
Surface brightness fluctuations of E/S0 galaxies as a measure of distance have been introduced by Tonry & Schneider (1988) and have been applied with variable success (references in Tammann & Reindl 2006). One of the difficulties of the method is, as in case of the method, that no primary calibration for E galaxies exists, and S0 galaxies may or may not follow the same relation and may be more susceptible to dust. The 123 SBF distances compiled by Tonry et al. (2001) give a Hubble diagram with somewhat less scatter () than from TF or distances, but the slope is significantly steeper than 0.2. This proves the SBF scale to be compressed with increasing spuriously with distance. The problem could be caused by selection effects, but rather it is inherent to the method. The careful work of Mei et al. (2007) on Virgo cluster ellipticals does not (yet) contribute to the determination of because they assume a mean cluster distance.
Planetary nebulae (PNLF).
Following a proposal of Ford & Jenner (1978) the luminosity function of the shells of planetary nebulae in the light of the [OIII] line has been used as a distance indicator. But the maximum luminosity seems to depend on population size (Bottinelli et al., 1991; Tammann, 1993), chemical composition and age (Méndez et al., 1993; Ciardullo et al., 2002), and dynamics (Sambhus et al., 2005). About 30 galaxies, mainly from Ciardullo et al. (2002), with PNLF distances define a Hubble diagram with large scatter and steep slope implying to increase outwards. At the PNLF distance scale has lost about 0.5 mag as shown by five galaxies (Feldmeier et al., 2007) with known SNe Ia whose resulting mean luminosity of should be compared with Eq. (12).
Luminosity classes (LC).
The luminosity of a spiral galaxy
correlates with the “beauty” of its spiral structure. Correspondingly
spirals were divided into class I (the brightest) to V (the faintest)
by van den Bergh (1960a, b, c)
with additional galaxies classified and modified by
Sandage & Bedke (1994). The purely morphological classification
is independent of distance; it yields therefore relative distances
which were valuable for many years when velocity distances were
suspected to be severely distorted by peculiar and streaming motions,
but the dispersion is large which makes the method susceptible to
bias. Locally calibrated and bias-corrected distances led to values of
near 55 (Sandage & Tammann, 1975b; Sandage, 1999b).
Some methods like the brightest blue stars, used extensively by Hubble, and the size of the largest HII regions (Sérsic, 1959) have lost their former importance as distance indicators. Others show increasing potential like novae which may reach out to the Virgo cluster (Gilmozzi & Della Valle, 2003), but it is difficult to determine an independent zero point for them and they require much telescope time. – The turnover magnitude of the luminosity function of globular clusters (GCLF) was proposed as a standard candle by van den Bergh et al. (1985). The luminosity of the turnover was calibrated using RR Lyr distances in the Galaxy and the Cepheid distance of M 31, to be (Sandage & Tammann, 1995, see also Di Criscienzo et al. 2006). A simple-minded application to two galaxies in the Leo group and eight galaxies in the Virgo cluster gave distances that agree with those adopted here (Table 5 & 6) to within (Tammann & Sandage, 1999). Kavelaars et al. (2000) found from the same method the Coma cluster to be more distant than the Virgo cluster by ; this leads with (from Table 6) to . However, the simple application of the GCLF method is questioned by the bimodal and varying color and luminosity distribution of the GCs in different galaxies (Larsen et al., 2001).
Some “physical” distances do not make use of any known astronomical distance, but are derived from the physics or geometry of an object. Some are mentioned elsewhere in this paper, like BBW distances (Fouqué et al., 2003), eclipsing binaries (Ribas et al. 2005; see also Ribas 2007), the water maser distance of NGC 4258 (Herrnstein et al., 1999), and the luminosities of Cepheids (Marconi et al., 2005). The light echo distance of SN 1987A (Panagia, 2005) has been incorporated into the zero-point distance of LMC. Much work has been devoted to model the luminosities of SNe Ia (for a summary see Branch, 1998). The SN II models of Eastman et al. (1996) give distances which lead to an unrealistic increase of with distance. Models of typeII-P SNe by Nugent et al. (2006) give a mean value of for 19 objects, while Hamuy & Pinto (2002) find for eight objects. Nadyozhin (2003) has derived from a refined model for the same objects , but the result is still quite sensitive to the input parameters (Blinnikov et al., 2005). The list of physical distance determinations could be much extended, but it is a typical problem that their systematic errors are difficult to determine and that they are often restricted to one or a few objects.
Physical methods to determine at large distances have the disadvantage to depend on the cosmological model. Important results will eventually come from the Sunyaev-Zeldovich effect (SZE) of X-ray clusters, but with values of and systematic errors of the results are not yet useful (Udomprasert et al., 2004; Jones et al., 2005; Bonamente et al., 2006). – A powerful method to measure large distances comes from gravitational lensed quasars, however the solution for is sensitive to the mass distribution of the lens, to dark halos and companion galaxies, and even to the large-scale structure in front of the lens and behind. Recent results are (Fassnacht et al., 2006) and (Read et al., 2007) if , is assumed. Auger et al. (2008) can fit the source SBS 1520+530 with if a steep mass profile of the lens is adopted, but an isothermal model gives .
The acoustic fluctuation spectrum of the WMAP3 data is interpreted to give a value of (Spergel et al., 2007), which is also consistent with the red giant galaxy distribution of the Sloan Digital Sky Survey (Tegmark et al., 2006). However, the result is model-dependent, a priori assuming for instance a perfectly flat Universe or a static value of the parameter . A fundamentally different model allows for time dilation effects and gives a proper integration over voids and filaments by introducing density fluctuations into the Einstein equations as they affect , , and the putative, but here illusory acceleration (Wiltshire, 2007a, b). This model gives a best-fit value of (Leith et al., 2008).
5 Distances of groups and clusters
The galaxies in Table LABEL:tab:dist are assigned to different groups in Col. 2. If the distances and velocities within a given group are averaged with equal weight one obtains the values shown in Table 5. In addition the data for the distances of the UMa, Virgo, and Fornax clusters are compiled in Table 6 where also the evidence from the TF and method is included. The Hubble diagram of the groups and clusters is shown in Fig. 4. A free fit of the Hubble line, including objects as close as Mpc (!), gives a slope of . A forced fit with slope 0.2 gives or, excluding the deviating cases of the IC 342 and NGC 2403 groups, . The average deviation from the Hubble line is only without a clear trend to depend on distance. Local groups and clusters follow hence, after allowance for a Virgocentric flow model, a quiet Hubble flow.
The 72 galaxies of Table LABEL:tab:dist with , which are not assigned to a group or cluster, have about the same dispersion about the Hubble line as the groups and clusters. They give .
The distance of the Coma cluster can be estimated from its relative distance to the Virgo cluster. The difference is 3.74 from the method (Faber et al., 1989) and 4.06 from globular clusters (Kavelaars et al., 2000). Adding the mean to the Virgo modulus in Table 6 gives . The cosmic recession velocity of the Coma cluster, freed of all non Hubble velocities, can be inferred from distances relative to Coma of nine distant clusters (Jørgensen et al., 1996) to be (Tammann & Reindl, 2006, Fig. 7), from which follows .
| Group | N | |||
|---|---|---|---|---|
| (1) | (2) | (3) | (4) | (5) |
| M 31 | 15 | -21 | 24.39 | 21.73 |
| Scl1 | 4 | 123 | 26.52 | 26.50 |
| M 81 | 23 | 200 | 27.87 | 27.76 |
| NGC 4236 | 2 | 254 | 28.48 | 28.46 |
| CVn | 21 | 259 | 28.17 | 28.21 |
| Scl2 | 6 | 271 | 27.81 | 27.68 |
| M 83 | 10 | 272 | 28.40 | 28.63 |
| CenA | 28 | 276 | 27.87 | 28.16 |
| IC 342 | 7 | 289 | 27.58 | 27.30 |
| NGC 2403 | 7 | 308 | 27.60 | 27.43 |
| Leo I | 7 | 613 | 30.34 | 30.39 |
| UMa | Virgo | Fornax | |
| TRGB | |||
| Cepheids | |||
| SNe Ia | |||
| TF | |||
| adopted (weighted) | |||
| distance (Mpc) | |||
| 1) TSR 08 from data of Durrell et al. (2007) and Caldwell (2006) | |||
| 2) individually listed in STS 06 | |||

6 Conclusions
An intercomparison of RR Lyr, TRGB, and Cepheid distances shows that their dispersion is not more than . The same upper limit holds for SNe Ia as seen from the small scatter in their Hubble diagram at large distances. The four distance indicators stand out because they can provide the most accurate distances within their reach for sizable samples of galaxies and, importantly, their small dispersion makes them highly insensitive to selection bias. Although their reach is drastically different, RR Lyr stars being very short-range, SNe Ia extending to cosmological distances, and the TRGB and Cepheid distances lying in between, there is enough overlap to tie them into a single system of distances.
The combined Hubble diagram of TRGB, Cepheid, and SNe Ia distances shows a well defined Hubble line with slope 0.2, corresponding to linear expansion, over a range of to at least . The slope of 0.2, strongly supported also by other evidence (see Sect. 2) implies that the present mean value of the Hubble constant is everywhere the same (cosmological effects being exempt by definition). Most of the observed dispersion about the Hubble line must be caused by random peculiar motions; allowing for the (small) distance errors they are within Mpc and increase outwards to a yet undetermined limit (see Table 2, Col. 10). Lower values are in the literature, but the value here seems well determined from 78 TRGB distances (Table 2).
The zero point of the Hubble line is set in two independent ways. a) The absolute magnitude of the TRGB is determined by 22 RR Lyr star distances and agrees well with other determinations. The adopted magnitude of carries a systematic error of hardly more than . The value holds for [Fe/H] and changes by less than in the range typical for old populations (TSR 08, Fig. 1). The resulting value of from 78 distances larger than Mpc refers to an effective distance of only where the influence of peculiar velocities is still large, but this is compensated by the large number of TRGB distances. b) Because the P-L relations of the metal-rich Galactic Cepheids and of the metal-poor LMC Cepheids are different they are independently calibrated. The zero point of the Galactic P-L relation rests on Cepheids in Galactic clusters and on physical BBW distances. The zero point of a 10-day Cepheid is confirmed by trigonometric parallaxes to within a few , but the error can increase to for Cepheids with the shortest and longest periods depending on the correctness of the adopted P-L slope. The LMC P-L relation with very well determined slope is zero-pointed by an adopted distance of . This value is based on a multitude of determinations, excluding of course results depending on the P-L relations of Cepheids themselves; the error is again estimated to be . It should be noted that significantly smaller LMC distances come mostly from some a priory assumption on the shape and zero point of the P-L relations of the Galaxy and LMC. – The Cepheids in other galaxies with metallicities like the Galaxy or LMC are reduced with the corresponding P-L relations; in case of Cepheids with intermediate metallicities the results from the two P-L relations are interpolated. The resulting 29 Cepheid distances larger than Mpc give at an effective distance of . – The good agreement of the value of from the TRGB and Cepheid distances is highly significant because it is predicted from the well supported linearity of the expansion field.
SNe Ia are calibrated through Cepheids and cannot independently contribute to the zero point of the distance scale. But their large number can reduce the statistical error and serve to carry the value of to . They give at an effective distance of and, allowing for a flat Universe with , from 62 SNe Ia at . The adopted value of
| (15) |
is the unweighted mean from the Cepheids and Cepheid-calibrated SNe Ia averaged with the result from the TRGB. The generous 6% systematic error is estimated in Sect. 3.4.2.
The value of rests on the two independent zero points set by the TRGB and Cepheid distances. No other zero-pointed distance indicator is available at present, which could carry the distance scale into the expansion field, i.e. to Mpc, for a sufficient number of 20 or more galaxies. But TF distances of a distance-limited sample of spiral galaxies and distances out to as well the Hubble diagram of nearby groups and clusters provide at least a consistency check. We are not aware of any serious objection against the adopted value of .
The literature abounds in larger values of . Some are based on the untenable view that the LMC P-L relation of Cepheids, whatever its exact shape and zero point, is universal. Others are the result of selection bias, which becomes particularly severe when it is tried to determine at the largest distances which can be reached, and from where necessarily only the most luminous objects of their species can enter the catalogs. The importance of selection bias is often underestimated because the quality of the distance indicators is overestimated. The true quality can be determined only if there is broad overlap with high-accuracy distance indicators like RR Lyr stars or TRGB and Cepheid distances, or by consulting the Hubble diagram. The dispersion here, corrected for the reasonably well understood effect of peculiar velocities, gives the random error for a given distance indicator. Also too steep a slope, i.e. increasing with distance, is a clear sign of important bias or some other systematic problem of the method. Finally other high values of are too model-dependent to be reliable.
Future progress on will come from additional near-infrared photometry of Cepheids where they are relatively insensitive to absorption and metallicity. Enormous potential lies still in the TRGB distances. With a somewhat improved understanding of their metallicity dependence, which is in any case small in old populations, they can provide distances to better than for well over 1000 galaxies of all types within Mpc with present techniques and requiring relatively little telescope time. They will thus map the local velocity field in great detail and also yield a high-weight calibration of SNe Ia extending the impact of the method to cosmological distances.
Acknowledgements.
We thank our many collaborators over the years, particularly Abhijit Saha, for their work with us on . A. S. thanks the Observatories of the Carnegie Institution for post-retirement facilities.References
- Aaronson (1987) Aaronson M (1987) A distance scale from the IR magnitude/HI velocity width relation. In: Observational cosmology. IAU Symp. 124, pp 187–194
- Aloisi et al. (2007) Aloisi A, Clementini G, Tosi M, Annibali F, Contreras R, Fiorentino G, Mack J, Marconi M, Musella I, Saha A, Sirianni M, van der Marel RP (2007) I Zw 18 Revisited with HST ACS and Cepheids: New Distance and Age. ApJ 667:L151–L154
- Aloisi et al. (2005) Aloisi A, van der Marel RP, Mack J, Leitherer C, Sirianni M, Tosi M (2005) Do Young Galaxies Exist in the Local Universe? Red Giant Branch Detection in the Metal-poor Dwarf Galaxy SBS 1415+437. ApJ 631:L45–L48
- Alonso-García et al. (2006) Alonso-García J, Mateo M, Aparicio A (2006) DDO 44 and UGC 4998: Distances, Metallicities, and Star Formation Histories. Publ. Astron. Soc. Pacific 118:580–589
- An et al. (2007) An D, Terndrup DM, Pinsonneault MH (2007) The Distances to Open Clusters from Main-Sequence Fitting. IV. Galactic Cepheids, the LMC, and the Local Distance Scale. ApJ 671:1640–1668
- Armandroff et al. (1999) Armandroff TE, Jacoby GH, Davies JE (1999) A Survey for Low Surface Brightness Galaxies around M31. II. The Newly Discovered Dwarf Andromeda VI. Astron. J. 118:1220–1229
- Auger et al. (2008) Auger MW, Fassnacht CD, Wong KC, Thompson D, Matthews K, Soifer BT (2008) Lens Galaxy Properties of SBS1520+530: Insights from Keck Spectroscopy and AO Imaging. ApJ 673:778–786
- Baade (1926) Baade W (1926) Über eine Möglichkeit, die Pulsationstheorie der Cephei-Veränderlichen zu prüfen. AN 228:359–362
- Baade (1944a) Baade W (1944a) The Resolution of Messier 32, NGC 205, and the Central Region of the Andromeda Nebula. ApJ 100:137–146
- Baade (1944b) Baade W (1944b) NGC 147 and NGC 185, Two New Members of the Local Group of Galaxies. ApJ 100:147–150
- Baade (1954) Baade W (1954) In: Trans. IAU VIII (Rome 1952 meeting), Report of Commission 28. Cambridge, Cambridge Univ. Press, p 387
- Barnes & Evans (1976) Barnes TG, Evans DS (1976) Stellar angular diameters and visual surface brightness - I. Late spectral types. MNRAS 174:489–502
- Barnes et al. (2003) Barnes T, Jeffreys W, Berger J, Mueller P, Orr K, Rodriguez R (2003) A Bayesian Analysis of the Cepheid Distance Scale. ApJ 592:539–554
- Becker (1940) Becker W (1940) Spektralphotometrische Untersuchungen an Cephei-Sternen. IX and X. ZA 19:269–303
- Bellazzini et al. (2002) Bellazzini M, Ferraro FR, Origlia L, Pancino E, Monaco L, Oliva E (2002) The Draco and Ursa Minor Dwarf Spheroidal Galaxies: A Comparative Study. Astron. J. 124:3222–3240
- Bellazzini et al. (2004) Bellazzini M, Ferraro FR, Sollima A, Pancino E, Origlia L (2004) The calibration of the RGB Tip as a Standard Candle. Extension to Near Infrared colors and higher metallicity. A&A 424:199–211
- Bellazzini et al. (2005) Bellazzini M, Gennari N, Ferraro FR (2005) The red giant branch tip and bump of the Leo II dwarf spheroidal galaxy. MNRAS 360:185–193
- Benedict et al. (2007) Benedict GF, McArthur BE, Feast MW, Barnes TG, Harrison TE, Patterson RJ, Menzies JW, Bean JL, Freedman WL (2007) Hubble Space Telescope Fine Guidance Sensor Parallaxes of Galactic Cepheid Variable Stars: Period-Luminosity Relations. Astron. J. 133:1810–1827
- Bergbusch & VandenBerg (2001) Bergbusch PA, VandenBerg DA (2001) Models for Old, Metal-poor Stars with Enhanced a-Element Abundances. III. Isochrones and Isochrone Population Functions. ApJ 556:322–339
- Blinnikov et al. (2005) Blinnikov SI, Baklanov PV, Kozyreva AV, Sorokina EI (2005) Light Curve Models of Supernovae and X-ray Spectra of Supernova Remnants. In: Turatto M, Benetti S, Zampieri L, Shea W (eds) Supernovae as Cosmological Lighthouses. ASP Conf. Ser. 342, pp 382–388
- Bonamente et al. (2006) Bonamente M, Joy MK, LaRoque SJ, Carlstrom JE, Reese ED, Dawson KS (2006) Determination of the Cosmic Distance Scale from Sunyaev-Zel’dovich Effect and Chandra X-Ray Measurements of High-Redshift Galaxy Clusters. ApJ 647:25–54
- Bonanos et al. (2006) Bonanos AZ, Stanek KZ, Kudritzki RP, Macri LM, Sasselov DD, Kaluzny J, Stetson PB, Bersier D, Bresolin F, Matheson T, Mochejska BJ, Przybilla N, Szentgyorgyi AH, Tonry J, Torres G (2006) The First DIRECT Distance Determination to a Detached Eclipsing Binary in M33. ApJ 652:313–322
- Bottinelli et al. (1991) Bottinelli L, Gouguenheim L, Paturel G, Teerikorpi P (1991) A systematic effect in the use of planetary nebulae as standard candles. A&A 252:550–556
- Branch (1998) Branch D (1998) Type Ia Supernovae and the Hubble Constant. ARA&A 36:17–56
- Caldwell (2006) Caldwell N (2006) Color-Magnitude Diagrams of Resolved Stars in Virgo Cluster Dwarf Galaxies. ApJ 651:822–834
- Carretta et al. (2000) Carretta E, Gratton RG, Clementini G, Fusi Peci F (2000) Distances, Ages, and Epoch of Formation of Globular Clusters. ApJ 533:215–235
- Carroll et al. (1992) Carroll SM, Press WH, Turner EL (1992) The cosmological constant. ARA&A 30:499–542
- Da Costa & Armandroff (1990) Da Costa GS, Armandroff TE (1990) Standard globular cluster giant branches in the plane. Astron. J. 100:162–181
- Dale & Giovanelli (2000) Dale DA, Giovanelli R (2000) The Convergence Depth of the Local Peculiar Velocity Field. In: Courteau S, Willick J (eds) Cosmic Flows Workshop. ASP Conf. Ser. 201, p 25
- Davis et al. (1985) Davis M, Efstathiou G, Frenk CS, White SDM (1985) The evolution of large-scale structure in a universe dominated by cold dark matter. ApJ 292:371–394
- Davis & Peebles (1983a) Davis M, Peebles PJE (1983a) Evidence for local anisotropy of the Hubble flow. ARA&A 21:109–130
- Davis & Peebles (1983b) Davis M, Peebles PJE (1983b) A survey of galaxy redshifts. V - The two-point position and velocity correlations. ApJ 267:465–482
- Ciardullo et al. (2002) Ciardullo R, Feldmeier JJ, Jacoby GH, Kuzio de Naray R, Laychak MB, Durrell PR (2002) Planetary Nebulae as Standard Candles. XII. Connecting the Population I and Population II Distance Scales. ApJ 577:31–50
- de Freitas Pacheco (1986) de Freitas Pacheco JA (1986) The relative motion of the local group of galaxies towards the Virgo cluster. Rev. Mex. Astron. Astrof. 12:74
- Dekel (1994) Dekel A (1994) Dynamics of Cosmic Flows. ARA&A 32:371–418
- de Vaucouleurs (1958) de Vaucouleurs G (1958) Further evidence for a local super-cluster of galaxies: rotation and expansion. Astron. J. 63:253–266
- de Vaucouleurs (1976) de Vaucouleurs G (1976) Supergalactic Studies V. The Supergalactic Anisotropy of the Redshift-Magnitude Relation Derived from Nearby Groups and Sc Galaxies. ApJ 205:13–28
- de Vaucouleurs (1977) de Vaucouleurs G (1977) Distances of the Virgo, Fornax and Hydra clusters of galaxies and the local value of the Hubble ratio. Nature 266:126–129
- de Vaucouleurs (1982) de Vaucouleurs G (1982) The extragalactic distance scale and the Hubble constant. Observatory 102:178–194
- de Vaucouleurs & Bollinger (1979) de Vaucouleurs G Bollinger G (1979) The extragalactic distance scale. VII - The velocity-distance relations in different directions and the Hubble ratio within and without the local supercluster. ApJ 233:433–452
- de Vaucouleurs & Peters (1985) de Vaucouleurs G, Peters WL (1985) A preliminary mapping of the extragalactic velocity field near the plane of the local supercluster. ApJ 297:27–36
- Di Criscienzo et al. (2006) Di Criscienzo M, Caputo F, Marconi M, Musella I (2006) RR Lyrae-based calibration of the Globular Cluster Luminosity Function. MNRAS 365:1357–1366
- Djorgovski & Davis (1987) Djorgovski G, Davis M (1987) Fundamental properties of elliptical galaxies. ApJ 313:59–68
- Dressler (1984) Dressler A (1984) Internal kinematics of galaxies in clusters. I - Velocity dispersions for elliptical galaxies in Coma and Virgo. ApJ 281:512–524
- Dressler (1987) Dressler A (1987) The D relation for bulges of disk galaxies - A new, independent measure of the Hubble constant. ApJ 317:1–10
- Dressler et al. (1987) Dressler A, Lynden-Bell D, Burstein D, Davis RL, Faber SM, Terlevich R, Wegner G (1987) Spectroscopy and photometry of elliptical galaxies. I – A new distance estimator. ApJ 313:42–58
- Durrell et al. (2007) Durrell PR, Williams Benjamin F, Ciardullo R, Feldmeier JJ, von Hippel T, Sigurdsso S, Jacoby GH, Ferguson HC, Tanvir NR, Arnaboldi M, Gerhard O, Aguerri JAL, Freeman K, Vinciguerra M (2007) The Resolved Stellar Populations of a Dwarf Spheroidal Galaxy in the Virgo Cluster. ApJ 656:746–755
- Eastman et al. (1996) Eastman RG, Schmidt BP, Kirshner R (1996) The Atmospheres of Type II Supernovae and the Expanding Photosphere Method. ApJ 466:911–937
- Ekholm et al. (2001) Ekholm T, Baryshev Y, Teerikorpi P, Hanski MO, Paturel G (2001) On the quiescence of the Hubble flow in the vicinity of the Local Group. A study using galaxies with distances from the Cepheid PL-relation. A&A 368:L17–L20
- Faber et al. (1989) Faber SM, Wegner G, Burstein D, Davies RL, Dressler A, Lynden-Bell D, Terlevich RJ (1989) Spectroscopy and photometry of elliptical galaxies. VI - Sample selection and data summary. ApJ Suppl. 69:763–808
- Faber & Jackson (1976) Faber SM, Jackson RE (1976) Velocity dispersions and mass-to-light ratios for elliptical galaxies. ApJ 204:668–683
- Fassnacht et al. (2006) Fassnacht CD, Gal RR, Lubin LM, McKean JP, Squires GK, Readhead ACS (2006) Mass along the Line of Sight to the Gravitational Lens B1608+656: Galaxy Groups and Implications for . ApJ 642:30–38
- Feast (1999) Feast MW (1999) Cepheids as Distance Indicators. Publ. Astron. Soc. Pacific 111:775–793
- Federspiel (1999) Federspiel M (1999) Kinematic Parameters of Galaxies as Distance Indicators. Ph. D. Thesis, Univ. of Basel
- Federspiel et al. (1994) Federspiel M, Sandage A, Tammann GA (1994) Bias properties of extragalactic distance indicators. III: Analysis of Tully-Fisher distances for the Mathewson-Ford-Buchhorn sample of 1355 galaxies. ApJ 430:29–52
- Federspiel et al. (1998) Federspiel M, Tammann GA, Sandage A (1998) The Virgo Cluster Distance from 21 Centimeter Line Widths. ApJ 495:115–130
- Feldmeier et al. (2007) Feldmeier JJ, Jacoby GH, Phillips MM (2007) Calibrating Type Ia Supernovae Using the Planetary Nebula Luminosity Function. I. Initial Results. ApJ 657:76–97
- Fernie (1990) Fernie JD (1990) Color Excesses on a Uniform Scale for 328 Cepheids. ApJ Suppl. 72:153–162
- Fernie et al. (1995) Fernie JD, Beattie B, Evans NR, Seager S (1995) A Database of Galactic Classical Cepheids. IBVS 4148 (http://www.astro.utoronto.ca/DDO/research/cepheids/cepheids.html)
- Ferrarese et al. (2007) Ferrarese L, Mould JR, Stetson PB, Tonry JL, Blakeslee JP, Ajhar EA (2007) The Discovery of Cepheids and a Distance to NGC 5128. ApJ 654:186–218
- Ford & Jenner (1978) Ford HC, Jenner DC (1978) Planetary Nebulae in the Nuclear Bulge of M81: A New Distance Determination. BAAS 10:665
- Fouqué et al. (2007) Fouqué P, Arriagada P, Storm J, Barnes TG, Nardetto N, Mérand A, Kervella P, Gieren W, Bersier D, Benedict GF, McArthur BE (2007) A new calibration of Galactic Cepheid period-luminosity relations from to bands, and a comparison to LMC relations. A&A 476:73–81
- Fouqué et al. (1990) Fouqué P, Bottinelli L, Gouguenheim L, Paturel G (1990) The extragalactic distance scale. II - The unbiased distance to the Virgo Cluster from the B-band Tully-Fisher relation. ApJ 349:1–21
- Fouqué et al. (2003) Fouqué P, Storm J, Gieren W (2003) Calibration of the Distance Scale from Cepheids. Lect. Notes Phys. 635:21–44
- Freedman & Madore (1988) Freedman WL, Madore BF (1988) Distances to the galaxies M81 and NGC 2403 from CCD I band photometry of Cepheids. ApJ 332:L63–L66
- Freedman et al. (2001) Freedman WL, Madore BF, Gibson BK, Ferrarese L, Kelson DD, Sakai S, Mould JR, Kennicutt RC, Ford HC, Graham JA, Huchra JP, Hughes SMG, Illingworth GD, Macri LM, Stetson PB (2001) Final Results from the Hubble Space Telescope Key Project to Measure the Hubble Constant. ApJ 553:47–72
- Gascoigne & Kron (1965) Gascoigne SCB, Kron GE (1965) Photoelectric observations of Magellanic Cloud Cepheids. MNRAS 130:333–360
- Gieren et al. (2005) Gieren W, Storm J, Barnes TG, Fouqué P, Pietrzynski G, Kienzle F (2005) Direct Distances to Cepheids in the Large Magellanic Cloud: Evidence for a Universal Slope of the Period-Luminosity Relation up to Solar Abundance. ApJ 627:224–237
- Gieren et al. (2006) Gieren W, Pietrzynski G, Nalewajko K, Soszynski I, Bresolin F, Kudritzki RP, Minniti D, Romanowsky A (2006) The Araucaria Project: An Accurate Distance to the Local Group Galaxy NGC 6822 from Near-Infrared Photometry of Cepheid Variables. ApJ 647:1056–1064
- Gilmozzi & Della Valle (2003) Gilmozzi R, Della Valle M (1986) Novae as Distance Indicators. Lect. Note Phys. 635:229–241
- Giraud (1986) Giraud E (1986) Perturbation of the nearby extragalactic velocity field by the Local Group. A&A 170:1–9
- Giraud (1990) Giraud E (1990) The local anomaly of the extragalactic velocity field. A&A 231:1–12
- Gouguenheim (1969) Gouguenheim L (1969) Neutral hydrogen content of small galaxies. A&A 3:281–307
- Governato et al. (1997) Governato F, Moore B, Cen R, Stadel J, Lake G, Quinn T (1997) The Local Group as a test of cosmological models. New Astr. 2:91–106
- Hamuy et al. (1996) Hamuy M, Phillips MM, Suntzeff NB, Schommer RA, Maza J, Aviles R (1996) The Hubble Diagram of the Calan/Tololo Type Ia Supernovae and the Value of . Astron. J. 112:2398–2407
- Hamuy & Pinto (2002) Hamuy M, Pinto PA (2002) Type II Supernovae as Standardized Candles. ApJ 566:L63–L65
- Hanes (1982) Hanes DA (1982) A re-examination of the Sandage-Tammann extragalactic distance scale. MNRAS 201:145–170
- Herrnstein et al. (1999) Herrnstein JR, Moran JM, Greenhill LJ, Diamond PJ, Inoue M, Nakai N, Miyoshi M, Henkel C, Riess A (1999) A geometric distance to the galaxy NGC 4258 from orbital motions in a nuclear gas disk. Nature 400:539–541
- Hubble (1929a) Hubble E (1929a) A spiral nebula as a stellar system, Messier 31. ApJ 69:103–158
- Hubble (1929b) Hubble E (1929b) A Relation between Distance and Radial Velocity among Extra-Galactic Nebulae. Proc. Nat. Acad. Sci. 15:168–173
- Hubble (1951) Hubble E (1951) The Penrose Lecture. Proc. Am. Phil. Soc. 51:461
- Hubble & Humason (1931) Hubble E, Humason ML (1931) The Velocity-Distance Relation among Extra-Galactic Nebulae. ApJ 74:43–80
- Hubble & Humason (1934) Hubble E, Humason ML (1934) The Velocity-distance Relation for Isolated Extragalactic Nebulae. Proc. Nat. Acad. Sci. 20:264–268
-
Huchra (2007)
Huchra J (2007)
Estimates of the Hubble Constant.
http://www.cfa.harvard.edu/~huchra/hubble.plot.dat (Last Updated Dec 30, 2007) - Hudson et al. (2004) Hudson MJ, Smith RJ, Lucey JR, Branchini E (2004) Streaming motions of galaxy clusters within . The peculiar velocity field. MNRAS 352:61–75
- Jerjen & Tammann (1993) Jerjen H, Tammann GA (1993) The Local Group Motion Towards Virgo and the Microwave Background. A&A 276:1–8
- Jha et al. (2007) Jha S, Riess AG, Kirshner RP (2007) Improved Distances to Type Ia Supernovae with Multicolor Light-Curve Shapes: MLCS2k2. ApJ 659:122–148
- Jones et al. (2005) Jones ME, Edge AC, Grainge K, Grainger WF, Kneissl R, Pooley GG, Saunders R, Miyoshi SJ, Tsuruta T, Yamashita K, Tawara Y, Furuzawa A, Harada A, Hatsukade I (2005) from an orientation-unbiased sample of Sunyaev-Zel’dovich and X-ray clusters. MNRAS 357:518–526
- Jørgensen et al. (1996) Jørgensen I, Franx M, Kjærgaard P (1996) The Fundamental Plane for cluster E and S0 galaxies. MNRAS 280:167–185
- Kanbur et al. (2007) Kanbur SM, Ngeow C, Nanthakumar A, Stevens R (2007) Investigations of the Nonlinear LMC Cepheid Period-Luminosity Relation with Testimator and Schwarz Information Criterion Methods. Publ. Astron. Soc. Pacific 119:512–522
- Karachentsev & Makarov (1996) Karachentsev ID, Makarov DA (1996) The Galaxy Motion Relative to Nearby Galaxies and the Local Velocity Field. Astron. J. 111:794–803
- Karachentsev et al. (2002) Karachentsev ID, Dolphin AE, Geisler D, Grebel EK, Guhathakurta P, Hodge PW, Karachentseva VE, Sarajedini A, Seitzer P, Sharina ME (2002) The M 81 group of galaxies: New distances, kinematics and structure. A&A 383:125–136
- Karachentsev et al. (2004) Karachentsev ID, Karachentseva VE, Huchtmeier WK, Makarov DI (2004) A Catalog of Neighboring Galaxies. Astron. J. 127:2031–2068
- Karachentsev & Kashibadze (2006) Karachentsev ID, Kashibadze OG (2006) Masses of the Local Group and of the M81 Group estimated from Distortions in the Local Velocity Field. Astrophysics 49:3–18
- Karachentsev et al. (2006) Karachentsev ID, Dolphin A, Tully RB, Sharina M, Makarova L, Makarov D, Karachentseva V, Sakai S, Shaya EJ (2006) Advanced Camera for Surveys Imaging of 25 Galaxies in Nearby Groups and in the Field. Astron. J. 131:1361–1376
- Karachentsev et al. (2007) Karachentsev ID, Tully RB, Dolphin A, Sharina M, Makarova L, Makarov D, Kashibadze OG, Karachentseva VE, Sakai S, Shaya EJ, Rizzi L (2007) The Hubble Flow around the Centaurus A/M83 Galaxy Complex. Astron. J. 133:504–517
- Karataeva et al. (2006) Karataeva GM, Tikhonov NA, Galazutdinova OA, Hagen-Thorn VA (2006) Stellar population of the central regions of NGC 5128. Astron. Letters 32:236–243
- Kavelaars et al. (2000) Kavelaars JJ, Harris WE, Hanes DA, Hesser JE, Pritchet CJ (2000) The Globular Cluster Systems in the Coma Ellipticals. I. The Luminosity Function in NGC 4874 and Implications for Hubble’s Constant. ApJ 533:125–136
- Kelson et al. (1996) Kelson DD, Illingworth GD, Freedman WF, Graham JA, Hill R, Madore BF, Saha A, Stetson PB, Kennicutt RC, Mould JR, Hughes SM, Ferrarese L, Phelps R, Turner A, Cook KH, Ford H, Hoessel JG, Huchra J (1996) The Extragalactic Distance Scale Key Project. III. The Discovery of Cepheids and a New Distance to M101 Using the Hubble Space Telescope. ApJ 463:26–59
- Kennicutt et al. (2003) Kennicutt RC, Bresolin F, Garnett DR (2003) The Composition Gradient in M101 Revisited. II. Electron Temperatures and Implications for the Nebular Abundance Scale. ApJ 591:801–820
- Kennicutt et al. (1998) Kennicutt RC, Stetson PB, Saha A, Kelson D, Rawson DM, Sakai S, Madore BF, Mould JR, Freedman WL, Bresolin F, Ferrarese L, Ford H, Gibson BK, Graham JA, Han M, Harding P, Hoessel JG, Huchra JP, Hughes SMG, Illingworth GD, Macri LM, Phelps RL, Silbermann NA, Turner AM, Wood PR (1998) The Hubble Space Telescope Key Project on the Extragalactic Distance Scale. XIII. The Metallicity Dependence of the Cepheid Distance Scale. ApJ 498:181–194
- Kervella et al. (2004) Kervella P, Nardetto N, Bersier D, Mourard D, Coudé du Foresto V (2004) Cepheid distances from infrared long-baseline interferometry. I. VINCI/VLTI observations of seven Galactic Cepheids. A&A 416:941–953
- Klypin et al. (2003) Klypin A, Hoffman Y, Kravtsov AV, Gottlöber S (2003) Constrained Simulations of the Real Universe: The Local Supercluster. ApJ 596:19–33
- Koen & Siluyele (2007) Koen C, Siluyele I (2007) Multivariate comparisons of the period-light-curve shape distributions of Cepheids in five galaxies. MNRAS 377:1281–1286
- Kraan-Korteweg (1986) Kraan-Korteweg RC (1986) A catalog of 2810 nearby galaxies - The effect of the Virgocentric flow model on their observed velocities. A&A Suppl. 66:255–279
- Kraan-Korteweg et al. (1988) Kraan-Korteweg RC, Cameron LM, Tammann GA (1988) 21 centimeter line width distances of cluster galaxies and the value of ApJ 331:620–640
- Kraft (1961) Kraft RP (1961) Color Excesses for Supergiants and Classical Cepheids. V. The Period-Color and Period-Luminosity Relations: a Revision. ApJ 134:616–632
- Kraft (1963) Kraft RP (1963) The Absolute Magnitudes of Classical Cepheids. In: Strand KA (ed) Basic Astronomical Data: Stars and Stellar Systems. Chicago, Univ. Chicago Press, p 481
- Kristian et al. (1978) Kristian J, Sandage A, Westphal JA (1978) The extension of the Hubble diagram. II - New redshifts and photometry of very distant galaxy clusters - First indication of a deviation of the Hubble diagram from a straight line. ApJ 221:383–394
- Laney & Stobie (1986) Laney CD, Stobie RS (1986) Infrared photometry of Magellanic Cloud Cepheids - Intrinsic properties of Cepheids and the spatial structure of Clouds. MNRAS 222:449–472
- Larsen et al. (2001) Larsen SS, Brodie JP, Huchra JP, Forbes DA, Grillmair CJ (2001) Properties of Globular Cluster Systems in Nearby Early-Type Galaxies. Astron. J. 121:2974–2998
- Leavitt’s (1908) Leavitt HS (1908) 1777 variables in the Magellanic Clouds. Harvard Ann. 60:87–108
- Leavitt & Pickering (1912) Leavitt HS, Pickering EC (1912) Periods of 25 Variable Stars in the Small Magellanic Cloud. Harvard Obs. Circ. 173:1–3
- Lee et al. (1993) Lee MG, Freedman WL, Madore BF (1993) The Tip of the Red Giant Branch as a Distance Indicator for Resolved Galaxies. ApJ 417:553–559
- Leith et al. (2008) Leith BM, Ng SCC, Wiltshire DL (2008) Gravitational Energy as Dark Energy: Concordance of Cosmological Tests. ApJ 672:L91–L94
- Lemaître (1927) Lemaître G (1927) Un univers homogè de masse constante et de rayon croissant rendant compte de la vitesse radiale des nébuleuses extra-galactiques. Ann. Soc. Sci. Bruxelles A47:49–56
- Lemaître (1931) Lemaître G (1931) Expansion of the universe, A homogeneous universe of constant mass and increasing radius accounting for the radial velocity of extra-galactic nebulae. MNRAS 91:483–490 (reprint of the 1927 paper)
- Leong & Saslaw (2004) Leong B, Saslaw WC (2004) Gravitational Binding, Virialization, and the Peculiar Velocity Distribution of the Galaxies. ApJ 608:636–646
- Lynden-Bell et al. (1988) Lynden-Bell D, Faber SM, Burstein D, Davies RL, Dressler A, Terlevich RJ, Wegner G (1988) Spectroscopy and photometry of elliptical galaxies. V - Galaxy streaming toward the new supergalactic center. ApJ 326:19–49
- Macri et al. (2006) Macri LM, Stanek KZ, Bersier D, Greenhill LJ, Reid MJ (2006) A New Cepheid Distance to the Maser-Host Galaxy NGC 4258 and Its Implications for the Hubble Constant. ApJ 652:1133–1149
- Madore (1976) Madore BF (1976) The distance to NGC 2403. MNRAS 177:157–166
- Madore & Freedman (1991) Madore BF, Freedman WL (1991) The Cepheid distance scale. Publ. Astron. Soc. Pacific 103:933–957
- Malmquist (1920) Malmquist KG (1920) A study of the stars of spectral type A. Lund Medd. Ser. II 22:1
- Malmquist (1922) Malmquist KG (1922) On some relations in stellar statistics. Lund Medd. Ser. I 100:1
- Marconi et al. (2005) Marconi M, Musella I, Fiorentino G (2005) Cepheid Pulsation Models at Varying Metallicity and Y/ Z. ApJ 632:590–610
- Masters et al. (2006) Masters KL, Springob CM, Haynes MP, Giovanelli R (2006) SFI++ I: A New I-Band Tully-Fisher Template, the Cluster Peculiar Velocity Dispersion, and . ApJ 653:861–880
- Mathewson et al. (1992a) Mathewson DS, Ford VL, Buchhorn M (1992a) A southern sky survey of the peculiar velocities of 1355 spiral galaxies. ApJ Suppl. 81:413–659
- Mathewson et al. (1992b) Mathewson DS, Ford VL, Buchhorn M (1992b) No back-side infall into the Great Attractor. ApJ 389:L5–L8
- McConnachie et al. (2005) McConnachie AW, Irwin MJ, Ferguson AMN, Ibata RA, Lewis GF, Tanvir N (2005) Distances and metallicities for 17 Local Group galaxies. MNRAS 356:979–997
- Mei et al. (2007) Mei S, Blakeslee JP, Côté P, Tonry JL, West MJ, Ferrarese L, Jordán A, Peng EW, Anthony A, Merritt D (2007) The ACS Virgo Cluster Survey. XIII. SBF Distance Catalog and the Three-dimensional Structure of the Virgo Cluster. ApJ 655:144–162
- Méndez et al. (1993) Méndez RH, Kudritzki RP, Ciardullo R, Jacoby GH (1993) The bright end of the planetary nebula luminosity function. A&A 275:534–548
- Minkowski (1962) Minkowski R (1962) Internal Dispersion of Velocities in Other Galaxies. In: McVittie GC (ed) Problems of Extra-Galactic Research. IAU Symp. 15, pp 112–118
- Mouhcine et al. (2005) Mouhcine M, Ferguson HC, Rich RM, Brown TM, Smith TE (2005) Halos of Spiral Galaxies. I. The Tip of the Red Giant Branch as a Distance Indicator. ApJ 633:810–820
- Nadyozhin (2003) Nadyozhin DK (2003) Explosion energies, nickel masses and distances of Type II plateau supernovae. MNRAS 346:97–104
- Ngeow et al. (2005) Ngeow CC, Kanbur SM, Nokolaev S, Buonacorsi J, Cook KH, Welch DL (2005) Further empirical evidence for the non-linearity of the period-luminosity relations as seen in the Large Magellanic Cloud Cepheids. MNRAS 363:831–846
- Nugent et al. (2006) Nugent P, Sullivan M, Ellis R, Gal-Yam A, Leonard DC, Howell DA, Astier P, Carlberg RG, Conley A, Fabbro S, Fouchez D, Neill JD, Pain R, Perrett K, Pritchet CJ, Regnault N (2006) Toward a Cosmological Hubble Diagram for Type II-P SNe. ApJ 645:841–850
- Osterbrock (2001) Osterbrock DE (2001) Walter Baade, A Life in Astrophysics. Princeton Univ. Press
- Ostriker (1993) Ostriker JP (1993) Astronomical tests of the cold dark matter scenario. ARA&A 31:689–716
- Panagia (2005) Panagia N (2005) A Geometric Determination of the Distance to SN 1987A and the LMC. In: Marcaide JM, Weiler KW (eds) Cosmic Explosions. IAU Coll. 192, p 585
- Persson et al. (2004) Persson SE, Madore BF, Krzemiński W, Freedman WL, Roth M, Murphy DC (2004) New Cepheid Period-Luminosity Relations for the Large Magellanic Cloud: 92 Near-Infrared Light Curves. Astron. J. 128:2239–2264
- Pietrzyński et al. (2006) Pietrzyński G, Gieren W, Soszyński I, Bresolin F, Kudritzki RP, Dall’Ora M, Storm J, Bono G (2006) The Araucaria Project: The Distance to the Local Group Galaxy IC 1613 from Near-Infrared Photometry of Cepheid Variables. ApJ 642:216–224
- Press (1997) Press WH (1997) Understanding data better with Bayesian and global statistical methods. In: Bahcall JN, Ostriker JP (eds) Unsolved Problems in Astrophysics. Princeton, Princton Univ. Press, pp 49–60
- Read et al. (2007) Read JI, Saha P, Macciò AV (2007) Radial Density Profiles of Time-Delay Lensing Galaxies. ApJ 667:645–654
- Reindl et al. (2005) Reindl B, Tammann GA, Sandage A, Saha A (2005) Reddening, Absorption, and Decline Rate Corrections for a Complete Sample of Type Ia Supernovae leading to a Fully Corrected Hubble Diagram to . ApJ 624:532–554
- Rejkuba et al. (2005) Rejkuba M, Greggio L, Harris WE, Harris GLH, Peng EW (2005) Deep ACS Imaging of the Halo of NGC 5128: Reaching the Horizontal Branch. ApJ 631:262–279
- Ribas et al. (2005) Ribas I, Jordi C, Vilardell F, Fitzpatrick EL, Hilditch RW, Guinan EF (2005) First Determination of the Distance and Fundamental Properties of an Eclipsing Binary in the Andromeda Galaxy. ApJ 635:L37–L40
- Ribas (2007) Ribas I (2007) The New Era of Eclipsing Binary Research with Large Telescopes. In: Hartkopf WI, Guinan EF, Harmanec P (eds) Binary Stars as Critical Tools & Tests in Contemporary Astrophysics. IAU Symp. 240, pp 69–78
- Riess et al. (2005) Riess AG, Li W, Stetson PB, Filippenko AV, Jha S, Kirshner RP, Challis PM, Garnavich PM, Chornock R (2005) Cepheid Calibrations from the Hubble Space Telescope of the Luminosity of Two Recent Type Ia Supernovae and a Re-determination of the Hubble Constant. ApJ 627:579–607
- Rizzi et al. (2006) Rizzi L, Bresolin F, Kudritzki RP, Gieren W, Pietrzyński G (2006) The Araucaria Project: The Distance to NGC 300 from the Red Giant Branch Tip Using HST ACS Imaging. ApJ 638:766–771
- Rizzi et al. (2007a) Rizzi L, Held EV, Saviane I, Tully RB, Gullieuszik M (2007a) The distance to the Fornax dwarf spheroidal galaxy. MNRAS 380:1255–1260
- Rizzi et al. (2007b) Rizzi L, Tully RB, Makarov D, Makarova L, Dolphin AE, Sakai S, Shaya EJ (2007b) Tip of the Red Giant Branch Distances. II. Zero-Point Calibration. ApJ 661:815–829
- Robertson (1928) Robertson HP (1928) On relativistic cosmology. Phil. Mag. 5:835–848
- Rowan-Robinson (1985) Rowan-Robinson M (1985) The Cosmological Distance Ladder: Distances and Time in the Universe. New York, Freeman
- Rood (1972) Rood RT (1972) Metal-Poor Stars. IV. The Evolution of Red Giants. ApJ 177:681–691
- Saha et al. (2006) Saha A, Thim F, Tammann GA, Reindl B, Sandage A (2006) Cepheid Distances to SNe Ia Host Galaxies based on a Revised Photometric Zero Point of the HST-WFPC2 and New P-L Relations and Metallicity Corrections. ApJ Suppl. 165:108–137 (STT 06)
- Sakai et al. (1997) Sakai S, Madore, BF, Freedman WL, Lauer TR, Ajhar EA, Baum WA (1997) Detection of the Tip of the Red Giant Branch in NGC 3379 (M105) in the Leo I Group Using the Hubble Space Telescope. ApJ 478:49–57
- Sakai et al. (1999) Sakai S, Madore, BF, Freedman WL (1999) Cepheid and Tip of the Red Giant Branch Distances to the Dwarf Irregular Galaxy IC 10. ApJ 511:671–679
- Sakai et al. (2004) Sakai S, Ferrarese L, Kennicutt RC, Saha A (2004) The Effect of Metallicity on Cepheid-based Distances. ApJ 608:42–61
- Salaris & Cassisi (1997) Salaris M, Cassisi S (1997) The ‘tip’ of the red giant branch as a distance indicator: results from evolutionary models. MNRAS 289:406–414
- Salaris & Cassisi (1998) Salaris M, Cassisi S (1998) A new analysis of the red giant branch ‘tip’ distance scale and the value of the Hubble constant. MNRAS 298:166–178
- Sambhus et al. (2005) Sambhus N, Gerhard O, Méndez RH (2005) Kinematic evidence for different Planetary Nebulae Populations in the elliptical galaxy NGC 4697. Astron. J. 131:837–848
- Sandage (1971) Sandage A (1971) The Distance of the Local-Group Galaxy IC 1613 Obtained from Baade’s Work on its Stellar Content. ApJ 166:13–35
- Sandage (1972) Sandage A (1972) The redshift-distance relation. II. The Hubble diagram and its scatter for first-ranked cluster galaxies: A formal value for . ApJ 178:1–24
- Sandage (1975) Sandage A (1975) The redshift-distance relation. VIII - Magnitudes and redshifts of southern galaxies in groups: A further mapping of the local velocity field and an estimate of the deceleration parameter. ApJ 202:563–582
- Sandage (1986a) Sandage A (1986a) The redshift-distance relation. IX - Perturbation of the very nearby velocity field by the mass of the Local Group. ApJ 307:1–19
- Sandage (1986b) Sandage A (1986b) The population concept, globular clusters, subdwarfs, ages, and the collapse of the Galaxy. ARA&A 24:421–458
- Sandage (1994a) Sandage A (1994a) Bias Properties of Extragalactic Distance Indicators I: The Hubble constant does not increase outward. ApJ 430:1–12
- Sandage (1994b) Sandage A (1994b) Bias Properties of Extragalactic Distance Indicators II: Bias corrections to Tully-Fisher distances for field galaxies. ApJ 430:13–28
- Sandage (1995) Sandage A (1995) Observational Selection Bias. In: Binggeli B, Buser R (eds) The Deep Universe. Berlin, Springer, pp 210–232
- Sandage (1999a) Sandage A (1999a) The First 50 Years at Palomar: 1949-1999 The Early Years of Stellar Evolution, Cosmology, and High-Energy Astrophysics. ARA&A 37:445–486
- Sandage (1999b) Sandage A (1999b) Bias Properties of Extragalactic Distance Indicators. VIII. from Distance-limited Luminosity Class and Morphological Type-Specific Luminosity Functions for SB, SBC, and SC Galaxies Calibrated Using Cepheids. ApJ 527:479–487
- Sandage (2008) Sandage A (2008) Bias Properties of Extragalactic Distance Indicators XII: Bias Effects of Slope Differences and Intrinsic Dispersion on Tully-Fisher Distances to Galaxy Clusters with Application to the Virgo Cluster. Publ. Astron. Soc. Pacific submitted, astro-ph/0712.2066
- Sandage & Bedke (1994) Sandage A, Bedke J (1994) The Carnegie atlas of galaxies. Washington, Carnegie Institution
- Sandage & Hardy (1973) Sandage A, Hardy E (1973) The Redshift-Distance Relation. VII. Absolute Magnitudes of the First Three Ranked Cluster Galaxies as Functions of Cluster Richness and Bautz-Morgan Cluster Type: the Effect of . ApJ 183:743–758
- Sandage & Tammann (1968) Sandage A, Tammann GA (1968) A Composite Period-Luminosity Relation for Cepheids at Mean and Maximum Light. ApJ 151:531–545
- Sandage & Tammann (1969) Sandage A, Tammann GA (1969) The Double Cepheid CE Cassiopeiae in NGC 7790: Tests of the Theory of the Instability Strip and the Calibration of the Period-Luminosity Relation. ApJ 157:683–708
- Sandage & Tammann (1974a) Sandage A, Tammann GA (1974a) Steps toward the Hubble constant. III. The distance and stellar content of the M101 group of galaxies. ApJ 194:223–243
- Sandage & Tammann (1974b) Sandage A, Tammann GA (1974b) Steps toward the Hubble constant. IV. Distances to 39 galaxies in the general field leading to a calibration of the galaxy luminosity classes and a first hint of the value of . ApJ 194:559–568
- Sandage & Tammann (1975a) Sandage A, Tammann GA (1975a) Steps toward the Hubble constant. V. The Hubble constant from nearby galaxies and the regularity of the local velocity field. ApJ 196:313–328
- Sandage & Tammann (1975b) Sandage A, Tammann GA (1975b) Steps toward the Hubble constant. VI. The Hubble constant determined from redshifts and magnitudes of remote Sc I galaxies: The value of . ApJ 197:265–280
- Sandage & Tammann (1976) Sandage A, Tammann GA (1976) Steps toward the Hubble constant. VII. Distances to NGC 2403, M101, and the Virgo cluster using 21 centimeter line widths compared with optical methods: The global value of . ApJ 210:7–24
- Sandage & Tammann (1985) Sandage A, Tammann GA (1985) In: Setti G, Van Hove L (eds) Large-Scale Structure of the Universe, Cosmology and Fundamental Physics. Garching, ESO, p 127
- Sandage & Tammann (1990) Sandage A, Tammann GA (1990) Steps toward the Hubble constant. IX. The cosmic value of freed from all local velocity anomalies. ApJ 365:1–12
- Sandage & Tammann (1995) Sandage A, Tammann GA (1995) Steps toward the Hubble Constant. X - The Distance of the Virgo Cluster Core Using Globular Clusters. ApJ 446:1–11
- Sandage & Tammann (2006) Sandage A, Tammann GA (2006) Absolute Magnitude Calibrations of Population I and II Cepheids and Other Pulsating Variables in the Instability Strip of the Hertzsprung-Russell Diagram. ARA&A 44:93–140
- Sandage et al. (1995) Sandage A, Tammann GA, Federspiel M (1995) Bias Properties of Extragalactic Distance Indicators. IV. Demonstration of the Population Incompleteness Bias Inherent in the Tully-Fisher Method Applied to Clusters. ApJ 452:1–15
- Sandage et al. (1972) Sandage A, Tammann GA, Hardy E (1972) Limits on the Local Deviation of the Universe from a Homogeneous Model. ApJ 172:253–263
- Sandage et al. (2004) Sandage A, Tammann GA, Reindl B (2004) New period-luminosity and period-color relations of classical Cepheids. II. Cepheids in LMC. A&A 424:43–71
- Sandage et al. (2006) Sandage A, Tammann GA, Saha A, Reindl B, Macchetto FD, Panagia N (2006) The Hubble Constant, A Summary of the Hubble Space Telescope Program for the Luminosity Calibration of Type Ia Supernovae by Means of Cepheids. ApJ 653:843–860 (STS 06)
- Saviane et al. (2004) Saviane I, Hibbard JE, Rich RM (2004) The Stellar Content of the Southern Tail of NGC 4038/4039 and a Revised Distance. Astron. J. 127:660–678
- Sérsic (1959) Sérsic JL (1959) The H II regions as distance indicators. The Observatory 79:54–56
- Seth et al. (2005) Seth AC, Dalcanton JJ, de Jong RS (2005) A Study of Edge-On Galaxies with the HST Advanced Camera for Surveys. I. Initial Results. Astron. J. 129:1331–1349
- Soszyński et al. (2006) Soszyński I, Gieren W, Pietrzyński G, Bresolin F, Kudritzki RP, Storm J (2006) The Araucaria Project: Distance to the Local Group Galaxy NGC 3109 from Near-Infrared Photometry of Cepheids. ApJ 648:375–382
- Spergel et al. (2007) Spergel DN, Bean R, Doré O, Nolta MR, Bennett CL, Dunkley J, Hinshaw G, Jarosik N, Komatsu E, Page L, Peiris HV, Verde L, Halpern M, Hill RS, Kogut A, Limon M, Meyer SS, Odegard N, Tucker GS, Weiland JL, Wollack E, Wright EL (2007) Three-Year Wilkinson Microwave Anisotropy Probe (WMAP) Observations: Implications for Cosmology. ApJ Suppl. 170:377–408
- Suntzeff et al. (1999) Suntzeff NB, Phillips MM, Covarrubias R, Navarrete M, Pérez JJ, Guerra A, Acevedo MT, Doyle LR, Harrison T, Kane S, Long KS, Maza J, Miller S, Piatti AE, Clariá JJ, Ahumada AV, Pritzl B, Winkler PF (1999) Optical Light Curve of the Type Ia Supernova 1998bu in M96 and the Supernova Calibration of the Hubble Constant. Astron. J. 117:1175–1184
- Sweigart & Gross (1978) Sweigart AV, Gross PG (1978) Evolutionary sequences for red giant stars. ApJ Suppl. 36:405–437
- Tammann (1993) Tammann GA (1993) Why are Planetary Nebulae Poor Distance Indicators? In: Weinberger R, Acker A (eds) Planetary Nebulae. IAU Symp. 155, pp 515–522
- Tammann (1987) Tammann GA (1987) The cosmic distance scale. In: Hewitt A, Burbidge G, Fang L (eds) Observational cosmology. IAU Symp. 124, pp 151–185
- Tammann (1998) Tammann GA (1998) Variations of the Cosmic Expansion Field and the Value of the Hubble Constant. In: Piran T, Ruffini R (eds) Eighth Marcel Grossmann Meeting: Recent Developments in Theoretical and Experimental General Relativity, Gravitation, and Relativistic Field Theories. Singapore, World Scientific, p 243
- Tammann & Reindl (2006) Tammann GA, Reindl B (2006) Karl Schwarzschild Lecture: The Ups and Downs of the Hubble Constant. In: Röser S (ed) Reviews in Modern Astronomy Vol. 19: The Many Facets of the Universe – Revelations by New Instruments. Weinheim, Viley-VCH, pp 1–29
- Tammann & Sandage (1968) Tammann GA, Sandage A (1968) The Stellar Content and Distance of the Galaxy NGC 2403 in the M81 Group. ApJ 151:825–860
- Tammann & Sandage (1985) Tammann GA, Sandage A (1985) The infall velocity toward Virgo, the Hubble constant, and a search for motion toward the microwave background. ApJ 294:81–95
- Tammann & Sandage (1999) Tammann GA, Sandage A (1999) The Luminosity Function of Globular Clusters as an Extragalactic Distance Indicator. In: Egret D, Heck A (eds) Harmonizing Cosmic Distance Scales in a Post-Hipparcos Era. ASP Conf. Ser. 167, pp 204–216
- Tammann et al. (2003) Tammann GA, Sandage A, Reindl B (2003) New Period-Luminosity and Period-Color relations of classical Cepheids: I. Cepheids in the Galaxy. A&A 404:423–448
- Tammann et al. (2008) Tammann GA, Sandage A, Reindl B (2008) Comparison of distances from RR Lyrae stars, the tip of the red-giant branch and classical Cepheids. ApJ 679:52–71 (TSR 08)
- Teerikorpi (1987) Teerikorpi P (1987) Cluster population incompleteness bias and distances from the Tully-Fisher relation – Theory and numerical examples. A&A 173:39–42
- Teerikorpi (1990) Teerikorpi P (1990) Theoretical aspects in the use of the inverse Tully-Fisher relation for distance determination. A&A 234:1–4
- Tegmark et al. (2006) Tegmark M, Eisenstein DJ, Strauss MA, Weinberg DH, Blanton MR, Frieman JA, Fukugita M, Gunn JE, Hamilton AJS, Knapp GR, Nichol RC, Ostriker JP, Padmanabhan N, Percival WJ, Schlegel DJ, Schneider DP, Scoccimarro R, Seljak U, Seo HJ, Swanson M, Szalay AS, Vogeley MS, Yoo J, Zehavi I, Abazajian K, Anderson SF, Annis J, Bahcall NA, Bassett B, Berlind A, Brinkmann J, Budavari T, Castander F, Connolly A, Csabai I, Doi M, Finkbeiner DP, Gillespie B, Glazebrook K, Hennessy GS, Hogg DW, Ivezić Z, Jain B, Johnston D, Kent S, Lamb DQ, Lee BC, Lin H, Loveday J, Lupton RH, Munn JA, Pan K, Park C, Peoples J, Pier JR, Pope A, Richmond M, Rockosi C, Scranton R, Sheth RK, Stebbins A, Stoughton C, Szapudi I, Tucker DL, Berk DEV, Yanny B, York DG (2006) Cosmological constraints from the SDSS luminous red galaxies. Phys. Rev. D, 74, id. 123507
- Thim et al. (2003) Thim F, Tammann GA, Saha A, Dolphin A, Sandage A, Tolstoy E, Labhardt L (2003) The Cepheid Distance to NGC 5236 (M83) with the ESO Very Large Telescope. ApJ 590:256–270
- Tikhonov (2006) Tikhonov NA (2006) Stellar structure of irregular galaxies: Edge-on galaxies. Astron. Reports 50:517–525
- Tikhonov & Galazutdinova (2005) Tikhonov NA, Galazutdinova OA (2005) Stellar Disks and Halos of Edge-on Spiral Galaxies: NGC 891, NGC 4144, and NGC 4244. Ap 48:221–236
- Tikhonov et al. (2006) Tikhonov NA, Galazutdinova OA, Drozdovsky IO (2006) Stellar halos and thick disks around edge-on spiral galaxies IC2233, IC5052, NGC4631 and NGC5023. A&A submitted, astro-ph/0603457
- Tonry et al. (2001) Tonry JL, Dressler A, Blakeslee JP, Ajhar EA, Fletcher AB, Luppino GA, Metzger MR, Moore CB (2001) The SBF Survey of Galaxy Distances. IV. SBF Magnitudes, Colors, and Distances. ApJ 546:681–693
- Tonry & Schneider (1988) Tonry JL, Schneider D (1988) A new technique for measuring extragalactic distances. Astron. J. 96:807–815
- Trimble (1996) Trimble V (1996) : The Incredible Shrinking Constant, 1925-1975. Publ. Astron. Soc. Pacific 108:1073-1082
- Tripp & Branch (1999) Tripp R, Branch D (1999) Determination of the Hubble Constant Using a Two-Parameter L ApJ 525:209-214
- Tully (1988) Tully RB (1988) Origin of the Hubble constant controversy. Nature 334:209–212
- Tully & Fisher (1977) Tully RB, Fisher JR (1977) A new method of determining distances to galaxies. A&A 54:661–673
- Tully & Pierce (2000) Tully RB, Pierce MJ (2000) Distances to Galaxies from the Correlation between Luminosities and Line Widths. III. Cluster Template and Global Measurement of . ApJ 533:744–780
- Tully et al. (2006) Tully RB, Rizzi L, Dolphin AE, Karachentsev ID, Karachentseva VE, Makarov DI, Makarova L, Sakai S, Shaya EJ (2006) Associations of Dwarf Galaxies. Astron. J. 132:729–748
- Udalski et al. (1999) Udalski A, Soszynski I, Szymanski M, Kubiak M, Pietrzynski G, Wozniak P, Zebrun K (1999) The Optical Gravitational Lensing Experiment. Cepheids in the Magellanic Clouds. IV. Catalog of Cepheids from the Large Magellanic Cloud. AcA 49:223–317
- Udomprasert et al. (2004) Udomprasert PS, Mason BS, Readhead ACS, Pearson TJ (2004) An Unbiased Measurement of through Cosmic Background Imager Observations of the Sunyaev-Zel’dovich Effect in Nearby Galaxy Clusters. ApJ 615:63–81
- van den Bergh (1960a) van den Bergh S (1960a) A Preliminary Luminosity Clssification of Late-Type Galaxies. ApJ 131:215–223
- van den Bergh (1960b) van den Bergh S (1960b) A Preliminary Liminosity Classification for Galaxies of Type Sb. ApJ 131:558–573
- van den Bergh (1960c) van den Bergh S (1960c) A reclassification of the northern Shapley-Ames galaxies. Publ. David Dunlap Obs. 2, pp 159–199
- van den Bergh et al. (1985) van den Bergh S, Pritchet C, Grillmair C (1985) Globular clusters and the distance to M87. Astron. J. 90:595–599
- van Leeuwen et al. (2007) van Leeuwen F, Feast MW, Whitelock PA, Laney CD (2007) Cepheid Parallaxes and the Hubble Constant. MNRAS 379:723–737
- Wang et al. (2006) Wang X, Wang L, Pain, R, Zhou X, Li Z (2006) Determination of the Hubble Constant, the Intrinsic Scatter of Luminosities of Type Ia Supernovae, and Evidence for Nonstandard Dust in Other Galaxies. ApJ 645:488–505
- Wesselink (1946) Wesselink AJ (1946) The observations of brightness, colour and radial velocity of Cephei and the pulsation hypothesis. BAN 10:91–99
- Wiltshire (2007a) Wiltshire DL (2007a) Exact Solution to the Averaging Problem in Cosmology. Phys. Rev. Lett. 99:251101, 1–5
- Wiltshire (2007b) Wiltshire DL (2007b) Cosmic Clocks, cosmic variance, and cosmic averages. New J. Phys. 9:397-443
- Wood-Vasey et al. (2007) Wood-Vasey WM, Friedman AS, Bloom JS, Hicken M, Modjaz M, Kirshner RP, Starr DL, Blake CH, Falco EE, Szentgyorgyi AH, Challis P, Blondin S, Rest A (2007) Type Ia Supernovae are Good Standard Candles in the Near Infrared: Evidence from PAIRITEL. ApJ in press, astro-ph/0711.2068
- Yahil et al. (1980) Yahil A, Sandage A, Tammann GA (1980) The deceleration of nearby galaxies. In: Balian E, Audouze J, Schramm DN (eds) Physical Cosmology. Amsterdam, North-Holland, pp 127–159
- Yahil et al. (1977) Yahil A, Tammann GA, Sandage A (1977) The Local Group – The solar motion relative to its centroid. ApJ 217:903–915
- Zehavi et al. (1998) Zehavi I, Riess AG, Kirshner RP (1998) A local Hubble bubble from type Ia supernovae? ApJ 503:483–491
- Zinn & West (1984) Zinn R, West MJ (1984) The globular cluster system of the galaxy. III - Measurements of radial velocity and metall icity for 60 clusters and a compilation of metallicities for 121 clusters. ApJ Suppl. 55:45–66
- Zucker et al. (2006) Zucker DB, Belokurov V, Evans NW, Wilkinson MI, Irwin MJ, Sivarani T, Hodgkin S, Bramich DM, Irwin JM, Gilmore G, Willman B, Vidrih S, Fellhauer M, Hewett PC, Beers TC, Bell EF, Grebel EK, Schneider DP, Newberg HJ, Wyse RFG, Rockosi CM, Yanny B, Lupton R, Smith JA, Barentine JC, Brewington H, Brinkmann J, Harvanek M, Kleinman SJ, Krzesinski J, Long D, Nitta A, Snedden SA (2006) A New Milky Way Dwarf Satellite in Canes Venatici. ApJ 643:L103–L106