Experimental Observation of the Inverse Proximity Effect in Superconductor/Ferromagnet Layered Structures
Abstract
We have studied the nuclear magnetic resonance (NMR) of 51V nuclei in the superconductor/ferromagnet thin film heterostructures Ni/V/Ni and Pd1-xFex/V/Pd1-xFex in the normal and superconducting state. Whereas the position and shape of the NMR line in the normal state for the trilayers is identical to that observed in a single V-layer, in the superconducting state the line shape definitely changes, developing a systematic distortion of the high-field wing of the resonance line. We consider this as the first experimental evidence for the penetration of ferromagnetism into the superconducting layer, a phenomenon which has been theoretically predicted recently and dubbed the inverse proximity effect.
The penetration of the superconducting condensate into a ferromagnet in superconductor/ferromagnet (S/F) heterostructures, the so-called S/F proximity effect, is well understood by now (see, e.g., Buzdin and Efetov ) for recent reviews. However, only recently it has been shown theoretically that the inverse effect, namely the penetration of ferromagnetism into a superconductor, should also exist Bergeret ; Kharitonov . The basic physical origin for this so-called inverse proximity effect can qualitatively be understood rather easily: The conduction electron spins of a thin F-layer are predominantly oriented in one direction because of the conduction electron spin polarization. Due to superconducting correlations at distances of the order of the Cooper pair size from the S/F interface, these electrons have Cooper partners with the opposite spin direction in the S-layer, thus giving rise to a spin polarization of the conduction electrons in the S-layer with a direction opposite to the ferromagnet.
Until now there is no unequivocal experimental evidence for the inverse proximity effect in the literature. A quantitative estimation shows that the amplitude of the induced magnetization in the S-layer is small, especially when taking the limited transparency of the S/F interface in a real thin film system into account Efetov . Thus one needs an experimental method with very high sensitivity for small changes of the spin polarization in the S-layer. The induced spin polarization in the superconductor corresponds to a decrease in the spin susceptibility of the conduction electrons upon the transition to the superconducting state. The spin susceptibility of the conduction electrons, on the other hand, is one of the physical reasons for the Knight shift of the nuclear magnetic resonance (NMR) line in metals. Thus, in NMR the inverse proximity effect should manifest itself as a decrease of the Knight shift upon the transition to the superconducting state. As will be shown below, using the super sensitive NMR techniques, it actually is possible to observe this effect.
The choice of a suitable F/S material combination is of primary importance for an observation of the inverse proximity effect. The material for the S-layer should have a strong NMR signal, a high superconducting transition temperature and a high quality interface with the F-material. In addition, there should be an appreciable change of the Knight shift on the transition to the superconducting state. Among the suitable elemental superconductors Pb, Nb and V appear as the most promising candidates Schrieffer ; MacLaughlin . However, only V fulfills the condition of a high interface quality with epitaxial growth on Fe Hjorvarsson and high interface transparency for the electrons Garifullin . Recently we have shown that the Knight shift of pure V changes upon the transition to the superconducting state JETPLett , very similar to pure Nb Rossier , which has a similar electronic structure. This is contrary to earlier experiments of Noer and Knight Noer .
In order to reach a noticeable magnetic polarization due to the inverse proximity effect, the S-layer thickness in the S/F heterostructures should match the superconducting coherence length. In our case it is restricted to about 30 nm (see Table 1), implying that the number of V-nuclei involved in the resonance signal will be extremely small. Conventional NMR techniques then encounter serious sensitivity problems. In order to overcome this, we built a super sensitive NMR spectrometer operating in a continuous mode at the frequency of about 6 MHz 1 , based on a Robinson-scheme generator (see, e.g., Wilson ). MOSFET transistors capable of operating at 4 K enable the immersion of the HF generator into liquid helium in close vicinity to the sample pick-up coil. This strongly reduces thermal noise and excludes losses in the connecting line. Since the gyromagnetic ratio for the Cu and V nuclei are very similar, the resonator coil as well as the magnetic field modulation coils were wound of high-purity silver wire. At liquid-helium temperatures, the resonance circuit has a high -value that also considerably enhances the NMR spectrometer sensitivity. The generator output was connected to a lock-in amplifier working with digital signal processing. For the generation of the dc magnetic field we used the magnetic system of the Bruker EPR spectrometer ER-418, which includes field sweep option and stabilization by a Hall unit. Precision measurements of the magnetic field were performed by a NMR gaussmeter whose NMR sensor was always in a strictly fixed position. The experimental error in the measurement of the magnetic field including its inhomogeneity in the operating range ( Oe/cm) did not exceed 0.2 Oe.
For the NMR study we have prepared F/S/F trilayers using V as the superconducting layer and either Ni or an alloy Pd1-xFex as the ferromagnetic layers (see Table 1). All layers were grown on single-crystalline MgO(001) substrates by molecular beam epitaxy in a growth chamber with a base pressure below mbar. For V, Ni and Pd we used electron beam evaporation and a growth rate of 0.15, 0.03 and 0.05 nm/s, respectively. The Pd1-xFex alloys were produced by co-evaporation of Pd and Fe. Fe was evaporated from an effusion cell with an evaporation rate depending on the desired concentration of Fe in the Pd1-xFex alloy. The concentrations of Fe in the Pd1-xFex alloys given in Table 1 were refined with the data for taken from literature PdFeCurie . From the temperature dependence of the magnetization measured using a SQUID magnetometer we derived a ferromagnetic Curie temperature 75 and 100 K for the two samples of Table 1, for these Curie temperatures we estimate an Fe concentration of 0.02 and 0.03 (see Table 1). To prevent oxidation, all samples were capped by Pd layers. A growth temperature of 300o C was chosen for all layers, this temperature provides a good compromise between crystallinity and low interdiffusion at the interfaces. In-situ reflection high energy electron diffraction during the growth process revealed smooth layer growth of all layers. The thickness and the quality of the films were investigated by conventional small-angle x-ray reflectivity. Well resolved Kiessig fringes from the total layer thickness were clearly observed. Fits using the modified Parratt formalism Parratt ; Nevot gave the thickness of the V-layer and the interface roughness parameter (Rough), also included in Table 1. Due to the fact that the structural quality of V grown directly on MgO is much higher than for the growth on Ni and Pd1-xFex layers, the Rough values for the single V layer and the trilayer systems are different (see Table 1, column 3).
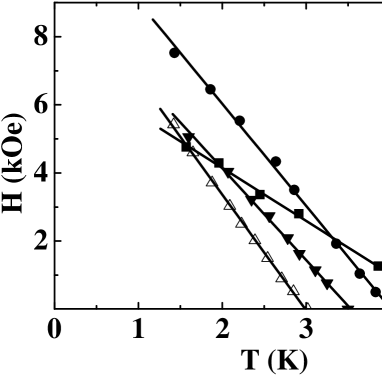
The upper critical field for the magnetic field direction perpendicular to the film plane (Fig.1) has been measured resistively by the standard four point dc technique. The superconducting transition temperature of the samples from Table 1 is between 3.6 K and 5 K (see fourth column of Table 1). From the residual resistivity ratio (fifth column Table 1) we can determine the residual resistivity by using the phonon contribution to the resistivity of V, (300 K) = 18.2 . Following Lazar et al. Lazar and using the Pippard relations Pippard , we get 2 and can calculate the mean free path of the conduction electrons (6th column, Table 1). The BCS coherence length for V is = 44 nm. A comparison of and implies that the superconducting properties of our samples are closer to the "dirty" limit () than to the "clean" limit (). In the "dirty" limit holds, which is given in the last column of Table 1.
The NMR measurements were performed on the 51V nuclei in the temperature range from 1.4-4.2 K. Since the operating frequencies are slightly different for different samples, in order to compare the resonance line positions directly, all data were recalculated to the same frequency , in our case to = 5542.3 kHz. All measurements were performed with a perpendicular orientation of dc magnetic field relative to the film plane. The signal-to-noise ratio does not exceed 3 and therefore we accumulated signals from at least 2030 sweeps of the magnetic field during two minutes each.
In the normal state, the V NMR line shape and position were approximately the same for all samples studied. Therefore, in Fig. 2a we show the NMR signal in the normal state for the single V-layer only. The resonance line shape is described by the derivative of a Gaussian absorption curve. Fitting this theoretical curve we can determine the resonance line position with an absolute accuracy below 0.5 Oe. For the resonance line width (the peak-to-peak distance of the absorption line derivative) we get a value of 12.2 Oe. The resonance field at = 4923.1 Oe is found to be shifted by = 29.1 Oe relative to the position in an insulator (4952.2 Oe for 51V), thus, for the Knight shift in the normal state, which is defined as the ratio of the NMR line shift relative to its position in an insulator, we get 0.59 0.01 %, in good agreement with the value measured previously Noer ; JETPLett .
When decreasing the temperature below the superconducting transition temperature for the single V-layer (Fig. 2b), the resonance line shifts to higher magnetic fields with some broadening of the line width, but the resonance line shape can still be described by a Gaussian absorption curve. For the F/S/F trilayer samples (Fig. 2c-2e), however, after the transition to the superconducting state, the NMR line shape is found to be markedly changed, the high-field wing of the NMR line appearing strongly distorted. As will be discussed next, this can be taken as an experimental manifestation of the inverse proximity effect.
In NMR experiments in an external magnetic field perpendicular to the film plane the superconducting film of a type II superconductor is in the vortex state, and the resonance line is shifted and broadened due to the intrinsic spatial inhomogeneity of the magnetization in the vortex state. For a detailed theory of NMR in type II superconductors in the vortex state see Rossier ; Delriew . Following these calculations, the magnetic field in the center of the vortex core is given by , ( is the magnetization). At the saddle point of the vortices for a triangular vortex lattice in the dirty limit the result for the local magnetic field is Dobrosavljevic . The portion of nuclei in the Abrikosov vortex lattice is maximum at the saddle point (see, e. g. Rossier ). Thus if the magnetization is not too large (i.e. if the resonance field is close to the upper critical magnetic field ) one expects that the NMR resonance field shifts a bit to the high-field side and is slightly broadened, but still can be approximated by a Gaussian absorption curve. For the pure V-film (Fig. 2a,b) this is just what we observe, the shift of the resonance field being about 9 Oe, similar to what we have found JETPLett in bulk V before. However, for the F/S/F trilayers in Fig. 2 c-e the line shape is definitely changed in the superconducting state. It is asymmetric with a strongly distorted high-field wing, suggesting that in the superconducting state there is an additional mechanism determining the line shape.
As discussed above, according to the model of the inverse proximity effect Bergeret , spin-polarized electrons from the interfacial region penetrate into the superconducting layer. By means of the hyperfine interactions this spin-polarization induces a local field on the V nuclei with a direction opposite to the external magnetic field (we suppose that the conduction electron spin polarization in the ferromagnetic layer is in the direction of the applied field) and the NMR resonance field shifts to higher fields accordingly. In quantitative terms, in order to calculate the NMR line shape, one must also take the spatial distribution of the spin polarization in the superconducting layer into consideration. The induced spin-polarization in the superconductor is expected to decay exponentially with the distance x from the interface Bergeret . Then, the corresponding local field on a nucleus is
| (1) |
where =0 corresponds to the position of the F/S interface Bergeret . The local field distribution,
| (2) |
has to be convoluted with the unperturbed NMR Gaussian line shape derived by fitting of the normal-state NMR line.
The result of a numerical simulation of the NMR line shape in a superconducting film with a finite spin polarization penetrating from the edges is shown in Fig. 3. The line clearly exhibits a broadened high-field wing, strikingly similar to the experimental spectra observed for PdFe/V/PdFe and Ni/V/Ni trilayers in Fig. 2. The low-field side of the resonance line is mainly determined by the V nuclei in the middle of the V-layer, and the shape remains essentially unaffected by the spin polarization. The high-field side, however, is modified, since here the V nuclei from the region close to the S/F interfaces sensing a local field from the spin polarization contribute to the NMR signal. The degree of distortion of the high-field wing of the NMR resonance line should scale with the amplitude of the spin polarization This trend is clearly present in the sequence of the experimental spectra from Fig. 2c-e. We did not superimpose the calculated lineshape on the experimental curves, because we do not have a realistic quantitative estimate for the conduction electron spin polarization (and consequently the parameter in formula (1)).
In summary, the character of the NMR line distortion and the systematic increase of the distortion with the strength of the ferromagnet below the superconducting transition temperature in the F/S/F trilayers leads us to the conclusion that we have observed a manifestation of ferromagnetism penetrating into the superconductor, i.e. the novel mechanism coined the inverse proximity effect in Refs. Bergeret and Kharitonov .
We are grateful to Professor Konstantin B. Efetov and Anatoly F. Volkov for stimulating this study. This work was supported by the Deutsche Forschungsgemeinschaft within the SFB 491 and by the Russian Foundation for Basic Research (project nos. 08-02-00098 (experiment) and 07-02-00963(theory)).
References
- (1) A. I. Buzdin, Rev. Mod. Phys. 77, 945 (2005).
- (2) K. B. Efetov, I. A. Garifullin, A. F. Volkov and K. Westerholt, Magnetic Heterostructures. Advances and Perspectives in Spinstructures and Spintransport. Series Springer Tracts in Modern Physics, Vol. 227. Zabel H., Bader S. D. (Eds.), (2007), P. 252.
- (3) F. S. Bergeret, A. F. Volkov, and K. B. Efetov, Europhys. Lett. 66, 111 (2004); Phys. Rev. B 69, 174504 (2004); Rev. Mod. Phys. 77, 1321 (2005).
- (4) M. Yu. Kharitonov, A. F. Volkov, and K. B. Efetov, Phys. Rev. B 73, 054511 (2006).
- (5) J. R. Schrieffer, Theory of superconductivity, (New York: W. A. Benjamin, 1964).
- (6) D. E. MacLaughlin, Solid State Physics, edited by F. Seitz and D. Turnbull (Academic Press, Inc., New York, 1976), Vol. 31, p. 1.
- (7) P. Isberg, B. Hjörvarsson, R. Wräppling et al. Vacuum 48, 483 (1997).
- (8) I. A. Garifullin, D. A. Tikhonov, N. N. Garif’yanov et al., Phys. Rev. B 66, 020505 (2002).
- (9) I. A. Garifullin, N. N. Garif’yanov, R. I. Salikhov, and L. R. Tagirov, Pis’ma v Zh. Eksp. Teor. Fiz. 87, 367 (2008) [JETP Lett. 87, 317 (2008)].
- (10) D. Rossier and D. E. MacLaughlin, Phys. Kondens. Materie 11, 66 (1970).
- (11) B. J. Noer and W. D. Knight, Rev. Mod. Phys. 36, 177 (1964).
- (12) The resonace field should be smaller than the critical field of superconductor.
- (13) K. J. Wilson and C. P. G. Valabhan, Meas. Sci. Technol. 1, 458 (1990).
- (14) J.A. Mydosh, J.I. Budnick, M.P. Kawatra, and S. Skalski, Phys. Rev. Lett. 21, 1346 (1968)
- (15) L. C. Parratt, Phys. Rev. 95, 359 (1954).
- (16) L. Nevot and P. Croce, Rev. Phys. Appl. 15, 761 (1980).
- (17) L. Lazar, K. Westerholt, H. Zabel et al., Phys. Rev. B 61, 3711 (2000).
- (18) A. B. Pippard, Rep. Prog. Phys. 23, 176 (1960).
- (19) J. -M. Delriew, Solid State Commun. 8, 61 (1970).
- (20) L. Dobrosavljevic, C. R. Acad. Sci. Paris 263, 502 (1966).
TABLE 1. Experimental parameters of the studied samples. Given are the thickness of the V layer , the roughness parameter Rough obtained from the fit of the small angle x-ray reflectivity, the superconducting transition temperature , the residual resistivity ratio , the electron mean free path in the V layer , and the superconducting coherence length . The thickness of the magnetic layers is about 3 nm for all trilayer samples.
| Sample | Rough | ||||||
|---|---|---|---|---|---|---|---|
| (nm) | (nm) | (K) | (nm) | (nm) | |||
| V | 30 | 0.3 | 4.65 | 11 | 15 | 14 | |
|
Pd0.98Fe0.02/V/
Pd0.98Fe0.02 |
36 | 1.3 | 3.02 | 4.6 | 5 | 8 | |
|
Pd0.97Fe0.03/V/
Pd0.97Fe0.03 |
42 | 1.3 | 3.55 | 6 | 7 | 10 | |
| Ni/V/Ni | 44 | 1.6 | 4.05 | 4.4 | 5 | 8 |