Beam-Energy and System-Size Dependence of Dynamical Net Charge Fluctuations
Abstract
We present measurements of net charge fluctuations in collisions at 19.6, 62.4, 130, and 200 GeV, collisions at 62.4, 200 GeV, and collisions at 200 GeV using the net charge dynamical fluctuations measure . The dynamical fluctuations are non-zero at all energies and exhibit a rather modest dependence on beam energy. We find that at a given energy and collision system, net charge dynamical fluctuations violate scaling, but display approximate scaling. We observe strong dependence of dynamical fluctuations on the azimuthal angular range and pseudorapidity widths.
1 Introduction
Anomalous transverse momentum and net charge event-by-event fluctuations have been proposed as indicators of the formation of a quark gluon plasma (QGP) in the midst of high-energy heavy ion collisions. Entropy conserving hadronization of a plasma of quarks and gluons could produce a final state characterized by a dramatic reduction of the net charge fluctuations relative to that of a hadron gas JeonKoch00 . Measurements of net charge fluctuations were reported by both PHENIX AdcoxPRC89 and STAR Adams03c collaborations on the basis of data acquired during the first RHIC run at 130 GeV. In this work, we report a systematic study of the net charge fluctuations as a function of the system size and their energy using fluctuation measure, defined as follows:
| (1) |
where are the number of positively and negatively charged particles in the acceptance of interest. We present measurements of dynamical net charge fluctuations in collisions at 19.6, 62.4, 130, and 200 GeV, collisions at 62.4, 200 GeV and in collisions at 200 GeV. We study the beam energy, system size and collision centrality dependencies quantitatively in order to identify possible signature of the formation of a QGP.
2 Experimental Method
The data used in this analysis were measured using the Solenoidal Tracker at RHIC (STAR) detector during the 2001, 2002, 2004 and 2005 data RHIC runs at Brookhaven National Laboratory. The collisions at 62.4, 130, and 200 GeV data and collisions at 62.4 and 200 GeV were acquired with minimum bias triggers. For 19.6 GeV data, a combination of minimum bias and central triggers was used. Technical descriptions of the STAR detector and its components are published in technical reports Star03 .
This analysis used tracks from the TPC with transverse momentum in the range GeV/c with pseudorapidity . The centrality bins were calculated as a fraction of this multiplicity distribution starting at the highest multiplicities. The ranges used were 0-5% (most central collisions), 5-10%, 10-20%, 20-30%, 30-40%, 40-50%, 50-60%, 60-70%, and 70-80% (most peripheral) for collisions. Similarly, collision centrality slices used in collisions are 0-10% (most central), 10-20%, 20-30%, 30-40%, 40-50% and 50-60% (most peripheral). Each centrality bin is associated with an average number of participating nucleons, , using Glauber Monte Carlo calculation StarGlauber03 .
3 Net Charge Fluctuation Results
We present, in Fig. 1, measurements of the dynamical net charge fluctuations, , as a function of collision centrality in collisions at 19.6, 62.4, 130, and 200 GeV, collisions at 62.4 and 200 GeV.
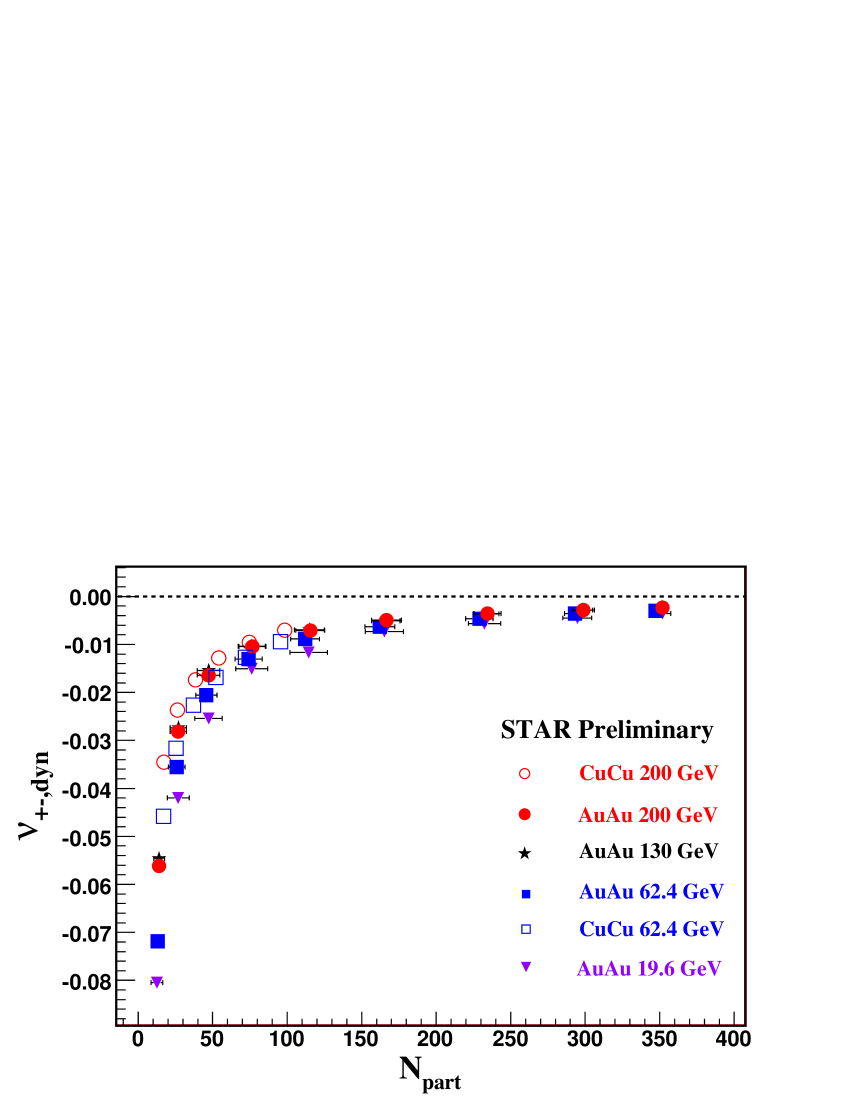
The dynamical net charge fluctuations, in general, exhibit a monotonic dependence on the number of participating nucleons. At a given number of participants the measured fluctuations also exhibit a modest dependence on beam energy, with magnitude being the largest in collisions at 19.6 GeV. The values measured for collisions at 200 GeV amounts to -0.230 0.019(stat). Dependence on the number of participating nucleons can be seen in Fig. 2(b), discussed in Section III A.
3.1 Collision Centrality Dependence
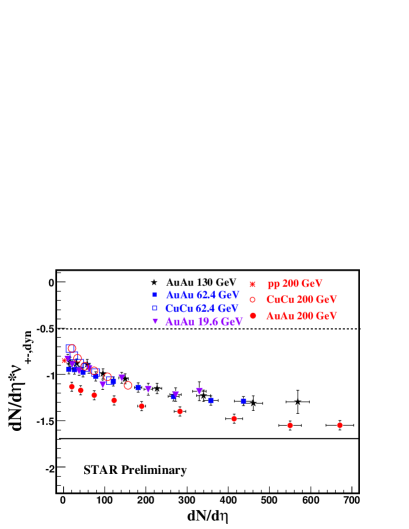
Fig. 2(a) shows the dynamical fluctuations scaled by the measured particle multiplicity density in pseudorapidity space (). Data from and collisions are shown with solid and open symbols, respectively. Values of used for the scaling correspond to efficiency corrected charged particle multiplicities measured by STAR StardNdeta and PHOBOS Phobos01 . The magnitude of scaled by for 200 GeV data is significantly different from the results of other systems and energies. The observed increases with the increase in collision centrality. The dashed line in the figure corresponds to charge conservation effect and the solid line to the prediction for a resonance gas. The data indicates that dynamical net charge fluctuations, scaled by for the most central collisions are qualitatively consistent with resonance gas prediction JeonKoch00 .
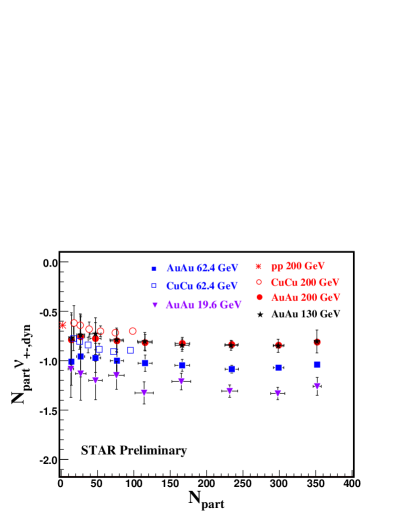
Fig. 2(b) presents the dynamical fluctuation scaled by the number of participants, as a function of the number of participants. The measured data scaled by the number of participants () are thus consistent with no or a very weak collision centrality dependence. However, a definite system size and energy dependence is observed. Vertical error bars represent statistical uncertainties.
3.2 Longitudinal and Azimuthal Dependencies of the Dynamical Fluctuations
We plot in Fig. 4 values of measured for different ranges of pseudorapidity, , normalized by the magnitude of for a pseudorapidity range () to enable comparison of different centralities, beam energies and system size. The magnitude of the normalized correlation is maximum for the smallest pseudorapidity ranges and decreases monotonically to unity, at all energies and centralities, with increasing pseudorapidity range. This shows that the collision dynamics in collisions, 0-10% and 0-5% collisions are significantly different. Indeed, we find the relative magnitude of the correlations measured for increases by nearly 25% for 200 GeV relative to those in . Note in particular that the slope () in , and systems depends on the correlation length (in pseudorapidity): the shorter the correlation, the larger the slope. The observed distributions then indicate that the correlation length is shorter for central collisions and for larger systems, in agreement with the observed reduction of the charge balance function StarBalanceFct .
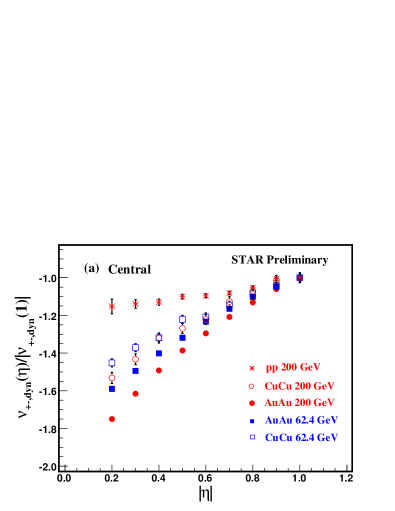
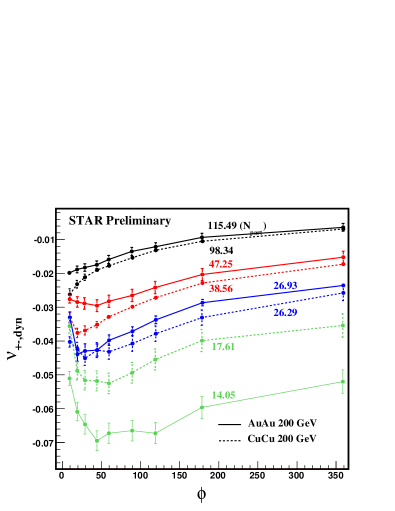
Fig. 4 displays measured values of as a function of azimuthal angle ranges from 10 to 360 degrees for and collisions at 200 GeV. and collisions are compared at similar number of participating nucleons. One observes that the magnitude of with respect to azimuthal angle, , is similar for similar number of participating nucleons in both systems with best agreement for collisions with more than 20 participants.
4 Summary and Conclusions
We have presented measurements of dynamical net charge
fluctuations in collisions at 19.6,
62.4, 130, 200 GeV, collisions at
62.4, 200 GeV and collisions at 200 GeV,
using the measure . The fluctuations are non
vanishing at all energies and exhibit a rather modest dependence
on beam energy in the range 19.6 200 GeV
for as well as collisions. Net charge
dynamical fluctuations violate the trivial scaling
expected for nuclear collisions consisting of independent
nucleon-nucleon interactions. Scaled dynamical net charge
fluctuations grow by up to 40%
from peripheral to central collisions. This centrality dependence
may arise, in part due to the large radial collective flow
produced in collisions. We also studied fluctuations as
a function of azimuthal angle and pseudorapidity and found that
dynamical fluctuations exhibit a strong dependence on rapidity and
azimuthal angular ranges which could be
attributed in part to radial flow effects.
References
- (1) S. Jeon and V. Koch, Phys. Rev. Lett. 85, 2076 (2000); H. Heiselberg and A. D. Jackson, Phys. Rev. C63, 064904 (2001); M. Asakawa, U. Heinz, B. Mueller, Phys. Rev. Lett. 85, 2072 (2000).
- (2) K. Adcox et al. (PHENIX Collaboration), Phys. Rev. Lett. 89, 082301 (2002).
- (3) J. Adams et al. (STAR Collaboration), Phys. Rev. C68, 044905 (2003).
- (4) M. Anderson et al., Nucl. Instrum. Meth. A499, 624 (2003); Nucl. Instrum. Meth. A499, 659 (2003).
- (5) J. Adams et al., (STAR Collaboration), [nucl-ex/0311017].
- (6) C. Adler et al., (STAR collaboration), Phys. Rev. Lett. 87, 112303 (2001).
- (7) B. B. Back et al., (PHOBOS Collaboration), Phys. Rev. Lett. 87, 102303 (2001); Phys. Rev. Lett. 88, 022302 (2002); Phys. Rev. C65, 061901R (2002); Phys. Rev. C70, 021902 (2004); Phys. Rev. Lett. 91, 052303 (2003); Phys. Rev. C74, 021901(R) (2006); [nucl-ex/0601026].
- (8) J. Adams et al., (STAR Collaboration), Phys. Rev. Lett. 90, 172301 (2003).