Centimeter Imaging of the R Coronae Australis Region
Abstract
The R CrA region was observed in the 3.5 and 6.2 cm continuum with high angular resolutions (0.6–1.7 arcseconds) using the Very Large Array. Archival data sets were also analyzed for comparison, which provided angular resolutions up to 0.3 arcseconds. A cluster of young stellar objects was detected, and a rich array of star forming activities was revealed. IRS 7A showed an enhanced outflow activity recently. The main peak of IRS 7A positionally coincides with an X-ray source, which suggests that the X-ray emission is directly related to the central protostar. The Class 0 source SMA 2 is associated with a double radio source, B 9a and 9b, and seems to be driving two outflows. The B 9 complex is probably a multiple-protostar system. Both B 9a and 9b are nonthermal radio sources with negative spectral indices. IRS 7B is a compact radio source surrounded by an extended structure. The compact source corresponds to the Class 0/I source SMA 1, and it is also closely associated with an X-ray source, suggesting that magnetic activities start early in the protostellar stage of evolution. The extended structure of IRS 7B may be a bipolar outflow. IRS 5 was resolved into two sources with a separation of 0.9 arcseconds. Both IRS 5a and 5b display radio flares and X-ray emission, suggesting that energetic magnetic processes are active in both members. The month-scale active phase of IRS 5b implies that the flare activity must involve large-scale magnetic fields. During the strong flare event of IRS 5b in 1998, IRS 5a also showed an enhanced level of radio emission. This concurrent activity suggests that IRS 5 may be an interacting young binary system, but the interaction mechanism is unknown. Alternatively, what was seen in the radio images could be a circumbinary halo. The variable radio source B 5 was found to be a nonthermal source at times, and the size of the 6.2 cm source is about 1 arcsecond, suggesting that B 5 is a Galactic object. A radio outburst of IRS 6 was detected once, and the radio/X-ray source was identified as IRS 6a. The other member of the IRS 6 system, IRS 6b, was undetected in X-rays, suggesting that only IRS 6a has detectable magnetic activities. Properties of other radio sources, IRS 1, IRS 2, and R CrA, are discussed, and the radio detections of T CrA and WMB 55 are reported. The proper motion of R CrA was marginally detected. Also presented is the classification of infrared sources in the R CrA region based on an infrared color-color diagram.
1 INTRODUCTION
The Corona Australis molecular cloud is one of the nearest star-forming regions, and the R CrA region is the most active site of star formation in this cloud (Harju et al. 1993; Chini et al. 2003). The R CrA cloud core contains a cluster of young stellar objects known as the “Coronet” cluster (Taylor & Storey 1984; Wilking et al. 1992, 1997). Deeply embedded protostars and preprotostellar cores were detected in the (sub)millimeter continuum (Henning et al. 1994; Choi & Tatematsu 2004; Nutter et al. 2005; Groppi et al. 2004, 2007). Star forming activities, such as infall, accretion, molecular outflows, and Herbig-Haro objects, were revealed by millimeter spectroscopic observations and optical imaging (Strom et al. 1974; Hartigan & Graham 1987; Anderson et al. 1997; Groppi et al. 2004, 2007; Nisini et al. 2005; Wang et al. 2004). Centimeter continuum imaging with interferometers has been especially effective in probing the nature of the deeply embedded objects and determining their precise positions (Brown 1987; Suters et al. 1996; Feigelson et al. 1998; Forbrich et al. 2006; Miettinen et al. 2008). High-energy processes around some of the young stellar objects were discovered in X-ray observations (Koyama et al. 1996; Hamaguchi et al. 2005, 2008; Forbrich et al. 2006, 2007; Forbrich & Preibisch 2007). The distance to the CrA molecular cloud is 170 pc (Knude & Høg 1998).
Among the near-IR sources discovered by Taylor & Storey (1984) in the R CrA cloud core, IRS 7 is the most deeply embedded and probably the youngest object. In the centimeter continuum imaging by Brown (1987), IRS 7 was resolved into three radio sources: IRS 7A, IRS 7B, and B 9. Single-dish observations of submillimeter continuum emission suggested that they are deeply embedded objects (Nutter et al. 2005). Several radio continuum sources were detected around IRS 7A (Choi & Tatematsu 2004; Forbrich et al. 2006), suggesting that this small region contains a multiple-protostar system. The IRS 7A region is interesting because it appears to contain objects with inhomogeneous spectral classes or in different stages of evolution (Choi & Tatematsu 2004). While IRS 7A appears to be a Class I protostar as it was detected in near-IR, the other members of the multiple system (CT 3 and B 9) were suggested to be probable Class 0 protostars. Recent interferometric observations in the millimeter continuum confirmed that B 9 (SMA 2) is a Class 0 source while IRS 7A and CT 3 were undetected (Groppi et al. 2007).
| Synthesized Beam | ||||||||
|---|---|---|---|---|---|---|---|---|
| Frequency | Natural weight | Uniform weight | Array | |||||
| Track | Date | (GHz) | Size | P.A. | Size | P.A. | Configuration | |
| Tr 1 | 1996. 12. 29. | 4.9 | 1.21 0.50 | 6.5 | 0.86 0.35 | 7.1 | A | |
| 8.5 | 0.70 0.31 | 2.5 | 0.51 0.20 | 0.1 | A | |||
| Tr 2 | 1997. 01. 19. | 8.5 | 0.82 0.59 | 10.6 | 0.57 0.20 | 0.8 | BnA | |
| Tr 3 | 1997. 01. 20. | 8.5 | 1.04 0.89 | 10.4 | 0.84 0.22 | 10.6 | BnA | |
| Tr 4 | 1998. 06. 27. | 8.5 | 1.13 0.69 | 23.8 | 0.82 0.52 | 41.0 | BnA | |
| Tr 5 | 1998. 07. 19. | 8.5 | 2.61 0.78 | 1.9 | 2.38 0.54 | 0.8 | B | |
| Tr 6 | 1998. 09. 07. | 8.5 | 2.61 0.78 | 5.4 | 2.37 0.54 | 4.7 | B | |
| Tr 7 | 1998. 09. 19. | 8.5 | 2.54 0.80 | 0.0 | 2.30 0.53 | 0.4 | B | |
| Tr 8 | 1998. 09. 27. | 8.5 | 2.71 0.79 | 11.6 | 2.43 0.52 | 11.8 | B | |
| Tr 9 | 1998. 10. 02. | 8.5 | 2.58 0.79 | 5.4 | 2.25 0.54 | 4.6 | B | |
| Tr 10 | 1998. 10. 06. | 8.5 | 2.65 0.79 | 6.6 | 2.43 0.54 | 5.2 | B | |
| Tr 11 | 1998. 10. 10. | 8.5 | 2.54 0.79 | 0.1 | 2.30 0.53 | 0.4 | B | |
| Tr 12 | 1998. 10. 13. | 8.5 | 2.60 0.80 | 5.6 | 2.25 0.54 | 4.6 | B | |
| Tr 13 | 2005. 02. 03. | 8.5 | 1.01 0.74 | 23.4 | 0.73 0.54 | 33.9 | BnA | |
| Tr 14 | 2005. 02. 12. | 4.9 | 2.10 1.35 | 9.9 | 1.45 1.02 | 14.7 | BnA | |
Note. — Units of beam size and P.A. are arcseconds and degrees, respectively. Tracks Tr 2–3 correspond to the observing runs presented by Feigelson et al. 1998. Tracks Tr 4–12 correspond to epochs R1–9 in Table 1 of Forbrich et al. 2006.
IRS 7B attracted attention because it is a rare example of Class 0 protostars showing X-ray emission (Feigelson & Montmerle 1999; Hamaguchi et al. 2005). Recent interferometric observations in the millimeter continuum suggested that IRS 7B (SMA 1) may be a Class 0/I transitional object (Groppi et al. 2007). Hamaguchi et al. (2005) demonstrated that the X-ray emission from IRS 7B comes from two different components: one hot and variable, and the other cool and constant. The cool component was interpreted as originating from collisional shock of the protostellar jet with circumstellar gas, and such X-ray emission has been found around several Class 0/I protostars, for example, HH 2, L1551 IRS 5, and OMC 3 MMS 2 (Pravdo et al. 2001; Favata et al. 2002; Bally et al. 2003; Tsujimoto et al. 2004). The hot variable X-ray emission had not been detected from other Class 0 protostars. This component would be related to the reconnection of magnetic fields around the protostar during mass accretion (e.g., Montmerle et al. 2000). Spatially separating the jet collision region from the central protostar with a high resolution imaging is therefore important in understanding the structure of the protostellar system.
IRS 5 is an interesting young binary system. It was spatially resolved in the near-IR and X-ray images (Nisini et al. 2005; Hamaguchi et al. 2008). Both members of the system show quiescent X-ray emission, but flare activities of them were remarkably different: only IRS 5a frequently showed solar type X-ray flares (Hamaguchi et al. 2008). IRS 5 also displays radio outbursts and emits circularly polarized radio emission (Suters et al. 1996; Feigelson et al. 1998; Forbrich et al. 2006; Miettinen et al. 2008). However, the radio properties of each binary member need to be characterized separately to understand the radio activities.
The R CrA region also contains other radio sources displaying interesting star-formation activities of their own. IRS 1 and IRS 2 are Class I protostars and variable X-ray sources (Forbrich et al. 2006). IRS 1 is the driving source of the HH 100 outflow (Strom et al. 1974). WMB 55 is a Class I source without an X-ray detection (Wilking et al. 1997; Nutter et al. 2005). IRS 6 is probably an X-ray emitting T Tauri star driving a giant Herbig-Haro flow (Wang et al. 2004; Forbrich et al. 2006). R CrA and T CrA are Herbig Ae/Be stars, and each of them may be a binary system (Takami et al. 2003). B 5 is a radio source of unknown nature, and its flux varies rapidly (Brown 1987; Suters et al. 1996; Feigelson et al. 1998).
To obtain high-quality images of the young stellar objects despite the low declination, we observed the R CrA region with the Very Large Array (VLA) using a fast-switching phase calibration technique. In this paper, we present our centimeter continuum observations of the R CrA region. We describe our radio continuum observations in § 2 and archival data in § 3. In § 4 we briefly report the results of the continuum imaging. In § 5 we discuss the star forming activities of the radio sources in the R CrA region. A summary is given in § 6.
2 OBSERVATIONS
The R CrA IRS 7 region was observed using VLA of the National Radio Astronomy Observatory (NRAO) in the standard -band continuum mode (8.5 GHz or = 3.5 cm) and in the standard -band continuum mode (4.9 GHz or = 6.2 cm). Twenty-three antennas were used in the BnA-array configuration on 2005 February 3 for the 3.5 cm observations and on 2005 February 12 for the 6.2 cm observations (Tr 13/14 in Table 1). The phase-tracking center was = 19h01m55.33s, = –36°57′21.66′′. The phase was determined by observing the nearby quasar 1924–292 (QSO B1921–293). The target-calibrator cycle was 4 and 5 minutes for the 3.5 and 6.2 cm observations, respectively. In the 3.5 cm observations, the flux was calibrated by setting the flux density of 1924–292 to 13.7 Jy, which is the flux density measured within 16 days of our observations (VLA Calibrator Flux Density Database666See http://aips2.nrao.edu/vla/calflux.html.). To check the flux scale, the quasar 1331+305 (4C 30.26) was observed in the same track. Comparison of the amplitude gave a flux density of 5.30 Jy for 1331+305, which agrees with the value in the VLA Calibrator Flux Density Database to within 3%. In the 6.2 cm observations, the flux was calibrated by setting the flux density of 1331+305 to 8.25 Jy, which is the flux density measured within 2 days of our observations according to the VLA Calibrator Flux Density Database. Comparison of the amplitude gave a flux density of 13.52 Jy for 1924–292. Because of the short cycle time, the quality of phase calibration was good. We tried a self-calibration, but it did not make a noticeable difference in the quality of resulting images. Therefore, the Tr 13/14 images presented in this paper were made without self-calibration. Maps were made using a CLEAN algorithm.
3 ARCHIVAL DATA
In addition to our data, we also analyzed several VLA data sets retrieved from the NRAO Data Archive System. We searched for 3.5/6.2 cm continuum observations of the R CrA region made in the A-, BnA-, or B-array configuration and found four observing projects in recent years. Including our observations, we present the results of 14 observing runs. A summary of the observing runs is given in Table 1. The archival VLA data were obtained from observations with a typical target-calibrator cycle time of 10–15 minutes. To improve the phase calibration we used the phase-only self-calibration technique (see Forbrich et al. 2006). The Tr 1–12 images presented in this paper were made with the self-calibration applied.
3.1 Project AB 807
The NRAO observing project AB 807 includes a single observing run (Tr 1). The data set contains data from the observations of the R CrA IRS 7 region in the standard -band continuum mode and in the standard -band continuum mode in a single track. Twenty-five antennas were used in the A-array configuration. The phase-tracking center was = 18h58m33.0s, = –37°01′41.0′′. The phase calibrators were the quasars QSO B1921–293 and QSO B1933–400, and the flux calibrator was the quasar 3C48. The bootstraped flux densities were 17.4 Jy for QSO B1921–293 and 0.96 Jy for QSO B1933–400 in the -band and 16.2 Jy for QSO B1921–293 and 0.98 Jy for QSO B1933–400 in the -band.
3.2 Project AC 481
The NRAO observing project AC 481 includes two observing runs (Tr 2 and 3). Details of the observations and results were presented by Feigelson et al. (1998). The flux densities of sources in the images produced by us agree well with the values reported by Feigelson et al. (1998). However, the positions of compact sources have an offset compared with those found in the images of the other data sets. The amount of the position offset is 0.1′′ to the east and 0.4′′ to the north. A probable cause of this offset is that the phase calibrator used in the project AC 481 was 1744–312. In the other projects the phase calibrator was 1924–292, as in our observations. The position accuracy of 1744–312 is worse than that of 1924–292: 1744-312 is a code-C calibrator while 1924–292 is a code-A calibrator. The angular distance from the target source is also larger: 17.5° for 1744–312 and 9.2° for 1924–292. Therefore, we conclude that the astrometry of the AC 481 images is less reliable than that of the other images. In all the figures presented in this paper, a position correction was applied to the AC 481 images.
3.3 Projects AK 469 and AM 596
The NRAO observing projects AK 469 and AM 596 include nine observing runs (Tr 4–12). Details of the observations and results were presented by Forbrich et al. (2006). The flux densities and positions of compact sources in the images produced by us agree well with the values reported by Forbrich et al. (2006).
3.4 Spitzer Data
In addition to the radio data, we analyzed archival infrared data to classify the young stellar objects in the R CrA region. From the Spitzer data archive, GTO observations for the R CrA region (AOR keys: IRAC 3650816 and MIPS 3664640) were retrieved. The aperture photometry was performed with mosaic post-BCD images, which were processed by the SSC pipeline (Ver. S14 and S16 for IRAC and MIPS, respectively), at all IRAC bands (3.6, 4.5, 5.8, and 9.0 m) and MIPS 24 and 70 m using the SSC Mopex package. The short-exposure high-dynamic range observations were used for the IRAC photometry.
4 RESULTS
| Peak PositionaaFor most sources, the positions are from the natural-weight 3.5 cm continuum map of Tr 1. For source 1 (IRS 2), the position is from the 6.2 cm map of Tr 1. For source 5 (IRS 6), the position is from the 3.5 cm map of Tr 12. For sources 8, 12, and 15 (FPM 10, FPM 13, and WMB 55), the positions are from the 3.5 cm map of Tr 13. For source 13, the position is from the 6.2 cm map of Tr 14. | |||
|---|---|---|---|
| Source | Associated ObjectsbbSource numbers from IRS: Taylor & Storey 1984, B: Brown 1987, WMB: Wilking et al. 1997, FCW: Feigelson et al. 1998, CT: Choi & Tatematsu 2004, SMM: Nutter et al. 2005 and Groppi et al. 2007, FPM: Forbrich et al. 2006, and SMA/IRAC: Groppi et al. 2007. | ||
| 1 | 19 01 41.58 | –36 58 31.0 | IRS 2, FCW 1, SMM 5 |
| 2 | 19 01 43.27 | –36 59 12.3 | B 5 |
| 3 | 19 01 48.02 | –36 57 22.5 | IRS 5a, B 7, SMM 4, IRAC 10 |
| 4 | 19 01 48.06 | –36 57 21.8 | IRS 5b, B 7, SMM 4 |
| 5 | 19 01 50.46 | –36 56 37.6 | IRS 6, FPM 6, IRAC 8 |
| 6 | 19 01 50.67 | –36 58 09.7 | IRS 1, B 8, SMM 3, IRAC 7 |
| 7 | 19 01 53.68 | –36 57 08.2 | R CrA, FCW 5, IRAC 6 |
| 8 | 19 01 55.04 | –36 57 16.6 | FPM 10 |
| 9 | 19 01 55.26 | –36 57 16.9 | B 9, CT 2, SMM 1C, SMA 2 |
| 10 | 19 01 55.30 | –36 57 16.7 | B 9, CT 2, SMM 1C, SMA 2 |
| 11 | 19 01 55.32 | –36 57 22.1 | IRS 7A, CT 4, IRAC 5 |
| 12 | 19 01 55.34 | –36 57 12.9 | FPM 13 |
| 13 | 19 01 55.61 | –36 57 43.4 | SMM 1A |
| 14 | 19 01 56.41 | –36 57 28.1 | IRS 7B, SMM 1B, SMA 1, IRAC 4 |
| 15 | 19 01 58.55 | –36 57 08.5 | WMB 55, SMM 2, IRAC 3 |
| 16 | 19 01 58.78 | –36 57 49.9 | T CrA, IRAC 1 |
Note. — Units of right ascension are hours, minutes, and seconds, and units of declination are degrees, arcminutes, and arcseconds.
Table 2 lists all the 16 sources detected in the radio maps. Figure 1 shows the average map of the R CrA region in the 3.5 cm continuum from all the data sets, and Figure 1 shows the maps of the IRS 7 region from our observations. All the images presented in this paper are corrected for the primary beam response, and the lowest contour level roughly corresponds to the 3 value, where is the rms of noise. Objects associated with the centimeter continuum sources are marked in the figures, and the size of markers roughly corresponds to the position uncertainty of the objects. Tables 2 and 3 list the parameters of detected sources, and Figure 2 shows the flux variability of bright sources. We briefly summarize the overall properties of detected sources in this section, and detailed discussion on individual sources will be given in § 5.
The IRS 7 region shows a complex of several compact sources and some extended emission structures. Since there are several published papers reporting the centimeter continuum sources in this region (many of them have their own list of sources), simply using source numbers can be confusing. In this paper, the source names listed in Table 3 are used. We tried to list the most commonly used names. In some cases, for example, a name may be a combination of an acronym (names of authors who identified the source first) and a sequence (source number) used by those authors.
4.1 Source Structure
IRS 7A is the strongest centimeter-continuum source in this region and is composed of a compact source and an extended emission structure. B 9 is associated with the 7 mm source CT 2 and the 1.1 mm source SMA 2 and is probably the most deeply embedded source in this region. B 9 was resolved into two compact sources. FPM 10 and FPM 13 are extended emission structures, and their shapes and peak positions change depending on the coverage and the epoch of observations.
IRS 7B is also composed of a compact source surrounded by an extended emission structure. The compact source is associated with the 1.1 mm source SMA 1. The extended structure clearly has a bipolar morphology elongated in the northeast-southwest direction. The northeastern lobe corresponds to FPM 15 (Forbrich et al. 2006) and shows a clumpy structure.
IRS 5 was resolved into two compact sources, and they displayed interesting flux variability. B 5 is slightly extended in the northeast-southwest direction, and the deconvolved size along the elongation is 1′′. Most of the other detected sources in the R CrA field are point-like objects.
4.2 Spectral Energy Distribution
Table 3 lists , the spectral index in the centimeter band. For most sources, the spectral index is consistent with the value expected for the free-free emission from collimated thermal radio jets or coronal winds (; Reynolds 1986; Anglada et al. 1998). However, there are a few exceptions. The spectral index of B 9 is negative in both Tr 1 and Tr 13/14 estimates, suggesting that the centimeter emission is from a nonthermal process at least partially. The spectral index of IRS 7B needs some discussion (see § 5.2). The spectral index of B 5 varies wildly, which is probably due to a combined effect of nonthermal emission processes and flare activities (see § 5.4).
It should be noted that, even though the spectral index of IRS 5 is consistent with free-free emission, its circularly polarized flux certainly tells that it has a nonthermal emission component. There are other examples of nonthermal emitter with a slightly positive spectral index, such as T Tau Sb (Loinard et al. 2007). These sources suggest that the spectral index alone is not a very reliable indicator of emission process. On the other hand, in radio surveys of star forming clouds, sources displaying negative spectral indices are usually considered background nonthermal sources (e.g., Rodríguez et al. 1999), but the existence of young stellar objects such as B 9 tells that the spectral index alone is not a good criterion for distinguishing young stellar objects from extragalactic objects.
4.3 Long-Term Variability
Figure 2 shows long-term (8–13 years) variability of the 3.5 cm flux density. Considering the month-scale variability, most sources do not show clear trends. IRS 7A seems to show a steady increase of flux density. More observations are needed to confirm this trend. If real, such long-term variability is likely due to changes in outflow activity rather than circumstellar magnetic activities.
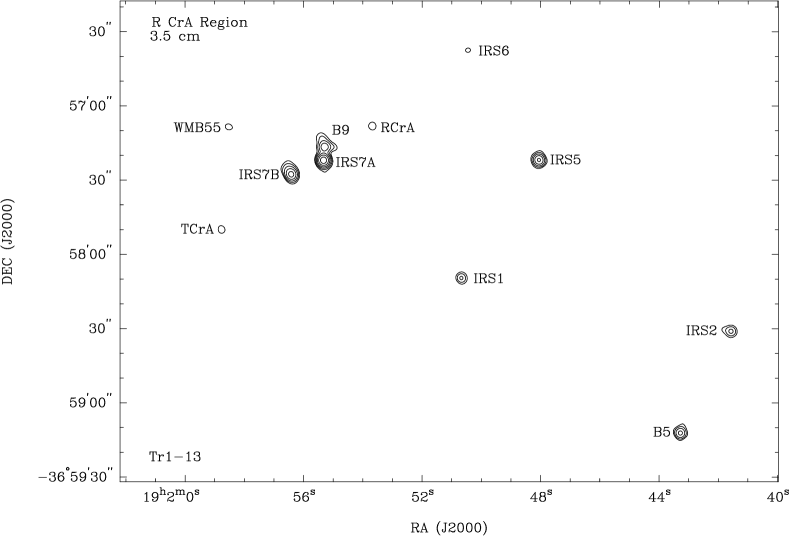 Fig. 1a
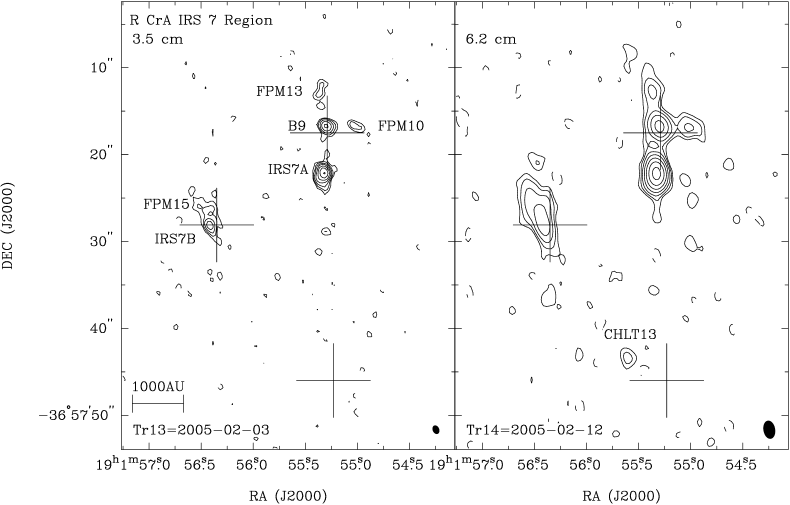 Fig. 1b
| (6.2 cm) | (3.5 cm) | |||||||
|---|---|---|---|---|---|---|---|---|
| Source | Name | Peak | Total | Peak | Total | aaSpectral index between 6.2 cm and 3.5 cm. In 1996 December, the 6.2 cm and the 3.5 cm observations were made in a single track. In 2005 February, the 6.2 cm observations were made 9 days after the 3.5 cm observations, and the spectral index of rapidly varying sources should be interpreted with caution. | ||
| Tr 1: 1996 December | ||||||||
| 1 | IRS 2bbIRS 2 is located outside the field of view of the 3.5 cm maps. | 0.15 0.03 | 0.25 0.04 | |||||
| 2 | B 5 | 0.46 0.03 | 1.06 0.11 | 0.42 0.04 | 0.51 0.07 | 1.3 | 0.3 | |
| 3 | IRS 5accIRS 5a and 5b were not clearly separated in the 6.2 cm maps. | 0.11 0.02 | 0.12 0.02 | |||||
| 4 | IRS 5bccIRS 5a and 5b were not clearly separated in the 6.2 cm maps. | 0.17 0.02 | 0.25 0.02 | |||||
| 3+4 | IRS 5ccIRS 5a and 5b were not clearly separated in the 6.2 cm maps. | 0.22 0.02 | 0.43 0.03 | 0.35 0.07 | 0.4 | 0.4 | ||
| 5 | IRS 6 | |||||||
| 6 | IRS 1 | 0.16 0.02 | 0.16 0.02 | 0.22 0.02 | 0.26 0.03 | 0.9 | 0.3 | |
| 7 | R CrA | 0.10 0.02 | 0.11 0.04 | 0.19 0.02 | 0.19 0.02 | 1.0 | 0.7 | |
| 8 | FPM 10 | 0.08 0.02 | 0.11 0.02 | |||||
| 9 | B 9bd,ed,efootnotemark: | 0.39 0.03 | 0.32 0.03 | 0.15 0.02 | 0.19 0.04 | 0.9 | 0.4 | |
| 10 | B 9ad,ed,efootnotemark: | 0.40 0.03 | 1.09 0.03 | 0.49 0.02 | 0.90 0.04 | 0.35 | 0.09 | |
| 9+10 | B 9 | 1.33 0.03 | 1.09 0.04 | 0.36 | 0.08 | |||
| 11 | IRS 7A | 2.61 0.02 | 3.63 0.07 | 2.40 0.02 | 3.71 0.07 | 0.04 | 0.05 | |
| 12 | FPM 13 | 0.10 0.02 | 0.16 0.03 | 0.08 0.02 | 0.14 0.02 | 0.2 | 0.4 | |
| 13 | CHLT 13 | |||||||
| 14 | IRS 7B | 0.92 0.02 | 2.54 0.11 | 0.73 0.02 | 1.16 0.03 | 1.41 | 0.09 | |
| 15 | WMB 55 | |||||||
| 16 | T CrA | 0.13 0.02 | 0.13 0.02 | 0.10 0.02 | 0.10 0.02 | 0.5 | 0.5 | |
| Tr 13/14: 2005 February | ||||||||
| 1 | IRS 2bbIRS 2 is located outside the field of view of the 3.5 cm maps. | 0.17 0.03 | 0.17 0.03 | |||||
| 2 | B 5 | 1.06 0.03 | 1.21 0.04 | 1.78 0.05 | 2.18 0.14 | 1.06 | 0.13 | |
| 3 | IRS 5ac,ec,efootnotemark: | 0.16 0.03 | 0.16 0.03 | |||||
| 4 | IRS 5bc,ec,efootnotemark: | 0.41 0.03 | 0.41 0.03 | |||||
| 3+4 | IRS 5ccIRS 5a and 5b were not clearly separated in the 6.2 cm maps. | 0.58 0.02 | 0.77 0.03 | 0.77 0.05 | 0.00 | 0.14 | ||
| 5 | IRS 6 | |||||||
| 6 | IRS 1 | 0.27 0.02 | 0.30 0.04 | 0.46 0.02 | 0.50 0.05 | 0.9 | 0.3 | |
| 7 | R CrA | 0.15 0.02 | 0.15 0.02 | 0.28 0.02 | 0.28 0.02 | 1.1 | 0.3 | |
| 8 | FPM 10 | 0.27 0.02 | 0.42 0.03 | 0.19 0.02 | 0.30 0.04 | 0.6 | 0.3 | |
| 9+10 | B 9ffB 9a and 9b were not clearly separated in either the 6.2 cm or the 3.5 cm maps. | 1.27 0.02 | 1.76 0.07 | 1.14 0.02 | 1.56 0.04 | 0.22 | 0.09 | |
| 11 | IRS 7A | 5.08 0.02 | 6.24 0.08 | 4.22 0.02 | 6.09 0.06 | 0.04 | 0.03 | |
| 12 | FPM 13 | 0.31 0.02 | 0.47 0.04 | 0.16 0.02 | 0.52 0.06 | 0.2 | 0.3 | |
| 13 | CHLT 13 | 0.17 0.02 | 0.17 0.02 | |||||
| 14 | IRS 7B | 0.89 0.02 | 2.56 0.12 | 0.81 0.02 | 2.31 0.15 | 0.19 | 0.14 | |
| 15 | WMB 55 | 0.15 0.02 | 0.17 0.03 | |||||
| 16 | T CrA | 0.13 0.02 | 0.17 0.02 | |||||
Note. — Flux densities are corrected for the primary beam response, and the unit is mJy (beam-1). For most sources, the flux densities are from the natural-weight maps. In most cases, total flux of each source was measured in a box, typically a circumscribed rectangle of 2 contour.

4.4 Proper Motion
Proper motions of bright compact sources were measured by comparing the uniform-weight 3.5 cm maps of Tr 1 and Tr 13. Most sources did not show a detectable proper motion. R CrA is the only source showing a marginally detectable proper motion: 0.23′′ 0.11′′ toward the southeast over the 8.1 yr time-baseline, or (20, –21) mas yr-1, which is consistent with the proper motion of the R CrA association, (5.5, –27.0) mas yr-1 (Neuhäuser et al. 2000).
4.5 Polarimetry
Circularly polarized 3.5 cm emission was detected toward three sources while none of the radio sources showed detectable polarization in the 6.2 cm band. IRS 5b showed detectable polarization in most observing runs, but IRS 5a was never detected in the Stokes- flux maps. Polarized emission from IRS 7A and B 5 was detected once each. Details of the polarimetry results will be presented separately in Paper II (Choi et al. 2008).
4.6 Infrared Photometry
| Source | (3.6 m) | (4.5 m) | (5.8 m) | (8 m) | (24 m) | (70 m) |
|---|---|---|---|---|---|---|
| IRS 2 | 2.57 | 3.65 | 6.95 | 9.61 | 17.4 | 35.7 |
| IRS 6 | 0.099 | 0.162 | 0.21 | 0.23 | 0.44 | 4.7 |
Note. — Fluxes are from the Spitzer data, and the unit is Jy. Photometric uncertainties are 10%.

Since flux measurements and images based on Spitzer data are reported previously for many of the sources in the R CrA region (Groppi et al. 2007; Forbrich & Preibisch 2007), we report the photometry of IRS 2 and IRS 6 only (Table 4). The IRAC color-color diagram for the infrared sources in the R CrA region is shown in Figure 3.
For IRS 2 and IRS 6, the bolometric temperature and luminosity were calculated using the Spitzer data along with the Two Micron All Sky Survey (2MASS) data. Although IRS 2 has a greater bolometric luminosity than IRS 6 by a factor of 25, they have a similar bolometric temperature of 450 K, indicative of Class I sources (Chen et al. 1995). According to the [3.6]–[4.5] versus [5.8]–[8.0] color-color diagram (Allen et al. 2004; Lee et al. 2006), both IRS 2 and IRS 6 are also classified as embedded Class 0/I sources (Fig. 3).
5 DISCUSSION
5.1 IRS 7A Region
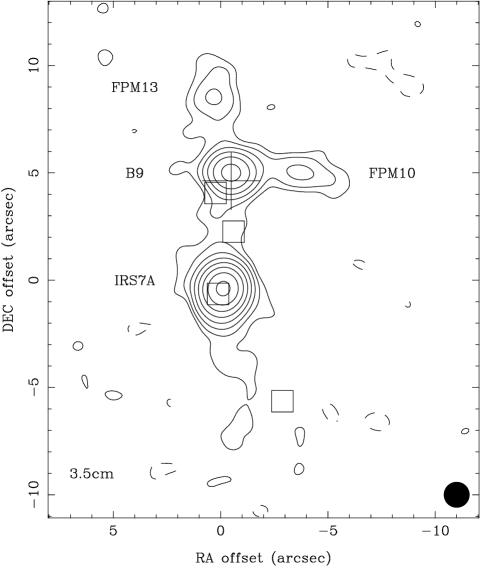
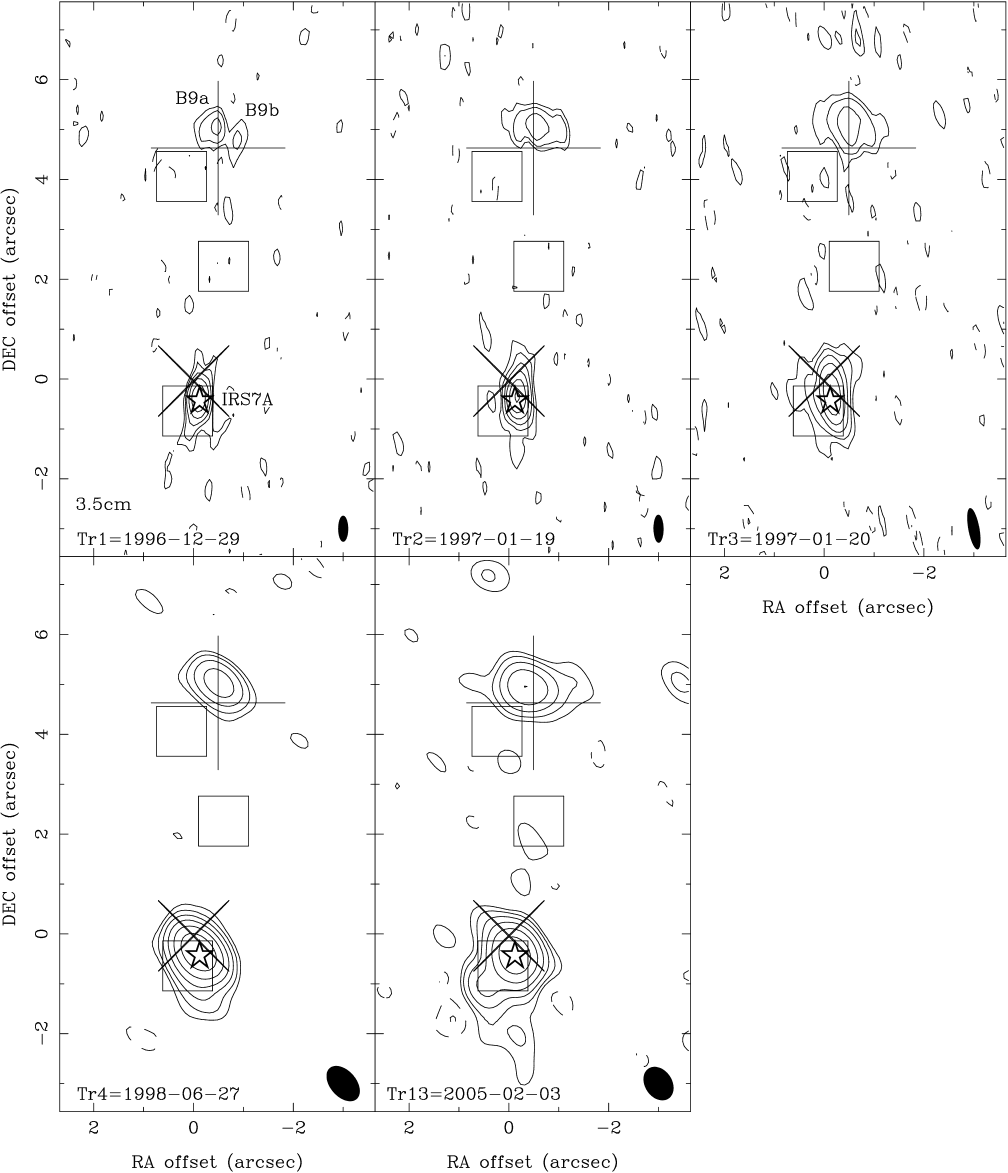
The IRS 7A region is a very complicated site of star formation. There are at least two young stellar objects in this small region, IRS 7A and B 9 (SMA 2), and each of them have subcomponents. All these sources seem to be embedded in the dense core SMM 1C777In this paper, we use the submillimeter source numbers given by Nutter et al. (2005). Choi & Tatematsu (2004) referred to SMM 1A, 1B, and 1C as vdA 4, 5, and 3, respectively, following the source numbers given by van den Ancker (1999). There is a difference in astrometry between Nutter et al. (2005) and Groppi et al. (2007), and we use the positions given by Groppi et al., if possible. (Nutter et al. 2005; Groppi et al. 2007). Figures 4–6 show the centimeter continuum maps of this region. We will try to dissect this region by comparing the radio maps with the images in other wavelengths.
5.1.1 IRS 7A
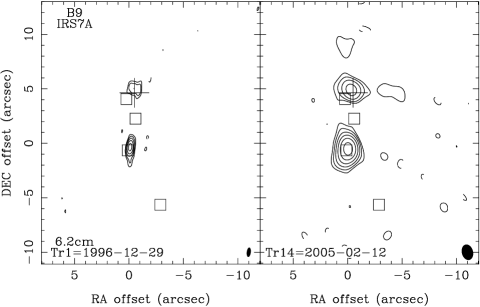
The Tr 1 map of Figure 6 has the highest resolution and shows the accurate position of the compact component of IRS 7A. In addition to the compact component, the other maps of Figure 6 as well as the average map (Fig. 4) show the extended structure that seems to be elongated roughly in the north-south direction. Judging from the spectral index and the morphology, the centimeter emission of IRS 7A most likely traces a thermal radio jet. The outflow activity may have become enhanced in recent years as the 3.5 cm flux density in 2005 (Tr 13) is significantly higher than those in the 1996–1998 period (Fig. 2). The 3.5 cm map of Tr 13 (Fig. 6) also shows a newly appearing subcomponent at 0.85′′ southeast of the main peak, which may be a bright knot of recently ejected material. Since this subcomponent is not present in the images of earlier epoch, its proper motion is at least 130 mas yr-1 (100 km s-1 at 170 pc).
The peak position of the 3.5 cm maps has not changed over the 8 years of monitoring and may indicate the location of the central object. As shown in Figure 6, the 3.5 cm source position agrees well with the positions of the sources detected in other wavelengths: the mid-IR source IRAC 5, the 7 mm source CT 4, and a Chandra X-ray source (Groppi et al. 2007; Choi & Tatematsu 2004; Hamaguchi et al. 2005). Despite all these detections over a wide range of wavelength, the classification (hence the evolutionary status) of IRS 7A is frustratingly uncertain because of the complicated environment. IRS 7A is certainly not a T Tauri star. The nondetection at 1.1 mm (Groppi et al. 2007) seems to rule out the possibility of IRS 7A being a Class 0 source, and Hamaguchi et al. (2005) suggested that IRS 7A may be a Class I source seen at a large inclination angle based on the near-IR magnitude and the column density measurement from X-ray observations. The IRAC color-color diagram places IRS 7A near IRS 7B and above the other Class I sources (Fig. 3), which suggests that IRS 7A may be either a Class 0/I transitional object or a Class I object in the younger part of the class.
Hamaguchi et al. (2005) could reproduce the XMM-Newton spectrum of the X-ray source XW using a single-temperature plasma model, which could also reproduce the Chandra data. Comparing the 3.5 cm maps with the Chandra X-ray positions (Fig. 6), the X-ray source seems to be associated with the main radio peak itself but not with the subcomponent on the southeast side or the more extended component on the south side of the main peak. (The Chandra observations were made in 2000 October and 2003 June.) This geometry suggests that the X-ray source may be closely related with the central star. The X-ray emission may come from either the protostellar magnetosphere or near the base of outflow. The detection of circularly polarized radio emission (Paper II) strongly suggests the existence of an active magnetosphere.
5.1.2 B 9 Complex
The centimeter source B 9 was resolved into two sources, B 9a and 9b, with a separation of 0.5′′ (Fig. 6). B 9a is slightly elongated in the east-west direction with a deconvolved size of 0.5′′, and B 9b is a point-like source. Both of them show negative spectral indices (–0.9 to –0.2, see Table 3), suggesting that the centimeter emission comes from a nonthermal process at least partially. In contrast, Miettinen et al. (2008) reported positive (0.4) spectral index, which suggests that either the nonthermal component is highly variable or their flux measurement included a significant contribution from the extended thermal emission source. The proper motion of B 9a/b is uncertain because they were not clearly separated in the Tr 13 image.
The centimeter source B 9 and the 7 mm source CT 2 are located close to each other, but not exactly at the same position. It is unlikely that this position difference (1.2′′) is caused by an instrumental uncertainty because the position agreement of IRS 7A and CT 4 is good. The peak position of the 1.1 mm source SMA 2 is 0.4′′ south of B 9a, but B 9b and CT 2 are also located within the beam size of the 1.1 mm map of Groppi et al. (2007). We will use the name ‘B 9 complex’ to refer to all these compact sources collectively. The spectral energy distribution (SED) of the B 9 complex (see Fig. 8 of Groppi et al. 2007) suggests that it may be harboring a Class 0 source, but it is not clear what is the true nature of the B 9 complex. Considering the complexity of the centimeter-millimeter maps and the existence of two outflows (see below), we suggest that the B 9 complex may be a multiple-protostar system. A subarcsecond-resolution map of dust emission is needed to locate the central stellar object(s) and understand the situation better.
Radio sources with significantly negative spectral index are rare in star forming regions but not unique. Examples include outflow lobes of Serpens SMM 1 and IRAS 16547–4247 (Rodríguez et al. 1989; Garay et al. 2003). The suggested radiation mechanism is nonthermal synchrotron emission, but the existence of highly relativistic electrons is not easy to explain. It is possible to accelerate a small fraction of electrons in the shocked region of outflow (e.g., Crusius-Wätzel 1990), but the density of the medium should be low enough to avoid being dominated by thermal radiation (Henriksen et al. 1991). It is also possible to produce energetic electrons in active magnetospheres, as observed around more evolved young stellar objects (Massi et al. 2006, 2008; Loinard et al. 2007). Other types of nonthermal radiation (such as gyrosynchrotron radiation, electron cyclotron maser, and plasma maser) cannot be ruled out (Güdel 2002), but they are less likely because circular polarization was not detected toward B 9 (Paper II). It remains to be seen if B 9a/b are indeed shocked regions of outflowing gas, and measurements of proper motion and linear polarization will be helpful.
5.1.3 FPM 10 and FPM 13
FPM 10 and 13 are extended sources, and their shape and peak position change depending on the epoch of observations. Their centimeter spectra are flat, suggesting optically thin free-free emission. They are highly elongated (Figs. 1, 4, and 5), and the major axes point to the B 9 complex. Therefore, they are most likely ionized gas of outflows driven by young stellar object(s) in the B 9 complex. However, they cannot be a single bipolar outflow system because their directions with respect to B 9 are nearly perpendicular to each other. Forbrich & Preibisch (2007) found diffuse X-ray emission in a region just north of FPM 13, but the relation between the extended X-ray structure and the B 9 complex is not clear.
FPM 10 is located about 3′′ west of the B 9 complex and elongated in the east-west direction. The size along the major axis is 3′′. The location and the flow direction of FPM 10 match well with the redshifted lobe of the bipolar outflow mapped in several molecular lines including HCO+ = 1 0 and CO = 3 2 (Anderson et al. 1997; Groppi et al. 2004, 2007). Therefore, FPM 10 and the molecular bipolar outflow seem to belong to a single outflow system.
FPM 13 is located about 4′′ north of the B 9 complex and elongated in the north-south direction. The size along the major axis is 3′′. There is no known molecular outflow that can be associated with FPM 13, but this is probably because the molecular line maps do not have a sufficiently high angular resolution. Because of the flow direction, the driving source of FPM 13 may be an object in the B 9 complex but cannot be the same object that is driving FPM 10. It should also be noted that we cannot completely rule out the possibility that FPM 13 may be driven by IRS 7A.
5.1.4 CT 3
CT 3 was nearly as bright as CT 2 in the 7 mm map (Choi & Tatematsu 2004) but not clearly detected in the centimeter maps. It is located in the “bridge” of radio emission structure between IRS 7A and B 9 (Fig. 4). This “bridge” may be tracing an outflow either from IRS 7A or from the B 9 complex (or a superposition of outflows from both). A marginally detectable amount of 3.5 cm emission can be seen in the Tr 13 map (Fig. 1 left panel). Choi & Tatematsu (2004) suggested that CT 3 may be a deeply embedded young stellar object, but the nondetection at 1.1 mm (Groppi et al. 2007) seems to rule out this possibility. A possible explanation is that CT 3 may be a knot of outflowing gas that was temporarily brightened at the time of the 7 mm observations.
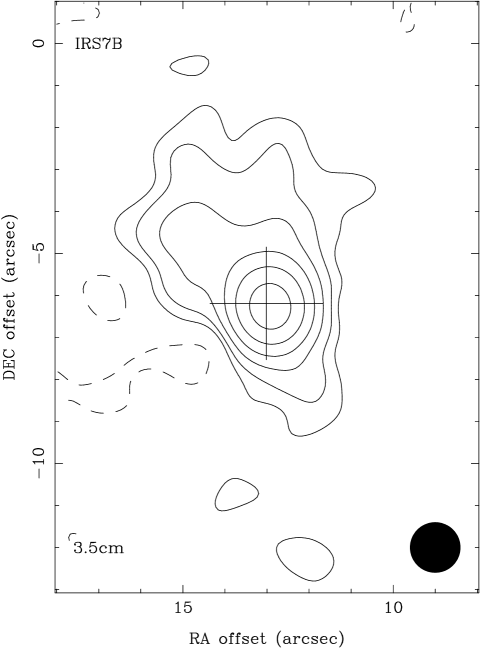
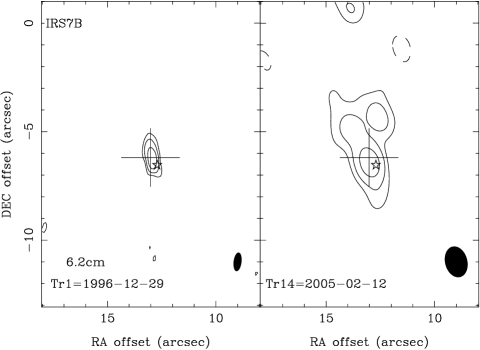
5.2 IRS 7B
The IRS 7B region is less complicated than the IRS 7A region but still needs a careful analysis to understand the structure. Figures 7–9 show the centimeter continuum maps of the IRS 7B region. There is a single compact source surrounded by an extended structure elongated in the northeast-southwest direction. The spectral index was highly negative (–1.4) during Tr 1 but only mildly negative (–0.2) during Tr 13/14 (Table 3). This difference is due to the low 3.5 cm flux during Tr 1, which probably means that the extended structure was resolved out in the A-array observations. If only the compact source is considered, the spectral index is 0.1 during Tr 1 and 0.7 during Tr 13/14. Therefore, the centimeter flux from the central compact source of IRS 7B may be mostly from free-free emission.
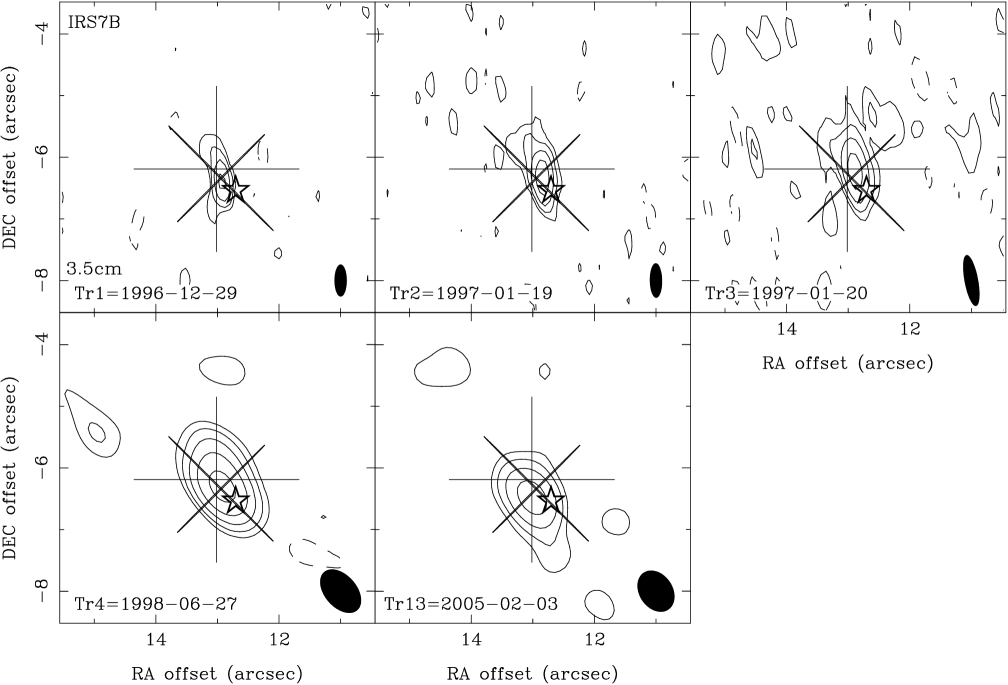
The peak position of the 3.5 cm maps did not show a detectable proper motion over the 8 years of monitoring and may indicate the location of the central object. As shown in Figure 9, the 3.5 cm peak position agrees with the positions of the mid-IR source IRAC 4, the 1.1 mm source SMA 1, and the Chandra X-ray source (Groppi et al. 2007; Hamaguchi et al. 2005). Groppi et al. (2007) suggested that IRS 7B is a Class 0/I source based on the SED analysis. Therefore, IRS 7B may be a protostar embedded in the dense core SMM 1B.
The extended component of IRS 7B shown in Figure 7 has a length of 9′′ and a position angle of 20°. The bipolar morphology suggests that the extended component traces a bipolar outflow driven by IRS 7B. The northeastern lobe (FPM 15) is brighter than the opposite lobe. The outflow in our maps is probably the base of the large-scale (2′) bipolar jet in the 6 cm maps of Brown (1987) and Miettinen et al. (2008). Large-scale maps of molecular lines from single-dish observations did not show any sign of molecular outflow parallel to the IRS 7B outflow. Again, this nondetection is probably caused by a confusion with the east-west outflow of B 9. The interferometric map in the HCO+ line (Fig. 6 of Groppi et al. 2007) seems to show a molecular outflow around SMA 1: blueshifted emission on the south of SMA 1 and redshifted emission on the northeast of SMA 1. The size and direction of the HCO+ emission structure seem to agree with the outflow seen in our centimeter continuum maps. However, note that Groppi et al. (2007) interpreted the HCO+ emission structure as a part of a large spherical shell.
Similarly to IRS 7A, the Chandra X-ray source is associated with the main peak of the centimeter source, IRS 7B, but not with the secondary peaks in the outflow lobe such as FPM 15. This geometry suggests that the X-ray source is associated with the central protostar. Hamaguchi et al. (2005) found that the XMM-Newton spectra of XE could be reproduced better using a two-temperature model. They concluded that the hard X-ray component comes from a mass accretion spot on the protostar while the soft component probably comes from shock-heated plasma related to a jet/outflow. The high plasma temperature and the large X-ray luminosity require a large amount of gas at a very high outflow velocity (Hamaguchi et al. 2005; Forbrich et al. 2006). A possible model reconciling the radio and the X-ray observations is that the hard and time-variable X-ray component may be emitted by circumstellar magnetic activity and that the soft and constant X-ray component and the centimeter emission may come from plasma heated by the collision of a steady jet with ambient gas (Hamaguchi et al. 2005; Forbrich & Preibisch 2007). Since the X-ray spectra from Chandra observations were dominated by the soft component and the spatial resolution of XMM-Newton is limited (6′′), the exact position of the hard component is unknown. To understand the IRAS 7B system clearly, it is necessary to observe the X-ray source with a high resolution during an active phase of the hard component.
5.2.1 CHLT 13
CHLT 13 is a 6.2 cm continuum source detected during Tr 14 (Fig. 1). Since it was not detected in the 6.2 cm map of Tr 1 and never detected in the 3.5 cm continuum, it must be a transient source. Its location is near the dense core SMM 1A. Nutter et al. (2005) suggested that the submillimeter source SMM 1A may be a prestellar object because it was not detected in other wavelengths. On the other hand, the 6 cm maps of Miettinen et al. (2008) show extended clumpy structure around this region, but none of their emission peaks coincides with CHLT 13 exactly. On the nature of CHLT 13, we suggest two possibilities. First, CHLT 13 may indicate a star forming activity in SMM 1A. Second, CHLT 13 may be a temporarily brightened knot of the IRS 7B outflow. More speculatively, the southwestern outflow of IRS 7B may be colliding with a dense clump in SMM 1A and producing transient radio emission at the shock front.
5.3 IRS 5
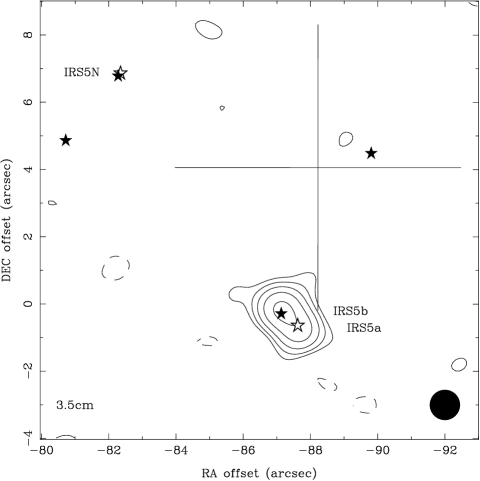
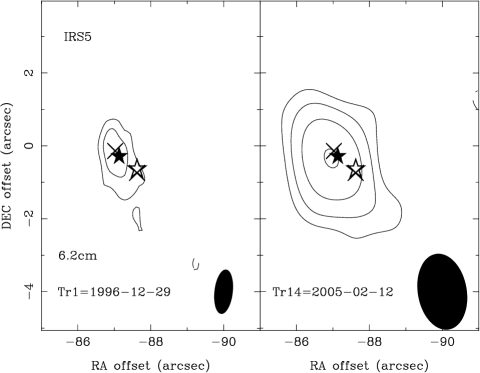
IRS 5 is a very interesting binary system. Figures 10–12 show the centimeter continuum maps of the IRS 5 region. IRS 5 was clearly resolved into two sources when the resolution is high enough (see the maps of Tr 1, Tr 2, and Tr 13 in Fig. 12). Even when the resolution is not high enough, the 3.5 cm maps usually show an extended structure that can be best interpreted as a combination of two point-like sources (see the maps of Tr 4 and Tr 6–12 in Fig. 12). In addition, comparison with the Stokes- maps (Paper II) clearly shows that the southwestern source was detected in the Stokes- maps. Since the 3.5 cm sources are similar to the near-IR sources (Chen & Graham 1993; Nisini et al. 2005) in separation and position angle, we identify the southwestern and the northeastern sources as IRS 5a and 5b, respectively. The Stokes- maps show a point-like source at the position of IRS 5b while IRS 5a was undetected in the Stokes- flux, and there is a good correlation between the Stokes- and Stokes- fluxes of IRS 5b (see the discussion in Paper II).
IRS 5a is brighter in the near-IR images of Nisini et al. (2005), but IRS 5b is usually brighter in radio. The separation between them in the 3.5 cm Tr 1 image is 0.9′′ (160 AU at 170 pc). They were not clearly separated in the 6.2 cm maps, but the Tr 1 map (Fig. 11 left panel) shows that both IRS 5a and 5b have detectable 6.2 cm fluxes. Since circularly polarized flux was detected from IRS 5, the centimeter flux clearly has a nonthermal component, and we will discuss this issue in Paper II. Another Class I source in this region, IRS 5N (FPM 5), was not clearly detected though Forbrich et al. (2006) reported that it was detected when several data sets were combined.
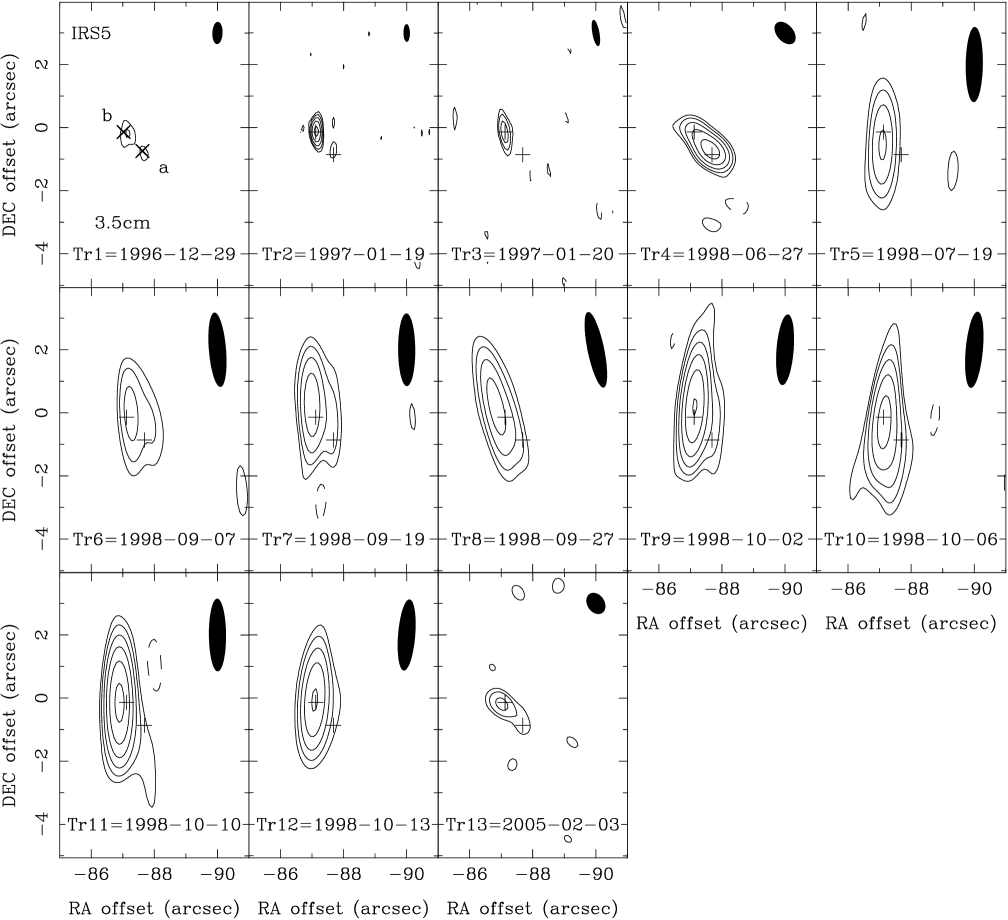
Table 5 lists the 3.5 cm flux densities of each binary component. For the maps of Tr 4–12, the flux was measured by fitting the image with a sum of two point-like sources (see the end note of Table 5 for details). The uncertainty of total flux from this fitting method was estimated by performing simple Monte Carlo simulations. Since we assumed that both sources are point-like, the uncertainty can be larger if this assumption is not valid. The light curves of IRS 5a and 5b are shown in Figure 13. The flux uncertainty shown in Figure 13 is the statistical uncertainty listed in Table 5, but one should also consider the uncertainty in the absolute flux scale, which was not explicitly measured but usually about 1–2% (VLA Calibrator Manual888See http://www.vla.nrao.edu/astro/calib/manual.). The radio light curves clearly show that both sources are highly variable. IRS 5b is usually brighter and more active than IRS 5a, but IRS 5a outshone its companion at least once (Tr 4) during the monitoring. This behavior clearly tells that the flux variability of each source should be analyzed separately, but previous authors considered the flux of the IRS 5 system as a whole, which may have caused some confusion.
The radio positions of IRS 5a/b agree well with the position of X-ray sources (Hamaguchi et al. 2008). The separation between the X-ray sources is 0.8′′, which is in good agreement with the radio value. There seems to be a difference in the relative degree of flare activity between the two sources. IRS 5b is more active in radio (Fig. 13), but IRS 5a is more active in X-rays (Hamaguchi et al. 2008). To understand this difference, it is necessary to monitor the IRS 5 system in both radio and X-rays simultaneously. Forbrich et al. (2007) attempted such a study, but IRS 5 was not active in radio during their observations and their angular resolution was not high enough to resolve the system.
The position and relative brightness of the near-IR counterparts need some consideration. Nisini et al. (2005) reported that the separation between the two near-IR sources is 0.6′′, but their Figure 1 shows that the separation is actually 0.9′′, in agreement with the radio/X-ray value. The absolute position of the near-IR sources in the image of Nisini et al. (2005) has an offset of 1′′ to the southeast relative to the radio/X-ray position. We presume that this offset was caused by an instrumental uncertainty of the near-IR observations. It is interesting to note that the 2MASS position agrees with the radio position of IRS 5b while the mid-IR source IRAC 10 coincides with IRS 5a (Fig. 10). This difference between the 2MASS and the IRAC positions is not an astrometric problem because the positions of IRS 5N show a good agreement. Therefore, we suppose that the primary object in the near-IR brightness can be either one depending on the epoch of observations. That is, either one or both of them may be variable in near-IR. Alternatively, they may have different intrinsic colors. The relation between the variability in near-IR and in radio/X-rays has not been well understood so far (Forbrich et al. 2007).
| IRS 5a | IRS 5b | ||||
|---|---|---|---|---|---|
| Track | Peak | Total | Peak | Total | |
| Tr 1 | 0.11 0.02 | 0.12 0.02 | 0.17 0.02 | 0.25 0.02 | |
| Tr 2 | 0.15 0.03 | 0.15 0.03 | 1.63 0.03 | 1.82 0.04 | |
| Tr 3 | 0.51 0.03 | 0.58 0.04 | |||
| Tr 4 | 1.93 0.03 | 2.04 0.05 | 0.53 0.04 | ||
| Tr 5 | 0.72 0.03 | 0.75 0.04 | |||
| Tr 6 | 0.16 0.03 | 0.45 0.03 | 0.45 0.04 | ||
| Tr 7 | 0.28 0.04 | 1.10 0.02 | 1.05 0.04 | ||
| Tr 8 | 0.26 0.05 | 0.94 0.02 | 0.91 0.03 | ||
| Tr 9 | 0.27 0.04 | 2.67 0.02 | 2.67 0.04 | ||
| Tr 10 | 0.41 0.03 | 1.77 0.03 | 1.83 0.04 | ||
| Tr 11 | 0.22 0.04 | 3.11 0.02 | 3.14 0.05 | ||
| Tr 12 | 0.08 0.04 | 1.38 0.02 | 1.43 0.04 | ||
| Tr 13 | 0.16 0.03 | 0.16 0.03 | 0.41 0.03 | 0.41 0.03 | |
Note. — Flux densities are corrected for the primary beam response, and the unit is mJy (beam-1). The Tr 1 fluxes are from the natural-weight map, and the others are from the uniform-weight maps. For Tr 1, 2, 3, and 13, IRS 5a and 5b are relatively well-separated in the image, and each total flux was measured in a box around each source. For Tr 4–12, the binary components were not clearly separated, and the total fluxes were measured by fitting each image using a sum of two point-like sources. In the fitting process, the position offset between the two sources was fixed using the value measured in the Tr 1 map.

IRS 5a/b (and IRS 5N) are young stellar objects probably embedded in the dense core SMM 4 (Nutter et al. 2005; Groppi et al. 2007). IRS 5 as a whole is a Class I source (Fig. 3; Wilking et al. 1997; Nutter et al. 2005; Hamaguchi et al. 2008). However, Nisini et al. (2005) suggested that IRS 5a may be a more evolved object, such as a T Tauri star, on the basis of the lack of significant accretion activity. It is not clear if IRS 5 has any outflow activity. Groppi et al. (2007) reported a CO outflow in this region though the driving source could not be specified clearly. Subarcsecond-resolution imaging in the millimeter or submillimeter band is necessary to understand the situation more clearly.
5.3.1 IRS 5b
The flux variability of IRS 5b needs a detailed discussion. Though more extensive monitoring is necessary to understand the flare activities, it may be useful to consider two phases: quiescent phase and active phase, depending on the total flux. We suggest a flux threshold of 0.8 mJy for IRS 5b, which is somewhat arbitrary. The flux density in the quiescent phase (Tr 1, 3, 4, 5, 6, and 13) is about 0.5 mJy on average.
Examining the light curve shown in Figure 13, two periods of active phase can be recognized: a short one in 1997 January (Tr 2) and a long one in 1998 September–October (Tr 7–12). Detailed information on the 1997 flare activity is not available, and the duration of the active phase must have been less than 22 days. The 1998 flare activity can be discussed in more detail. The duration of the active phase was about 30 days, and the flux fluctuated wildly during this period. The average flux density during this active phase was higher than that of the quiescent phase by a factor of about 4. The light curve shows three flux peaks (Tr 7, 9, and 11) with peak-to-peak intervals of about 10 days, but the flux might have fluctuated more rapidly if the sampling interval had been shorter.
The time scale of the flare activity of IRS 5b is much longer than that of the radio bursts of the Sun or flare stars, typically a few minutes or shorter. This month-scale flare activity of IRS 5b implies that the cause of the flare is not a local magnetic activity on the surface of the (proto)star but probably a reconnection event of global magnetic fields around the star or even magnetic fields connecting the star and the circumstellar disk. More details of the flare activity will be discussed in Paper II.
5.3.2 IRS 5a
IRS 5a is usually weak (0.13 mJy) or undetectable, but showed at least two active periods during the monitoring. (Here, we set the quiescent-active phase threshold at 0.2 mJy.) In 1998 June (Tr 4), IRS 5a went through an outburst with the flux higher than the quiescent level by a factor of 15. It is not clear how long was the duration of this outburst.
In 1998 September–October (Tr 7–11), the flux of IRS 5a increased mildly and stayed at a level about twice the quiescent level. This increase of flux is not an artifact of the image fitting process used in measuring the flux of each binary component. If the flux of IRS 5a had been at the quiescent level, it would have been barely noticeable in the images, but IRS 5a is clearly recognizable in the images during this active period. For example, compare the Tr 9 image with the Tr 12 image: the source structures in these two images are clearly different even though the beam sizes are almost identical, which clearly shows that the flux of IRS 5a was significantly higher during Tr 9 than during Tr 12.
5.3.3 Concurrent Activity in 1998
What is really interesting about the flare activity in 1998 September–October is that both objects in the binary system are active at the same time. If this concurrency is not a chance coincidence but has a real physical reason, there are three possibilities. First, the binary companions may be interacting directly through a physical process unknown so far. Second, what was observed may be a giant magnetic structure such as a circumbinary halo of ionized gas. Third, they may be responding to an external cause, such as an enhanced accretion of material from the envelope.
The possibility of the interacting (proto)binary requires an underlying physical mechanism that is unknown so far. If the intense flare activity of IRS 5b was the cause of the flux enhancement of IRS 5a, the light curves indicate that such an interaction should happen in a time scale of several days. The projected separation between IRS 5a and 5b is 0.9 light-day. Then the order-of-magnitude velocity of the interaction agent must be about 10% of the speed of light or faster. Such a high velocity is not completely unreasonable because the circularly polarized radio emission of IRS 5b implies the existence of mildly relativistic electrons. Intrabinary magnetic fields between stars are often suggested to explain the activity of stellar systems such as RS CVn binaries (Dulk 1985), and interacting helmet streamers were observed around a young binary system (Massi et al. 2008). The size of the IRS 5 system is probably too large to have directly interacting stellar magnetic fields. However, large-scale magnetic fields involving circumstellar disk(s) and/or outflows might provide a new mechanism of interaction.
Circumbinary halos and large-scale magnetic structures are often suggested to explain the radio activity of RS CVn binaries and related objects, and some halos were imaged using the VLBI technique (Mutel et al. 1985; Phillips et al. 1991). It is unknown if a circumbinary halo can be as large as the IRS 5 system. In principle, this possibility can be tested by imaging IRS 5 with an angular resolution of 0.2′′ during an active phase.
In the third possibility, the responses of IRS 5a and 5b can be synchronized down to the crossing time of the accreting material. The velocity of accreting gas can be approximated by the free-fall velocity, . Assuming and taking to be the binary separation, we get 3 km s-1. Then the crossing time is 200 yr, which is too long to explain the concurrent activities of IRS 5a/b. Therefore, the third possibility is improbable unless there is a very fast triggering mechanism.
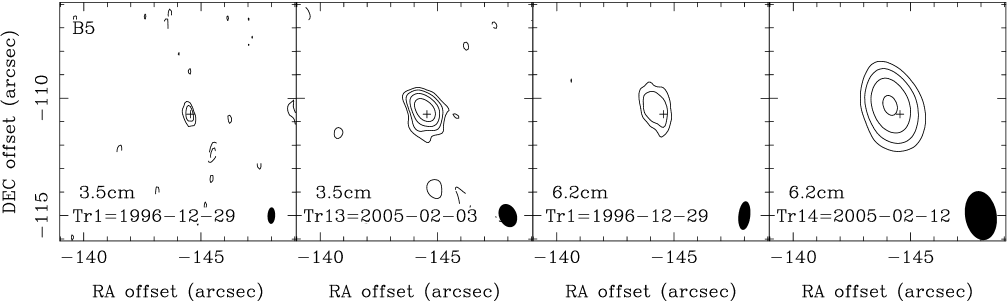
5.4 B 5
B 5 is a variable radio source (Fig. 2; Suters et al. 1996). Figure 14 shows the radio continuum maps of B 5. While the 3.5 cm map of Tr 1 did not have enough sensitivity to see the source structure, the 6.2 cm map of Tr 1 shows that B 5 is extended along the northeast-southwest direction (P.A. = 44°) with a deconvolved size (FWHM) of 1.3′′. In the 3.5 cm map of Tr 13, B 5 appears slightly extended along a similar direction (P.A. = 53°) with a deconvolved size of 0.6′′. The proper motion measurement of B 5 is unreliable because the source is extended. The peak position of the 6.2 cm source has a small offset (0.6′′ toward northeast) with respect to the position of the 3.5 cm source.
The spectral index was highly negative (–1.3) during Tr 1 but positive (1.1) during Tr 13/14 (Table 3). This difference is due to the high 3.5 cm flux during Tr 13, which probably means that B 5 went through an outburst during Tr 13. This outburst was accompanied with circularly polarized emission, suggesting magnetospheric origin (Paper II). The centimeter flux during Tr 1 was obviously from a nonthermal emission process. Such a large fluctuation of spectral index was also reported by Suters et al. (1996) based on monitoring observations in 1992. However, the spectral index was never highly negative in the 1992 observations, and Suters et al. concluded that the fluctuation was caused by an optical depth effect of thermal free-free emission. Miettinen et al. (2008) reported a negative spectral index, confirming the nonthermal nature of the emission from B 5. The complicated variability of the centimeter emission from B 5 may be caused by a combined effect of nonthermal emission process and frequent flare events.
The nature of B 5 is an enigma. Suters et al. (1996) argued against an extragalactic source on the basis of the rapid variability. The source size also supports this argument because the radio flux from such an extended source cannot vary rapidly if it is extragalactic. Examinations of archival Spitzer images did not produce any positive detection at the position of B 5. The nondetection in the mid-IR or millimeter continuum suggests that it is not a deeply embedded object if located at the distance of the CrA cloud. Feigelson et al. (1998) suggested B 5 to be a brown dwarf based on a faint source in the near-IR images of Wilking et al. (1997), but this region is confusing in optical and near-IR images because of the nebulosity around IRS 2.
5.5 IRS 1
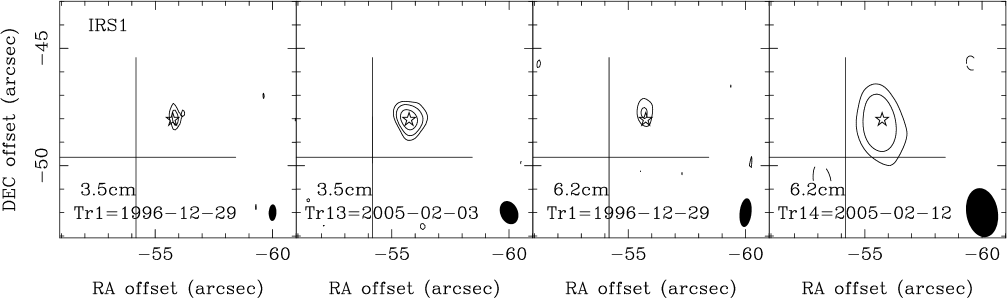
IRS 1 (HH 100 IR) is a point-like source, and its flux is relatively stable. Figure 15 shows the centimeter continuum maps toward the IRS 1 region. The spectral index is positive and consistent with optically thick thermal emission, which agrees with the conclusion of Suters et al. (1996). IRS 1 probably showed a proper motion of 21 10 mas yr-1 toward the east, but more observations are needed to confirm this value.
The 3.5 cm peak position agrees well with the position of the mid-IR source IRAC 7 (Groppi et al. 2007). IRS 1 is a variable X-ray source (Forbrich et al. 2006), which suggests that the low variability of the radio flux is probably due to the large optical depth in the centimeter band. IRS 1 is a Class I object embedded in SMM 3, and most of its bolometric luminosity is due to accretion (Fig. 3; Wilking et al. 1992; Nisini et al. 2005; Nutter et al. 2005; Groppi et al. 2007). It is the driving source of HH 100 and probably other Herbig-Haro objects (Strom et al. 1974; Hartigan & Graham 1987; Wang et al. 2004).
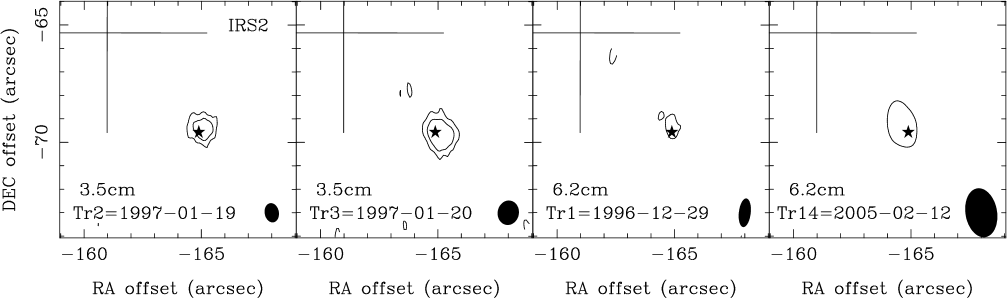
5.6 IRS 2
IRS 2 is a point-like source, and Figure 16 shows the radio continuum maps. IRS 2 is located outside the field of view in our 3.5 cm observations, but is within the field of view of the 3.5 cm observations of projects AC 481 and AM 596. The 3.5 cm flux density varies between 0.25 and 0.64 mJy. The spectral index between 3.5 and 6.2 cm, estimated from the average flux densities, is 1.3 0.7, but this value is highly uncertain because there was no observation made simultaneously in both wavelength bands. The positive spectral index implies that thermal free-free radiation may be the emission mechanism at the centimeter band.
The 3.5 cm peak position agrees well with the near-IR source position (Fig. 16). IRS 2 is a strong and variable X-ray source (Forbrich et al. 2006). IRS 2 seems to be embedded in SMM 5 and shows evidences of active accretion (Nisini et al. 2005; Nutter et al. 2005). The bolometric temperature and luminosity of IRS 2, calculated using the infrared fluxes from Spitzer archival data (Table 4), are 457 17 K and 10.0 0.1 , respectively. This temperature confirms that IRS 2 is a Class I protostar as previously suggested by Wilking et al. (1992). The IRAC color-color diagram also places IRS 2 inside the Class 0/I domain (Fig. 3).
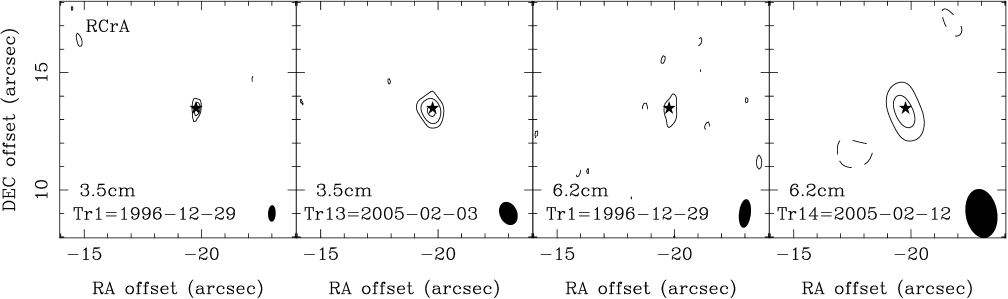
5.7 R CrA
R CrA is a point-like source, and Figure 17 shows the radio continuum maps. While R CrA is dominating this region in the optical and near-IR bands, it is relatively weak in radio. R CrA is detectable in all the data sets analyzed and shows some flux variability (Fig. 2). The spectral index of the centimeter continuum is positive, suggesting that the radio flux comes from optically thick thermal emission. The proper motion of R CrA is consistent with that of the R CrA association (see § 4.4).
The 3.5 cm peak position agrees well with the near-IR source position (Fig. 17). It is not clear how strong the submillimeter emission from R CrA is (Groppi et al. 2007). R CrA is a Herbig Ae star of 3.5 , and it is also an interesting X-ray source with a plasma temperature of 100 MK (Forbrich et al. 2006). To explain the X-ray emission, Forbrich et al. (2006) suggested that R CrA may be a binary system: an optically bright Herbig Ae star and an X-ray bright Class I source. Takami et al. (2003) also suggested that R CrA may be a binary system based on spectro-astrometric observations, but, in this case, both members must be visible in the H line.
5.8 T CrA
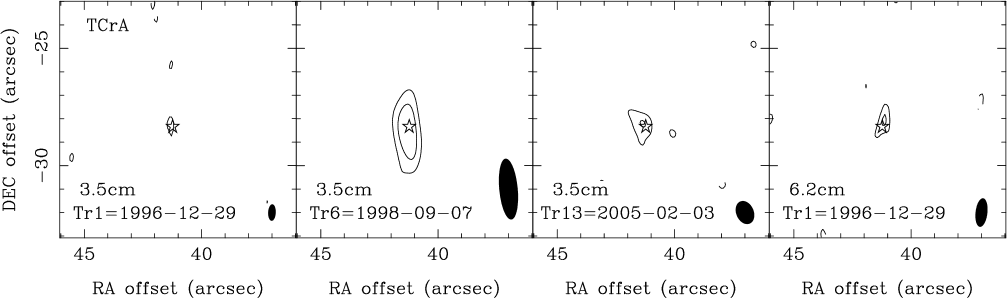
Radio emission from T CrA has not been reported before, but it was detected in our maps as a weak point-like source. Careful examinations of archival data revealed that T CrA was detectable most of the time. Figure 18 shows the radio continuum maps, and Table 6 lists the flux densities. The spectral index is negative, but the uncertainty is too large to constrain the emission mechanism.
| T CrA | WMB 55 | ||||
|---|---|---|---|---|---|
| Track | Peak | Total | Peak | Total | |
| Tr 1 | 0.10 0.02 | 0.10 0.02 | |||
| Tr 2 | 0.11 0.02 | 0.21 0.03 | |||
| Tr 3 | 0.11 0.02 | 0.11 0.02 | |||
| Tr 4 | 0.10 0.02 | 0.10 0.02 | 0.13 0.02 | 0.13 0.02 | |
| Tr 5 | |||||
| Tr 6 | 0.19 0.02 | 0.20 0.02 | |||
| Tr 7 | 0.11 0.03 | 0.13 0.03 | |||
| Tr 8 | 0.11 0.03 | 0.13 0.03 | |||
| Tr 9 | 0.16 0.03 | 0.16 0.03 | |||
| Tr 10 | 0.08 0.02 | 0.08 0.02 | |||
| Tr 11 | 0.16 0.03 | 0.16 0.03 | 0.15 0.03 | 0.15 0.03 | |
| Tr 12 | 0.18 0.03 | 0.20 0.04 | |||
| Tr 13 | 0.13 0.02 | 0.17 0.02 | 0.15 0.02 | 0.17 0.03 | |
Note. — Flux densities are corrected for the primary beam response, and the unit is mJy (beam-1). They are from the natural-weight maps.
The 3.5 cm peak position agrees well with the position of the mid-IR source IRAC 1 (Groppi et al. 2007). T CrA is a weak X-ray source (Forbrich et al. 2007) and was not detected in the submillimeter continuum (Groppi et al. 2007). T CrA is a Herbig star of type F0e. Takami et al. (2003) suggested that T CrA may be a binary system. Wang et al. (2004) suggested that T CrA may be the driving source of the Herbig-Haro object HH 733.
5.9 WMB 55
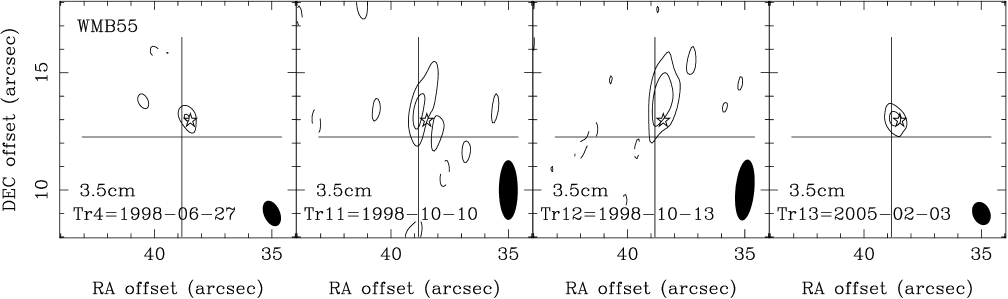
Centimeter continuum emission from WMB 55 has not been reported before, but it was detected in our 3.5 cm map as a weak point-like source. Examinations of archival data revealed that the 3.5 cm flux of WMB 55 was detectable in a few observing runs, but it was not detected in the 6.2 cm continuum. Table 6 lists the flux densities, and Figure 19 shows the 3.5 cm continuum maps. The nondetection in the 6.2 cm continuum implies that the spectral index is positive, but the uncertainty is too large to constrain the emission mechanism.
The 3.5 cm peak position agrees well with the position of the mid-IR source IRAC 3 (Groppi et al. 2007). WMB 55 was not detected in the X-ray band. WMB 55 is a Class I source embedded in SMM 2 (Fig. 3; Chini et al. 2003; Nutter et al. 2005). Wang et al. (2004) suggested that WMB 55 is a probable driving source of the Herbig-Haro objects HH 733 and/or HH 734. HH 104 A/B are also located in the vicinity of WMB 55, but it is not clear if they are related with WMB 55.
5.10 IRS 6
IRS 6 was not detected in our maps, though Forbrich et al. (2006) reported that it was detected when several data sets were combined. Surprisingly, examinations of archival data revealed that IRS 6 went through an outburst on 1998 October 13 (Tr 12) while it was undetectable or only marginally detectable in the other epochs. Miettinen et al. (2008) reported another outburst detected in 1998 January.
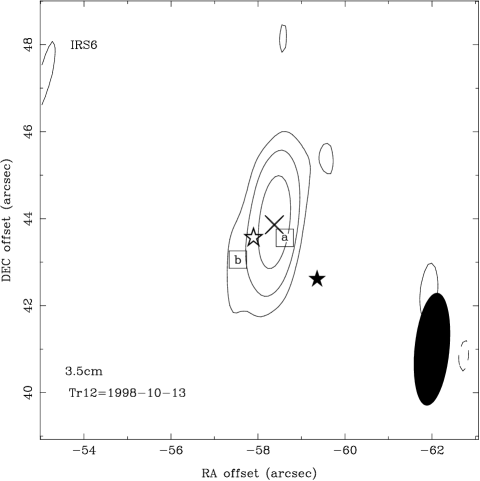
Figure 20 shows the 3.5 cm continuum map at the epoch of the outburst. The source was slightly elongated along the northwest-southeast direction (P.A. –41°) with a deconvolved size of 0.7′′, and the total flux density was 0.44 0.05 mJy. Since IRS 6 was undetected during Tr 11, the onset time-scale was less than 3 days. It is not clear how long was the duration of this outburst because Tr 12 was the last observing track of the 1998 observing campaign.
The peak position at the outburst agrees well, within 0.2′′, with the X-ray source position, which suggests that the same source is responsible for both the radio and the X-ray emission. (The X-ray source position was determined using the images discussed in Hamaguchi et al. 2008.) Since IRS 6 is a near-IR binary system (Nisini et al. 2005), the radio/X-ray source may be one of the binary members. Comparing the near-IR source positions with the radio source position, after applying the astrometric correction determined using IRS 5a/b (see § 5.3), the radio source can be identified as IRS 6a. Interestingly, the mid-IR source IRAC 8 is located halfway between IRS 6a and 6b, suggesting that the mid-IR fluxes of the binary members are comparable. X-ray emission was never detected at the position of IRS 6b. In contrast to the IRS 5 system, only one member of the IRS 6 system seems to show detectable magnetic activities.
IRS 6a showed little sign of accretion activity (Nisini et al. 2005) and was suggested to be a T Tauri star (Forbrich et al. 2006). However, the spectral class of IRS 6 was unclear because a detailed SED was not available. The 850 m continuum map of Groppi et al. (2007) does show an unnumbered local peak at the position of IRS 6, which indicates that IRS 6 may be an embedded object. The bolometric temperature and luminosity of IRS 6, calculated using the infrared fluxes from the Spitzer archival data (Table 4), are 424 12 K and 0.4 , respectively. This temperature suggests that IRS 6 is a Class I protostar. The IRAC color-color diagram also places IRS 6 in the Class 0/I domain (Fig. 3). Wang et al. (2004) suggested that IRS 6 may be driving a giant Herbig-Haro flow: HH 730, HH 860, HH 104 C/D, and HH 99.
6 SUMMARY
We observed the R CrA region using the VLA in the 3.5 and 6.2 cm continuum to image the young stellar objects and study the star forming activities in this region. Archival VLA data from recent observations made in extended configurations were also analyzed. A total of 16 sources was detected. The source properties were studied by investigating source structure, flux variability, spectral slope, and proper motion and also by comparing with the sources detected in shorter wavelength. The main results are summarized as follows:
1. The centimeter emission of IRS 7A traces the thermal radio jet that seems to be flowing in the north-south direction, and the outflow activity has become enhanced in recent years. A recently ejected outflow knot was found to be moving at a speed of 100 km s-1 or higher. The main peak position of the radio emission agrees with the mid-IR and X-ray positions, which suggests that the X-ray emission comes from the central (proto)star or a very vicinity of it.
2. The Class 0 source SMA 2 is associated with the centimeter continuum sources B 9a/b and the 7 mm continuum source CT 2. While the detailed structure of the B 9 complex needs further studies, it may be a multiple-protostar system that is driving at least two outflows (FPM 10 and FPM 13). The negative spectral slope of B 9a/b indicates that the radiation process is nonthermal.
3. The centimeter continuum images of IRS 7B show a combination of a compact source and an extended structure. The compact source corresponds to the Class 0/I source SMA 1. The X-ray source position also agrees well with the radio peak position, and IRS 7B (SMA 1) is one of the youngest known objects that were detected in X-rays, which suggests that energetic magnetic activities start very early in the protostellar stage. The extended structure is probably a bipolar outflow driven by IRS 7B.
4. The Class I binary system IRS 5 was resolved in the 3.5 cm continuum maps. The binary separation is 0.9′′ (160 AU). Both members of the system show radio flare activities and X-ray emission. IRS 5 is one of the youngest known binary systems that is showing magnetic activities in both members.
5. The radio light curve of IRS 5b shows at least two flare activities, and the duration of active phase is about a month. Such a long time-scale suggests that the flare activity involves large-scale magnetic fields.
6. During the 1998 September–October flare event of IRS 5b, the radio flux of IRS 5a also showed a significant enhancement. This concurrent activity suggests a few possibilities: IRS 5a and 5b are interacting directly, they are surround by a circumbinary halo, or they are responding to an external trigger. IRS 5 may be the youngest known example of interacting binaries.
7. The variable radio source B 5 was found to be an extended (1′′) object. The spectral slope also varies significantly, suggesting that both thermal and nonthermal radiation processes are working. The rapid variability and the source size rule out an extragalactic source. The nature of B 5, however, still remains unclear.
8. The Class I sources IRS 1 and IRS 2 show positive spectral slopes. The centimeter emission of these sources is likely coming from optically thick thermal free-free radiation. The flux density of IRS 1 is relatively stable.
9. The Herbig Ae star R CrA is a relatively weak radio source, and the spectral slope is consistent with thermal emission. The marginally detected proper motion, 28 mas yr-1 toward southeast, is consistent with that of the R CrA association.
10. Radio detections of the Herbig star T CrA and the Class I source WMB 55 are reported here for the first time. The emission mechanism of these sources is not clear.
11. The near-IR binary IRS 6 is usually weak or undetectable in the centimeter continuum, but a radio flare event was detected in 1998 October. The radio source positionally coincides with the X-ray source and was tentatively identified as IRS 6a. Only one member of the IRS 6 binary system seems to show detectable magnetic activities. Infrared data suggests that IRS 6 is a Class I source.
References
- (1) Allen, L. E., et al. 2004, ApJS, 154, 363
- (2) Anderson, I. M., Harju, J., Knee, L. B. G., & Haikala, L. K. 1997, A&A, 321, 575
- (3) Anglada, G., Villuendas, E., Estalella, R., Beltrán, M. T., Rodríguez, L. F., Torrelles, J. M., & Curiel, S. 1998, AJ, 116, 2953
- (4) Bally, J., Feigelson, E., & Reipurth, B. 2003, ApJ, 584, 843
- (5) Brown, A. 1987, ApJ, 322, L31
- (6) Chen, H., Myers, P. C., Ladd, E. F., & Wood, D. O. S. 1995, ApJ, 445, 377
- (7) Chen, W. P., & Graham, J. A. 1993, ApJ, 409, 319
- (8) Chini, R., et al. 2003, A&A, 409, 235
- (9) Choi, M., & Tatematsu, K. 2004, ApJ, 600, L55
- (10) Choi, M., Tatematsu, K., Hamaguchi, K., & Lee, J.-E. 2008, ApJ, submitted (Paper II)
- (11) Crusius-Wätzel, A. R. 1990, ApJ, 361, L49
- (12) Dulk, G. A. 1985, ARA&A, 23, 169
- (13) Favata, F., Fridlund, C. V. M., Micela, G., Sciortino, S., & Kaas, A. A. 2002, A&A, 386, 204
- (14) Feigelson, E. D., Carkner, L., & Wilking, B. A. 1998, ApJ, 494, L215
- (15) Feigelson, E. D., & Montmerle, T. 1999, ARA&A, 37, 363
- (16) Forbrich, J., & Preibisch, T. 2007, A&A, 475, 959
- (17) Forbrich, J., Preibisch, T., & Menten, K. M. 2006, A&A, 446, 155
- (18) Forbrich, J. et al. 2007, A&A, 464, 1003
- (19) Garay, G., Brooks, K. J., Mardones, D., & Norris, R. P. 2003, ApJ, 587, 739
- (20) Groppi, C. E., Hunter, T. R., Blundell, R., & Sandell, G. 2007, ApJ, 670, 489
- (21) Groppi, C. E., Kulesa, C., Walker, C., & Martin, C. L. 2004, ApJ, 612, 946
- (22) Hamaguchi, K., Choi, M., Corcoran, M. F., Choi, C.-S., Tatematsu, K., & Petre, R. 2008, ApJ, in press
- (23) Hamaguchi, K., Corcoran, M. F., Petre, R., White, N. E., Stelzer, B., Nedachi, K., Kobayashi, N., & Tokunaga, A. T. 2005, ApJ, 623, 291
- (24) Harju, J., Haikala, L. K., Mattila, K., Mauersberger, R., Booth, R. S., & Nordh, H. L. 1993, A&A, 278, 569
- (25) Hartigan, P., & Graham, J. A. 1987, AJ, 93, 913
- (26) Henning, Th., Launhardt, R., Steinacker, J., & Thamm, E. 1994, A&A, 291, 546
- (27) Henriksen, R. N., Ptuskin, V. S., & Mirabel, I. F. 1991, A&A, 248, 221
- (28) Knude, J., & Høg, E. 1998, A&A, 338, 897
- (29) Koyama, K., Hamaguchi, K., Ueno, S., Kobayashi, N., & Feigelson, E. D. 1996, PASJ, 48, L87
- (30) Lee, J.-E., et al. 2006, ApJ, 648, 491
- (31) Loinard, L., Rodríguez, L. F., D’Alessio, P., Rodríguez, M. I., & González, R. F. 2007, ApJ, 657, 916
- (32) Massi, M., Forbrich, J., Menten, K. M., Torricelli-Ciamponi, G., Neidhöfer, J., Leurini, S., & Bertoldi, F. 2006, A&A, 453, 959
- (33) Massi, M., et al. 2008, A&A, 480, 489
- (34) Miettinen, O., Kontinen, S., Harju, J., & Higdon, J. L. 2008, A&A, in press
- (35) Montmerle, T., Grosso, N., Tsuboi, Y., & Koyama, K. 2000, ApJ, 532, 1097
- (36) Mutel, R. L., Lestrade, J. F., Preston, R. A., & Phillips, R. B. 1985, ApJ, 289, 262
- (37) Neuhäuser, R., et al. 2000, A&AS, 146, 323
- (38) Nisini, B., Antoniucci, S., Giannini, T., & Lorenzetti, D. 2005, A&A, 429, 543
- (39) Nutter, D. J., Ward-Thompson, D., & André, P. 2005, MNRAS, 357, 975
- (40) Phillips, R. B., Lonsdale, C. J., & Feigelson, E. D. 1991, ApJ, 382, 261
- (41) Pravdo, S. H., Feigelson, E. D., Garmire, G., Maeda, Y., Tsuboi, Y., & Bally, J. 2001, Nature, 413, 708
- (42) Reynolds, S. P. 1986, ApJ, 304, 713
- (43) Rodríguez, L. F., Anglada, G., & Curiel, S. 1999, ApJS, 125, 427
- (44) Rodríguez, L. F., Curiel, S., Moran, J. M., Mirabel, I. F., Roth, M., & Garay, G. 1989, ApJ, 346, L85
- (45) Strom, K. M., Strom, S. E., & Grasdalen, G. L. 1974, ApJ, 187, 83
- (46) Suters, M., Stewart, R. T., Brown, A., & Zealey, W. 1996, AJ, 111, 320
- (47) Takami, M., Bailey, J., & Chrysostomou, A. 2003, A&A, 397, 675
- (48) Taylor, K. N. R., & Storey, J. W. V. 1984, MNRAS, 209, 5P
- (49) Tsujimoto, M., Koyama, K., Kobayashi, N., Saito, M., Tsuboi, Y., & Chandler, C. J. 2004, PASJ, 56, 341
- (50) van den Ancker, M. E. 1999, Ph.D. thesis, Univ. Amsterdam
- (51) Wang, H., Mundt, R., Henning, T., & Apai, D. 2004, ApJ, 617, 1191
- (52) Wilking, B. A., Greene, T. P., Lada, C. J., Meyer, M. R., & Young, E. T. 1992, ApJ, 397, 520
- (53) Wilking, B. A., McCaughrean, M. J., Burton, M. G., Giblin, T., Rayner, J. T., & Zinnecker, H. 1997, AJ, 114, 2029