Optical Spectroscopic Observations of CI Camelopardalis
Abstract
We present the results of optical spectroscopic observations of CI Cam. Double-peaked profiles were simultaneously observed for the first time in the hydrogen Balmer, He I 6678 and Fe II lines during an observational run in 2001 September. An intermediate viewing angle of the circumstellar disk around the B[e] star is consistent with our data. A significant decrease in the intensity of the H and He I lines in our 2004 September observations might have been the precursor of a line outburst at the end of 2004. The remarkable increase in the intensity of all lines and the decrease in visual brightness in 2005 might be due to the environment filling with new material ejected during the outburst. The environment of CI Cam is influenced by mass loss from the B[e] star and the outburst of its compact companion.
1 INTRODUCTION
The bright transient X-ray source XTE J0421+560 was first observed by the ASM onboard the Rossi X-ray Timing Explorer (RXTE) on 1998 March 31.64, and its peak X-ray flux reached 2.0 crab on April 1.08 (Smith et al., 1998). Harmon et al. (2004) also detected a flare in the 20-40 keV band with BATSE during the outburst. Subsequently, the X-ray flux declined rapidly, with an initial e-folding time of 0.5 days for the first 2 days, then slowing down to 2.3 days (Belloni et al., 1999). Similar flux changes during the outburst were also detected in other wavelength bands (optical, IR and radio) by Frontera et al. (1998) and Clark et al. (2000).
Hjellming et al. (1998a) identified CI Cam (MWC 84) as the optical counterpart to XTE J0421+560 just after its 1998 strong X-ray outburst. Before the outburst, CI Cam was well studied in photometric and spectroscopic observations (Allen & Swings, 1976; Downes, 1984; Bergner et al., 1995). Since the outburst in 1998, XTE J0421+560 has been an interesting transient X-ray source that has been broadly studied in multiband (from radio to -ray) observations (Hjelming et al., 1998b; Belloni et al., 1999; Clark et al., 1999, 2000; Orlandini et al., 2000; Robinson et al., 2002; Hynes et al., 2002; Miroshnichenko et al., 2002; Boirin et al., 2002; Mioduszewski & Rupen, 2004; Ishida et al., 2004). Miroshnichenko (1995) found an 11.7 day quasi period in the photometric data of CI Cam, while Barsukova et al. (2005) found a 19.4-day orbital period, based their 28-day long sets of observations. Variations with the same period were also found in the radial velocities of He II 4686. However, the nature of the outburst is not so clear due to the limited kinematical information about the donor star. Different distances from 1 to 5 kpc based on different methods have been found by different authors (Zorec, 1998; Belloni et al., 1999; Clark et al., 2000; Robinson et al., 2002; Hynes et al., 2002; Miroshnichenko et al., 2002; Mioduszewski & Rupen, 2004). With a closer distance of 1 kpc, Orlandini et al. (2000) suggested that a thermonuclear runaway on a white dwarf trigged the 1998 outburst. Ishida et al. (2004) also reached the same conclusion, that the compact object in CI Cam is a white dwarf, based on the soft component of the X-ray spectrum. However, according to the criteria for sgB[e] stars (Zickgraf et al., 1986; Lamers et al., 1998) and XTE J0421+560’s high X-ray luminosity during the outburst, Robinson et al. (2002) and Hynes et al. (2002) classified it as an sgB[e]/X-ray binary with a neutron star or a black hole. imon et al. (2006) explained the 1998 outburst as being due to thermal instability of the accretion disk, analogous to the outburst of soft X-ray transients.
A high spatial resolution Very Large Array radio image of CI Cam during outburst shows a relativistic cork-screw jet (Hjelming et al., 1998b), just like the X-ray binary SS 433. But Rupen et al. (2002) considered this result to be an artifact due to a bad calibrator. Mioduszewski & Rupen (2004) obtained radio imaging observations during and after the 1998 outburst and suggested that CI Cam is a shell-shocked X-ray nova analogous to an extragalactic supernovae formed by the collapsar mechanism.
In this paper, we present the results of optical spectroscopic observations of CI Cam from 2001 to 2005 and show its complicated environment and evolution.
2 OBSERVATIONS
We obtained the spectra of CI Cam with the 2.16m telescope at the National Astronomical Observatories, Chinese Academy of Sciences, from 2001 to 2005. The optical spectroscopy with an intermediate resolution of 1.22 was made with a CCD grating spectrograph at the Cassegrain focus of the telescope. We took red spectra covering from 5500 to 6700 and blue spectra covering from 4300 to 5500 at different times. Sometimes low-resolution spectra (covering from 4300 to 6700 ) were also obtained. The journal of our observations is summarized in Table 1, including observation date, Julian Date, wavelength range, exposure time, and spectral resolution. All spectroscopic data were reduced with the IRAF111IRAF is distributed by NOAO, which is operated by the Association of Universities for Research in Astronomy, Inc., under cooperation with the National Science Foundation. package. They were bias-subtracted and flat-field corrected, and had cosmic rays removed. Helium-argon spectra were taken in order to obtain the pixel-wavelength relations.
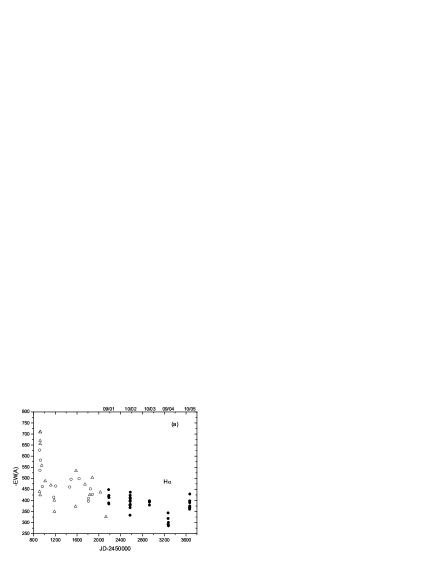
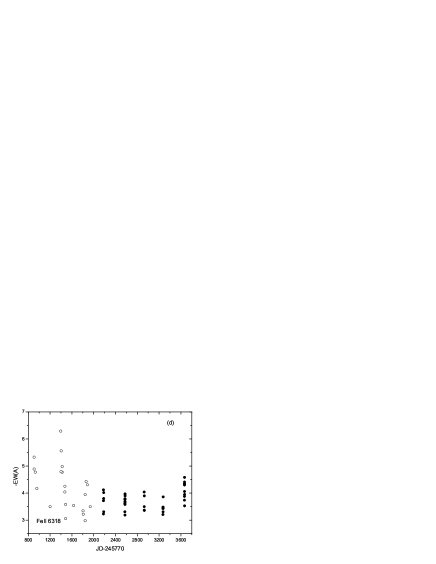
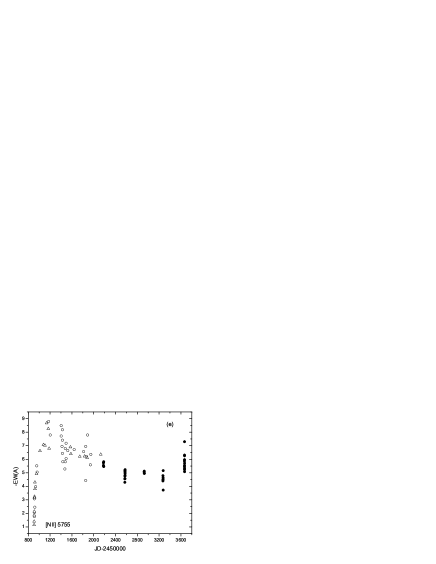
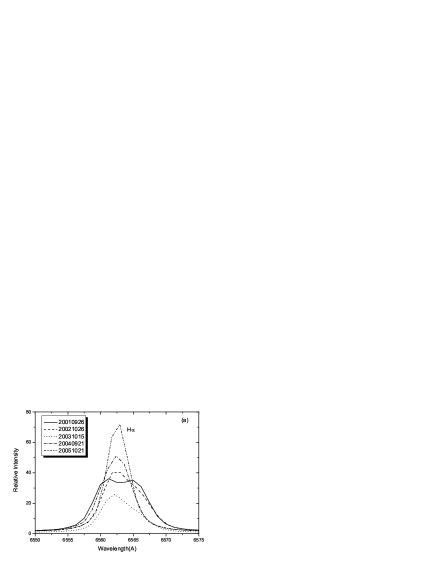
We select five typical spectra (covering the wavelength range from 6200 to 6650 ), which are plotted in Figure 1a, in order to see the evolution of the spectra of CI Cam from 2001 to 2005. All spectra have been normalized with respect to the intensity of the continuum. For comparison, we also plot the outburst spectrum of CI Cam on 1998 April 18, adapted from Hynes et al. (2002). The blue spectrum (4400-5400 ) of CI Cam on 2002 October 27 is shown in Fig. 1b. The equivalent widths (EWs) of some selected lines are listed in Table 1 and shown in Figure 2a-2e. The uncertainty of the EWs is within 5%, which mainly comes from the level determination of the continuum. In order to see the EW evolution of these lines since the 1998 outburst, we also plot the data from Barsukova et al. (2002) and Hynes et al. (2002), which are marked with open symbols in Figure 2. The evolution of visual brightness () is shown in Figure 2f and all the data in Figure 2f are adopted from Barsukova et al.(2005). We analyze our spectra and find the correlation between the variations of visual brightness(V) and our spectroscopic data.
3 ANALYSIS AND RESULTS
CI Cam has a rich emission-line spectrum with strong hydrogen Balmer, He I, and numerous Fe II lines (Figure 1a). The profiles of the hydrogen Balmer and He I lines show a single peak during the time of quiescent state. During the 1998 outburst, the strength of the Balmer and He I lines dramatically increased to 2 times their pre-outburst levels, and a weak He II 4686 emission line could be seen clearly (Wagner & Starrfield, 1998). All hydrogen Balmer lines returned to their quiescent levels within about 30 days after the outburst, while He I lines appeared to drop to a factor of 2–10 below their pre-outburst levels (Hynes et al., 2002). H showed a broad profile with a blue wing extending to at least - 2500 and Fe II lines showed a symmetric and rectangular profile with a flat top just after the 1998 outburst (Robinson et al. 2002). Hynes et al. (2002) and Miroshnichenko et al. (2002) obtained triple-peaked Fe II emission lines in their high-resolution observations. Forbidden lines such as [Fe II], [N II], [O I], and [O III] were observed in the spectrum of CI Cam. The presence of these forbidden lines indicates that the circumstellar (CS) disk material is geometrically extended so that there is a large amount of low-density gas (Lamers et al. 1998) in the outer space around CI Cam.
Some new features are present in the spectra of CI Cam from our observations from 2001 to 2005. We will discuss them in terms of emission-line profile variability and EW evolution.
3.1 The Profile Variability of Emission Lines
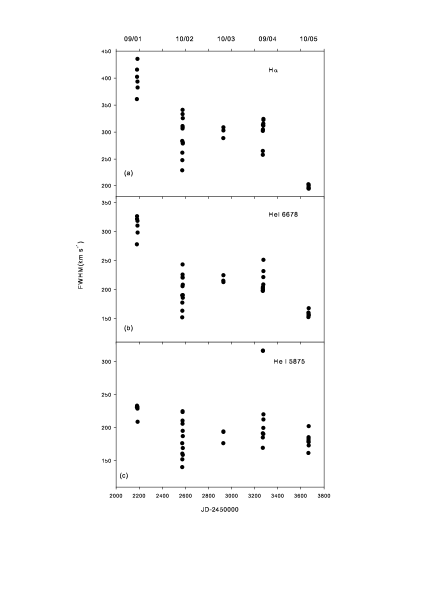
Five characteristic H profiles selected from each observational run are presented in Figure 3a. A double-peaked profile of the H emission line appears in our 2001 spectrum. In the following observational runs, the H line shows a symmetrical single-peaked profile. The profile of the He I 6678 line follows the same evolutionary parth as the H line. Their full width at half-maximum (FWHM) is plotted in Figure 4. We can see that H and He I 6678 have a larger FWHM in our 2001 spectrum than they do in 2005, while the FWHM of the He I 5876 line, with a single peak for all our spectra, has only a small variation during our 5 years of observations.
Double-peaked emission profiles are simultaneously observed in the hydrogen Balmer and He I 6678 emission lines during our 2001 observational run. Series of H and He I 6678 lines taken in 2001 are plotted in Figure 3b, 3c, and the double-peaked emission line detected on 2001 October 27 is seen in the inset of Figure 1b. To the best of our knowledge, this is the first report of the double-peaked profiles observed in the hydrogen Balmer and He I 6678 lines of CI Cam. Even when Fe II showed a double-peaked or triple-peaked profile, the Balmer lines had a single-peaked structure (Hynes et al., 2002; Miroshnichenko et al., 2002). We can see an asymmetric profile with a redshifted peak in the H emission line of 2001 September 25. In the spectrum of the next night, a second shoulder appeared on the left side of the H emission line. Several minutes later, a clear double-peaked structure with V/R1 appeared in the second spectrum on 2001 September 26. The typical profiles of the H line on 2001 September 30 are similar to those of the first line on September 26. For the last spectrum in 2001, the H emission line again showed a double-peaked profile with V/R1. Unlike the H emission line, the violet peak of He I 6678 is always higher than the red one (Figure 3c), except for the first spectrum of 2001 September 25, in which the He I 6678 line only shows an asymmetric profile with a shoulder on the left side of a redshifted single peak. The separation between the peaks or the separation between the single peak and its shoulder kept nearly constant for all the H (p=170 km ) and He I 6678 (p=209 km ) lines during our 2001 observations.
Many weak Fe II emission lines are also observed in the red and blue arms of our spectra (Figure 1a and 1b). Here we only study the uncontaminated Fe II 6318 line in detail. Figure 3(d) shows five Fe II emission lines selected from each observational run. Just like H and He I 6678, Fe II 6318 in our 2001 spectra also shows a double-peaked structure with a separation of 236 km . Moreover, asymmetric Fe II profiles are also observed during our 2002 and 2003 observations, while only single symmetric lines are observed in our 2004 and 2005 spectra.
Forbidden lines also appear in the spectra of CI Cam. As an example, we only study the forbidden lines of [N II] 5755, 6548, and 6583, due to the limited coverage of our spectrum. The [N II] 5755 line is unblended while the [N II] 6548, and 6583 lines are in the left and the right wings of the H line, respectively. The profile of the [N II] 5755 line has a single peak all the time, unlike the other lines described above. The [N II] 6548 line can be seen clearly only when the broad left wing of the H line becomes weak. The [N II] 6583 line is also mixed with the line of the C II 6583 line (A.S. Miroshnichenko 2005, private communication). With the variability of the C II 6583 line, the [N II] 6583 changes from a double-peaked profile to a single-peaked one (Figure 1a).
3.2 The EW Evolution of Selected Lines
The EW evolution of selected lines is shown in Figure 2. The EWs of H and He I 5876, 6678 show a similar temporal behavior, as shown in Fig. 2a, 2b, and 2c. Their EWs dramatically increased during the 1998 outburst, then kept declining on average. The EWs of H and He I show a remarkable decrease between our 2003 and 2004 observational runs, especially for the He I 5876 line, which had the lowest emission level since the 1998 outburst.
The EW of Fe II increased dramatically during the 1998 outburst, just like the hydrogen Balmer and He I lines (Fig. 2d). Subsequently, it declined to its pre-outburst level quickly. During our observations, its relative intensity had a subtle change on average, although it shows a fluctuation between each night within each observational run.
During the 1998 outburst, the emission level of [N II] 5755 was relatively weak. After the outburst, its relative intensity kept increasing and reached a peak in 1999 January. Since then, the EW of [N II] 5755 went through its decline phase. Until 2004, [N II] 5755 had a steady emission level that was still above its pre-outburst level.
The EWs of the lines mentioned above, even those of [N II] 5755 and Fe II 6318, had a rapid rise in 2005 October, especially the EWs of the He I 5875 and He I 6678 lines, which increased by a factor of 2.
4 DISCUSSION
4.1 The Properties of the CS Disk
CI Cam is classified as a high mass X-ray binary, with a B[e] supergiant donor star (Robinson et al., 2002; Hynes et al., 2002) surrounded by dense and absorbing CS material (Robinson et al., 2002; Boirin et al., 2002; Mioduszewski & Rupen, 2004). A CS disk around a B[e] donor star is also suggested by Hynes et al. (2002) and Miroshnichenko et al. (2002). There still exists a controversial debate on the inclination of the CS disk. Robinson et al. (2002) suggested a two-component wind model to explain their observations: a cool, low-velocity, dense, and roughly spherical ”iron wind” and a hot, high-velocity wind. Based on the fact that the Fe II emission profile changed from double-peaked to flat to double-peaked during and after the outburst, Hynes et al. (2002) put forward a unified wind model for CI Cam and concluded that most of the optical emission lines, such as H Balmer, He I and Fe II, originate from a nearly pole-on CS disk. However, Miroshnichenko et al. (2002) suggested that the disk is inclined at an intermediate angle with respect to the line of sight according to their triple-peaked Fe II emission lines. For most of the time, the H Balmer and He I lines of CI Cam showed a single-peaked profile. The double-peaked profiles of the hydrogen Balmer, He I 6678, and Fe II lines simultaneously observed in our 2001 spectra make us believe that the angle between the CS disk and the line of sight is not so small (e.g., 30∘ ), which coincides with the conclusion drawn by Miroshnichenko et al. (2002).
Double-peaked Fe II lines were observed by Hynes et al. (2002) on 2000 December 1 (JD 2,451,879). Our double-peaked hydrogen Balmer, He I 6678 and Fe II lines were observed between 2001 September 25 and 2001 October 1. At a later time Miroshnichenko et al. (2002) obtained triple-peaked Fe II lines in high-resolution spectra on 2002 January 25 and February 4. In Figure 3d, asymmetric Fe II lines can still be seen clearly in the spectra of 2002 and 2003. The variabilities of these double-peaked lines show that great changes had taken place in the disk of the B[e] star. A spherical wind is suggested during the 1998 outburst. This situation has been discussed in detail by Robinson et al. (2002) and Hynes et al. (2002). The visual brightness, which is sensitive to the density change in the CS disk, decreased after JD 2,451,200 and reached a minimum around JD 2,452,141 (2001 August). The decline of the visual brightness indicates that the density of the CS disk of CI Cam was decreasing during that period, which might be due to the dilution of the material ejected during the 1998 outburst. Moreover, the central absorption in the H line indicates that there was not sufficient emitting matter with low radial velocities to fill in the depression. Since the Fe II emission lines seem to have formed in the inner regions of the CS disk (e.g., Hanuschik 1987), they are the most likely to have double-peaked profiles.
4.2 The Line Emission Outburst
After the spectacular 1998 outburst, CI Cam rapidly went into its quiescent state. There is not any obvious change on the RXTE ASM X-ray light curve from 2001 to 2005. Due to the limitation of our observations, we could only get a glimpse at this exotic system in each year. However, we still observed some peculiar phenomena during our 5 year optical observations. Combining with the photometric observations of CI Cam, we can trace the variability of the environment of this peculiar source. A detailed study of the physical parameters of the system is beyond the scope of this paper. We only discuss some possible causes of the variability in the optical spectroscopic and photometric observations.
The EWs of H and He I 5875, 6678 had an obvious decrease between our 2003 and 2004 observations, while the visual brightness remained nearly unchanged during this period (Fig. 2(f)). From Fig. 2(a-e) we can see that the EWs of the He I lines had a steeper decrease than that of H, and the EWs of Fe II 6318 and [N II] 5755 remained constant on average between our 2003 and 2004 observations. Due to the limitation of our observational coverage, the times when the decline began and ended could not be determined. The duration of the decline was affected by the underlying physical mechanism. If the drop in the emission strength was a short-term event, it might have been due to a reduced recombination rate in the disk. One possible trigger for this reduction would be a partial loss of the stellar ionizing far-ultraviolet flux from the B[e] star; another possibility would be that the highly increased matter density (caused by ejecta, discussed below) affected the recombination conditions by shielding the stellar radiation.
If a continuous decrease in the line strength occurred between our 2003 and 2004 observations, it would likely be due to the increasing mass loss of the CS matter, which would result in a smaller CS disk. Most materials might be dispersed into the environment of the system, and a part of them would be accreted by the compact companion. The increased accretion rate should enhance the X-ray flux from the accretion disk. The absence of X-ray activity might be due to X-ray absorption by the dense environment of CI Cam.
Another interesting phenomenon observed in 2005 is that the EWs of all the lines rise, accompanied by a decrease in the visual brightness (Fig. 2). The small increas in EW of the weak Fe II and forbidden N II lines might have been caused by the decrease of the continuum in the optical range. The anti-correlation between emission level and brightness in Be stars has been discussed by Dachs (1982) and Apparao (1991). They suggested that this kind of light variation is attributed to the absorption of the central star light by the ejected material shell. Miroshnichenko et al. (2003) and Carciofi et al. (2006) also found an anti-correlation between the EW of H and visual brightness in the system of Scorpii. Miroshnichenko et al. (2003) suggested that matter ejections into the disk could strengthen the H emission and cause an increase of disk optical depth, consequently decreasing the visual brightness of the system. Carciofi et al. (2006) gave other possible reasons to explain this erratic variability, such as star light being blocked by a warped CS disk.
These scenarios can be applied to the system of CI Cam. One possibility is that a shell of material was ejected from the B[e] star as discussed above. The decrease of the line intensity in our 2004 observations might have been the precursor of the subsequent line outburst, a phenomenon similar to that seen in Centauri (Rivinius et al., 1998). The shell ejection would have resulted in a global change of the mass distribution in the system. With the expansion of the ejection, the ejected would become cool and optically thick. The B[e] star might have been obscured by this cool cloud in the line of sight, and its visual brightness began to decline around JD 2,453,351 (2004 December). The observed increase of the H and He I EWs could have been due to an enhancement of the density and volume of the line-emitting material created by the ejection.
An alternative explanation, that large amount of matter was ejected from the accretion disk around the compact object during an outburst, cannot be ruled out with certainty. The physical mechanism underlying the outburst remains under debate, although the favored scenario at present is the disk instability mechanism (DIM; see Lasota 2001 for a review). In the model of DIM, the outburst is caused by a thermal-viscous instability cycle in the accretion disk. Moreover, mass transfer variations are also an important element of the DIM.
The ejection would have occurred around JD 2,453,351 (2004 December) when the visual brightness began to decline (Fig. 2f). The outburst might have been connected with the increasing accretion rate, which might have been due to the increasing mass loss of the B[e] star or an orbital phase change of the compact object. Lots of mass would have accumulated in the accretion disk, and the DIM would have resulted in an outburst. But the RXTE ASM X-ray light curve shows that no strong X-ray outburst was observed during the phase of decrease of optical brightness that occurred in the end of 2004. The 2004 outburst might not be as strong as the 1998 outburst, and the X-ray might have been smoothed by the dense environment of the B[e] star (Mioduszewski & Rupen, 2004). The outburst could increase the density and volume of the line emitting material. Thus, the EWs of H and He I showed an obvious increase after the burst. The X-ray reprocessing into the envelope of the system might also made a contribution to the EW increase during our 2005 observations.
The ejection at the end of 2004 might also have changed the environment of CI Cam. After about 1 year’s expansion, the emitting CS disk became more extended, and the smallest FWHM of H was obtained in our 2005 observations. When the ejected materials were dispersed into the outer environment of the system, the visual brightness of CI Cam began to increase around 2006 January (see in the website of E.A. Barsukova).
5 Conclusions
We present and analyze our optical spectroscopic observations of CI Cam from 2001 to 2005. Combining with the evolution of the visual brightness, we make the following major findings about the system of CI Cam:
-
1.
The double-peaked profiles of optically thick hydrogen Balmer, He I 6678 and Fe II lines in our 2001 spectra indicate a CS disk with an intermediate inclination angle.
-
2.
Great changes have taken place in the environment of CI Cam since its 1998 strong outburst. The decrease in visual brightness and the disappearance of the central narrow emission component in the H line in 2001 indicate that matter from the outer parts of the disk (which has the lowest radial velocities) has left the system. We interpret the decrease in the intensity of H and He I lines in our 2004 observations as being due the reduction of the recombination rate in the circumstellar disk. Two possibilities are suggested for the reduction of the recombination rate. We also consider another scenario for the decrease of line intensity that the mass loss might result in a smaller circumstellar disk.
-
3.
The EW decrease of the H and He I lines in our 2004 observations might have been the precursor of the line outburst at the end of 2004. Much of the material has been ejected into the environment of CI Cam during the outburst. The B[e] star might be obscured by the ejected clouds of gas, and the visual brightness began to decrease around JD 2,453,351 (2004 December). Scenarios of ejection from the B[e] star and from the accretion disk are both considered. With the expansion of the ejecta, stronger and narrower emission lines were obtained during our 2005 observations.
The environment of CI Cam is influenced by the variabilities of the B[e] star and its compact companion. In order to unveil the secrets of this peculiar object, frequent spectroscopic and photometric observations are needed.
References
- Allen & Swings (1976) Allen, D. A., Swings, J. P. 1976, A&A, 47, 293
- Apparao (1991) Apparao, K. M. V., 1991, ApJ, 376, 256
- Barsukova et al. (2005) Barsukova, E. A., Borisov, N. V., Burenkov, A. N., et al. 2005, ATel, 416, 1
- Barsukova et al. (2002) Barsukova, E. A., Borisov, N. V., Goranskii, V. P. et al. 2002, Astron. Rep., 46, 275
- Belloni et al. (1999) Belloni, T., Dieters, S., van den Ancker, M. E., et al. 1999, ApJ, 527, 345
- Bergner et al. (1995) Bergner, Y. K., Miroshnichenko, A. S., Yudin, R. V. et al. 1995, A&AS, 112, 221
- Boirin et al. (2002) Boirin, L., Parmar, A. N., Oosterbroek, T. et al., 2002, A&A, 394, 205
- Carciofi et al. (2006) Carciofi, A. C., Miroshnichenko, A. S., Kusakin, A. V., et al. 2006, preprint(astro-ph/0603274)
- Clark et al. (2000) Clark, J. S., Miroshnichenko, A. S., Larionov, V. M., Lyuty, V. M., Hynes, R. I., et al. 2000, A&A, 356, 50
- Clark et al. (1999) Clark, J. S., Steele, I. A., Fender, R. P., & Coe, M. J. 1999, A&A, 348, 888
- Dachs (1982) Dachs J. 1982, IAUS, 98, 19D
- Downes (1984) Downes, R. A. 1984, PASP, 96, 807
- Frontera et al. (1998) Frontera, F., Orlandini, M., Amati, L., et al. 1998, A&A, 339, L69
- Hanuschik (1987) Hanuschik, R. W. 1987, A&A, 173, 299
- Harmon et al. (2004) Harmon, B. A., Wilson, C. A., Fishman, G. J., et al. 2004, ApJS, 154, 585
- Hjellming et al. (1998a) Hjellming, R. M., Mioduszewski, A. J., Robinson, E. L., et al. 1998a, IAU Circ. 6862,1
- Hjelming et al. (1998b) Hjellming, R. M., Mioduszewski, A. J., Ueda, Y., et al. 1998b, IAU Circ. 6872
- Hynes et al. (2002) Hynes, R. I., Clark, J. S., Barsukova, E. A. et al. 2002, A&A, 392, 991
- Ishida et al. (2004) Ishida, M., Morio, K., Ueda, Y. 2004, ApJ, 601,1088
- Lamers et al. (1998) Lamers, H. J. G. L. M., Zickgraf, F.-J., et al. 1998, A&A, 340, 117
- Lasota (2001) Lasota, J.-P. 2001, New A Rev., 45, 449
- Mioduszewski & Rupen (2004) Mioduszewski, A. J., Rupen M. P. 2004, ApJ, 615, 432
- Miroshnichenko (1995) Miroshnichenko, A. S. 1995, A&AT, 6, 251
- Miroshnichenko et al. (2003) Miroshnichenko, A. S., Bjorkman, K. S., et al. 2003, A&A, 408, 305
- Miroshnichenko et al. (2002) Miroshnichenko, A. S., Klochkova, V. G., Bjorkman, K. S., Panchuk, V. E. 2002, A&A, 390, 627
- Orlandini et al. (2000) Orlandini, M., Parmar, A. N., Frontera, F., et al. 2000, A&A, 356, 163
- Rivinius et al. (1998) Rivinius, Th., Baade, D., et al. 1998, A&A, 333, 125
- Robinson et al. (2002) Robinson, E. L., Ivans, I. I., & Welsh, W. F. 2002, ApJ, 565, 1169
- Rupen et al. (2002) Rupen, M. P., Mioduszewski, A. J., Hjellming, R. M. 2002, New Views on MICROQUASARS, the 4th Microquasars Workshop, Institut d’Etudes Scientifiques de Carg se, Corsica, France
- imon et al. (2006) imon, V., Bartolini, C., et al. 2006, MNRAS, 369, 355
- Smith et al. (1998) Smith, D., Remillard, R., Swank, J., et al. 1998, IAU Circ., 6855, 1
- Wagner & Starrfield (1998) Wagner, R. M., & Starrfield, S. G. 1998, IAU Circ. 6857
- Zickgraf et al. (1986) Zickgraf, F. J., Wolf, B., et al. 1986, A&A, 163, 119
- Zorec (1998) Zorec, J. 1998, in B[e] Stars, ed. A. M. Hubert, & C. Jaschek (Kluwer, Dordrecht), 1


| 1 | 2 | 3 | 4 | 5 | 6 | 7 | 8 | 9 | 10 |
|---|---|---|---|---|---|---|---|---|---|
| 20010925 | 2452178.303 | 5550-6750 | 600 | 1.2 | 449.02 | 44.30 | 25.37 | 4.12 | 5.75 |
| 20010926 | …2179.300 | 5550-6750 | 600 | 1.2 | 389.17 | 48.75 | 25.81 | 3.72 | 5.55 |
| 20010926 | …2179.305 | 5550-6750 | 200 | 1.2 | 419.31 | 47.77 | 30.21 | 3.23 | 5.74 |
| 20010927 | …2180.308 | 4300-5500 | 600 | 1.2 | - | - | - | - | - |
| 20010930 | …2183.308 | 5550-6750 | 600 | 1.2 | 384.67 | 49.02 | 28.91 | 3.80 | 5.48 |
| 20010930 | …2183.313 | 5550-6750 | 200 | 1.2 | 412.88 | 50.56 | 28.31 | 3.31 | 5.82 |
| 20011001 | …2184.316 | 5550-6750 | 200 | 1.2 | 422.86 | 48.85 | 31.27 | 4.02 | 5.46 |
| 20021023 | …2571.262 | 5550-6750 | 500 | 1.2 | 333.61 | 35.43 | 20.93 | 3.61 | 4.55 |
| 20021023 | …2571.266 | 5550-6750 | 100 | 1.2 | 381.18 | 45.92 | 30.15 | 3.31 | 4.30 |
| 20021024 | …2572.301 | 5550-6750 | 400 | 1.2 | 367.72 | 42.31 | 26.83 | 3.68 | 4.57 |
| 20021024 | …2572.305 | 5550-6750 | 200 | 1.2 | 377.83 | 46.17 | 29.25 | 3.79 | 4.76 |
| 20021026 | …2574.236 | 5550-6750 | 500 | 1.2 | 413.19 | 43.96 | 27.15 | 3.58 | 4.81 |
| 20021026 | …2574.241 | 5550-6750 | 200 | 1.2 | 423.44 | 48.48 | 26.51 | 3.97 | 5.16 |
| 20021026 | …2574.328 | 5550-6750 | 200 | 1.2 | 400.01 | 45.70 | 27.74 | 3.19 | 4.78 |
| 20021026 | …2574.333 | 5550-6750 | 500 | 1.2 | 395.61 | 47.60 | 28.20 | 3.76 | 5.14 |
| 20021027 | …2575.150 | 4300-5500 | 300 | 1.2 | - | - | - | - | - |
| 20021027 | …2575.200 | 4300-5500 | 1000 | 1.2 | - | - | - | - | - |
| 20021027 | …2575.278 | 5550-6750 | 400 | 1.2 | 409.26 | 45.23 | 28.12 | 3.78 | 5.05 |
| 20021028 | …2576.379 | 5550-6750 | 100 | 1.2 | 409.33 | 47.12 | 29.33 | 3.67 | 5.18 |
| 20021028 | …2576.270 | 5550-6750 | 300 | 1.2 | 382.38 | 43.39 | 27.16 | 3.97 | 5.23 |
| 20021028 | …2576.275 | 5550-6750 | 200 | 1.2 | 437.21 | 48.55 | 29.96 | 3.90 | 4.95 |
| 20031014 | …2927.285 | 5550-6750 | 400 | 1.2 | 398.34 | 49.57 | 31.15 | 4.04 | 5.06 |
| 20031015 | …2928.333 | 5550-6750 | 300 | 1.2 | 393.13 | 48.11 | 29.59 | 3.37 | 5.10 |
| 20031015 | …2928.335 | 5550-6750 | 60 | 1.2 | 379.38 | 50.08 | 30.20 | 3.50 | 5.12 |
| 20031016 | …2929.224 | 4300-6700 | 50 | 2.4 | 395.32 | 46.36 | - | 3.90 | 4.95 |
| 20031016 | …2929.226 | 4300-6700 | 50 | 2.4 | 397.33 | 46.42 | - | 3.36 | 4.98 |
| 20040921 | …3270.311 | 5550-6750 | 1500 | 1.2 | 291.88 | 27.87 | 20.22 | 3.43 | 4.49 |
| 20040921 | …3270.326 | 5550-6750 | 900 | 1.2 | 318.73 | 31.34 | 21.27 | 3.48 | 4.79 |
| 20040921 | …3270.334 | 5550-6750 | 300 | 1.2 | 344.19 | 29.48 | 21.54 | 3.21 | 4.40 |
| 20040925 | …3274.323 | 5550-6750 | 800 | 1.2 | 289.26 | 30.12 | 23.08 | 3.48 | 4.64 |
| 20040925 | …3274.330 | 5550-6750 | 300 | 1.2 | 290.90 | 29.69 | 21.95 | 3.31 | 4.52 |
| 20040926 | …3275.293 | 5550-6750 | 300 | 1.2 | 285.85 | 22.07 | 19.14 | 3.44 | 5.16 |
| 20040926 | …3275.297 | 5550-6750 | 200 | 1.2 | 300.97 | 19.72 | 19.12 | 3.86 | 3.72 |
| 20051021 | …3665.348 | 5550-6750 | 400 | 1.2 | 360.54 | 53.09 | 33.29 | 3.74 | 5.87 |
| 20051021 | …3665.352 | 5550-6750 | 200 | 1.2 | 370.84 | 57.49 | 36.39 | 3.88 | 5.45 |
| 20051023 | …3667.232 | 4300-6700 | 50 | 2.4 | 368.01 | 58.21 | 36.3 | 4.41 | 5.97 |
| 20051023 | …3667.234 | 4300-6700 | 30 | 2.4 | 397.80 | 61.46 | 39.34 | 4.35 | 5.55 |
| 20051023 | …3667.235 | 4300-6700 | 100 | 2.4 | 363.11 | 67.01 | 37.35 | 4.58 | 6.26 |
| 20051023 | …3667.342 | 5550-6750 | 200 | 1.2 | 390.25 | 60.11 | 42.92 | 4.30 | 5.23 |
| 20051023 | …3667.344 | 5550-6750 | 100 | 1.2 | 398.08 | 60.72 | 39.33 | 4.06 | 6.31 |
| 20051023 | …3667.345 | 5550-6750 | 60 | 1.2 | 368.82 | 57.52 | 37.30 | 4.31 | 7.30 |
| 20051024 | …3668.290 | 5550-6750 | 200 | 1.2 | 375.34 | 46.83 | 39.19 | 3.53 | 5.08 |
| 20051024 | …3668.292 | 5550-6750 | 100 | 1.2 | 373.91 | 64.16 | 41.26 | 3.95 | 5.71 |
| 20051024 | …3668.294 | 5550-6750 | 100 | 1.2 | 429.34 | 64.69 | 40.18 | - | 5.33 |
| 20051027 | …3671.296 | 4300-5500 | 200 | 1.2 | - | - | - | - | - |
| 20051027 | …3671.305 | 4300-5500 | 1000 | 1.2 | - | - | - | - | - |
Because of the difficulty in determining the level of continuum and contamination by other lines, the statistical errors are not given in the table.