119–126
Toward a homogeneous set of transiting planet parameters
Abstract
With 40 or more transiting exoplanets now known, the time is ripe to seek patterns and correlations among their observed properties, which may give important insights into planet formation, structure, and evolution. This task is made difficult by the widely different methodologies that have been applied to measure their properties in individual cases. Furthermore, in many systems our knowledge of the planet properties is limited by the knowledge of the properties of the parent stars. To address these difficulties we have undertaken the first comprehensive analysis of the data for 23 transiting planets using a uniform methodology. We revisit several of the recently proposed correlations, and find new ones involving the metallicity of the parent stars.
keywords:
Planetary systems, stars: evolution, stars: fundamental parameters, techniques: spectroscopic, techniques: photometric1 Introduction
Most of our knowledge about the structure, atmospheric properties, and other physical characteristics of extrasolar planets has come from the study of those that transit their parent stars. The pace of discovery of transiting planets has increased rapidly over the last year or so, and at the time of this writing there are nearly 40 systems with detailed studies in the literature, along with several more that have been announced recently. The time is ripe to seek patterns and correlations among their observed properties, which may give important insights into planet formation, structure, and evolution.
Several such relations have already been proposed. Unfortunately, our ability to gauge their reliability or to find new ones is made difficult by the widely different methodologies that have been applied by individual investigators to measure the properties of the planets and their parent stars. Furthermore, in many cases our knowledge of the planet properties is limited by the knowledge of the properties of the stars themselves, as surprising as this may seem. The latter properties are usually determined with the help of stellar evolution models, but not always have the best constraints been applied consistently. In particular, for the majority of transiting systems without a parallax determination, the weakly constrained surface gravity of the star determined spectroscopically has often been used as a proxy for luminosity. A much better constraint related to the mean stellar density is available directly from the light curves ([Sozzetti et al.(2007), Sozzetti et al. 2007]), but has generally been overlooked.
To address these difficulties we have undertaken the first comprehensive analysis of the data for 23 transiting planets using a uniform methodology ([Torres et al.(2008), Torres et al. 2008]). We describe our procedures here, along with a few highlights of our findings.
2 Methodology
Our efforts to re-analyze the data for all transiting planets are focused on three main areas:
Stellar atmosphere parameters: We have merged all existing determinations of the stellar temperature () and metallicity ([Fe/H]) of the parent stars, with careful consideration of systematic errors in computing the weighted averages. These represent the best available values for these stars based on current knowledge.
Light curves: The highest-quality light curves available to us for each system have been re-analyzed in a uniform way, using the Markov Chain Monte Carlo algorithm. We have accounted for the effects of red noise in weighting the data, to provide more realistic uncertainties for the three light-curve parameters. These are (the planet-to-star radius ratio), (the impact parameter), and (the normalized separation), where is the semimajor axis of the orbit.
Stellar parameters: We used stellar evolution models from the Yonsei-Yale series ([Yi et al.(2001), Yi et al. 2001]) to determine the mass () and radius () of all parent stars in a uniform way. The constraints we used to place the stars on the H-R diagram are , [Fe/H], and the mean stellar density (). The density is related to the light-curve parameter as
| (1) |
where is the orbital period and the second term on the right is typically negligible. The resulting masses and radii were checked against those from two other sets of stellar evolution models ([Girardi et al.(2000), Girardi et al. 2000]; [Baraffe:08, Baraffe et al. 1998]), and were found to be in excellent agreement.
3 Results
From the reanalysis of the data for 23 transiting systems we have obtained a more homogeneous set of stellar and planetary parameters than previously available, with error bars that are well understood and more appropriate when searching for patterns and correlations among the various quantities. With these results we have revisited several of the recently proposed correlations, of which we illustrate two here.
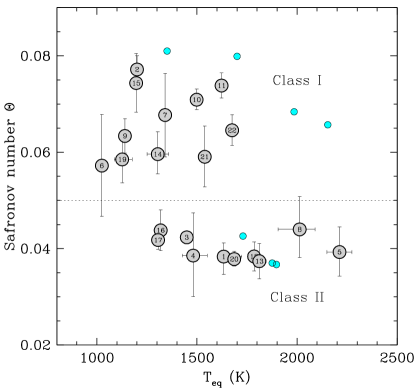
One is an apparent dichotomy in the properties of transiting planets according to their Safronov numbers, advanced by [Hansen & Barman(2007), Hansen & Barman (2007)]. The Safronov number is a measure of the ability of a planet to gravitationally scatter other bodies, and is defined as , the ratio between the escape velocity and the orbital velocity squared. Figure 1 shows as a function of each planet’s zero-albedo equilibrium temperature, which we compute as (assuming that the heat redistribution factor is common to all planets, in the absence of more complete knowledge). The conspicuous gap between “Class I” and “Class II” planets noted by Hansen & Barman is reinforced with the addition of the new planets in our study, and the clustering of the Class II planets is tightened. We also find that Class II planets orbit stars that are slightly more metal rich than those of Class I, on average, by 0.2 dex in [Fe/H].
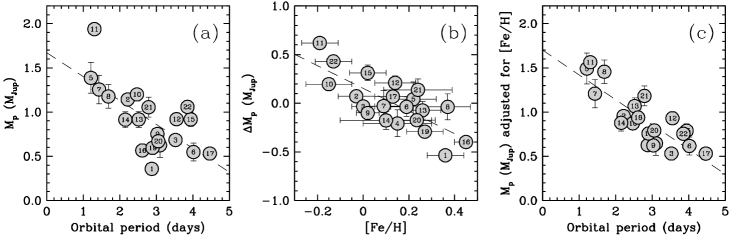
[Mazeh et al.(2005), Mazeh et al. (2005)] and [Gaudi et al.(2005), Gaudi et al. (2005)] pointed out a correlation between the masses of transiting planets and their orbital periods. This relation has held up as more transiting planets have been discovered, although the scatter has increased. We have found evidence for a new pattern within the scatter about this correlation: planets around metal-poor stars are more massive than those around metal-rich stars at a given orbital period (see Figure 2). This can be interpreted as evidence of a (mass and) metallicity dependence of the migration process. Alternatively, it may be seen as indirect support for the correlation between core size and [Fe/H] ([Guillot et al.(2006), Guillot et al. 2006]; [Burrows et al.(2007), Burrows et al. 2007]) along with the idea that the presence of such cores slows down or prevents complete evaporation of the planets in the extreme radiation environments of these hot Jupiters. A related correlation between the planetary surface gravity (a quantity that is virtually independent of the stellar mass and radius) and orbital period has been pointed out previously by [Southworth et al.(2007), Southworth et al. (2007)]. We find that this correlation is also present in our larger sample, but the scatter about the relation does not show as clear a dependence on metallicity, possibly because of the influence of [Fe/H] on the planetary radii.
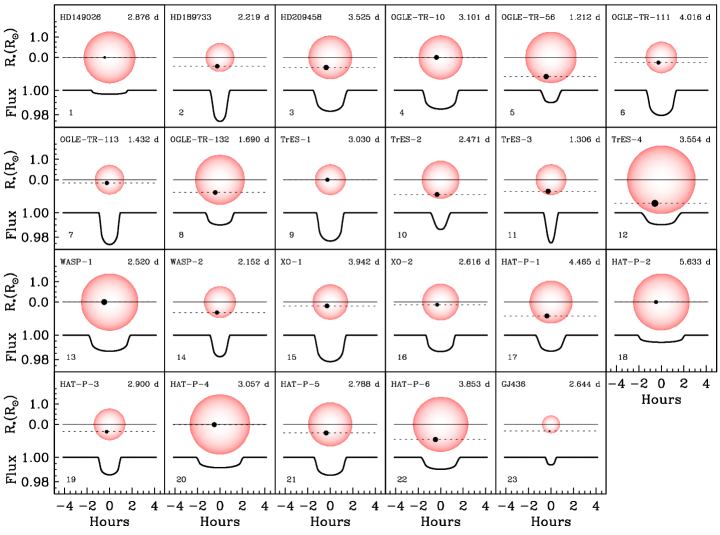
The figure shown below is a visual summary of our derived stellar and planetary properties. The period of each system is indicated. Stars and planets are shown to scale, emphasizing the wide range of stellar types probed by the photometric searches. The equatorial plane is indicated with a solid horizontal line, and the dotted lines represent the trajectory of each planet at their measured impact parameter. The light curves underneath are computed for the band, and are all on the same vertical and horizontal scale to facilitate the comparison.
Through the procedures described above we have obtained a more homogeneous set of stellar and planetary parameters than previously available. We expect that the application of similar methods to future discoveries will make it easier to search for other significant correlations among those parameters that should lead to a deeper understanding of the nature of extrasolar planets.
References
- [Baraffe et al.(1998)] Baraffe, I., Chabrier, G., Allard, F., & Hauschildt, P. H. 1998, A&A, 337, 403
- [Burrows et al.(2007)] Burrows, A., Hubeny, I., Budaj, J., & Hubbard, W. B. 2007, ApJ, 661, 502
- [Gaudi et al.(2005)] Gaudi, B. S., Seager, S., & Mallén-Ornelas, G. 2005, ApJ, 623, 472
- [Girardi et al.(2000)] Girardi, L., Bressan, A., Bertelli, G., & Chiosi, C. 2000, A&AS, 141, 371
- [Guillot et al.(2006)] Guillot, T., Santos, N. C., Pont, F., Iro, N., Melo, C., & Ribas, I. 2006, A&A, 453, L21
- [Hansen & Barman(2007)] Hansen, B. M. S., & Barman, T. 2007, ApJ, 671, 861
- [Mazeh et al.(2005)] Mazeh, T., Zucker, S., & Pont, F. 2005, MNRAS, 356, 995
- [Southworth et al.(2007)] Southworth, J., Wheatley, P. J., & Sams, G. 2007, MNRAS, 379, L11
- [Sozzetti et al.(2007)] Sozzetti, A., Torres, G., Charbonneau, D., Latham, D. W., Holman, M. J., Winn, J. N., Laird, J. B., & O’Donovan, F. T. 2007, ApJ, 664, 1190
- [Torres et al.(2008)] Torres, G., Winn, J. N., & Holman, M. J. 2008, ApJ, 677, 1324
- [Yi et al.(2001)] Yi, S. K., Demarque, P., Kim, Y.-C., Lee, Y.-W., Ree, C. H., Lejeune, T., & Barnes, S. 2001, ApJS, 136, 417