Origin of the Temperature Oscillation in Turbulent Thermal Convection
Abstract
We report an experimental study of the three-dimensional spatial structure of the low-frequency temperature oscillations in a cylindrical Rayleigh-Bénard convection cell. Through simultaneous multipoint temperature measurements it is found that, contrary to the widely accepted scenario, thermal plumes are emitted neither periodically nor alternatively, but randomly and continuously, from the top and bottom plates. We further identify a new flow mode—the sloshing mode of the large scale circulation (LSC). This sloshing mode, together with the torsional mode of the LSC, are found to be the origin of the oscillation of the temperature field.
pacs:
47.27.-i, 44.25.+f, 05.65.+bThermal convection is a phenomenon that occurs widely in nature and in many industrial processes Kadanoff (2001). A paradigm to study the generic convection phenomenon is the Rayleigh-Bénard (RB) system Ahlers et al. . A fascinating feature of turbulent RB convection is the emergence of a well-defined coherent oscillation in the presence of turbulent background. This robust oscillation has been observed in both the temperature cas and velocity fields qiu (a), and in convection systems with different fluids cas ; san (a); Brown et al. and different geometries Niemela and Sreenivasan (2006); du Puits et al. (2007); Zhou et al. (2007). Although much effort has been devoted to the study of this phenomenon in the past cas ; Villermaux (1995); Cioni et al. (1997), the nature of this oscillation remains unsettled. It has been proposed that this oscillation is due to the periodic emission of thermal plumes from the top and bottom boundary layers of the system, which are coupled by the large-scale circulation (LSC) Villermaux (1995). In this scenario, plume emission due to boundary layer instability in one plate is triggered by the arrival of thermal plumes from the other plate, which implies that plumes are emitted not only periodically but also alternatively between the top and bottom plates. Some later experimental studies appear to support this picture and periodic plume emission has since been attributed to be the source of the observed temperature and velocity oscillations in the bulk fluid Ciliberto et al. (1996); Qiu and Tong ; san (b); Sun et al. (2005). In addition to the apparent oscillations observed for temperature and velocity in the vertical circulation plane of the LSC, horizontal oscillations of the velocity field have also been observed Funfschilling and Ahlers ; Xi et al. (2006); res and it has been suggested that periodic plume emission is not necessary for the horizontal oscillation of the bulk fluid Funfschilling and Ahlers ; res . Recently, it is conjectured that the local temperature oscillations may be caused by the torsional motion of the LSC Ahlers et al. . The conjecture, which could explain the oscillation near the top and bottom plate, is unable to explain that observed at the mid-height plane, since, by symmetry, the torsional oscillations cancel out at the mid-height plane. We also note that the experimental studies that appear to show evidence of periodic plume emissions are two-dimensional (2D) measurements Ciliberto et al. (1996); Qiu and Tong ; san (b); Sun et al. (2005). With the LSC’s twisting oscillation near the top and bottom plates and its azimuthal meandering Funfschilling and Ahlers ; Xi et al. (2006); Brown and Ahlers (2006), three-dimensional (3D) measurements become essential to unlock the intricate flow dynamics.
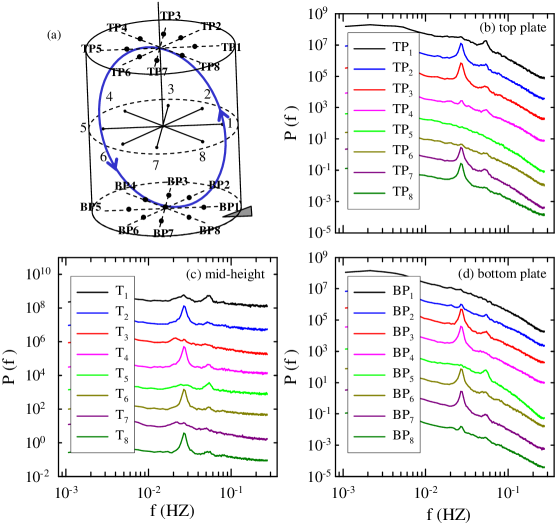
In this Letter, we present 3D measurements of the temperature oscillations in a cylindrical convection cell of aspect ratio unity. Local temperatures are measured simultaneously by 24 probes placed inside the convecting fluid and embedded in the top and bottom plates. These measurements reveal the origin of the temperature oscillation in the system and shed light on the driving mechanism of its flow dynamics. The experiment was conducted in a RB convection cell that has been described elsewhere Sun et al. (2005). Briefly it is a vertical cylinder of height H = 19.0 cm and diameter D = 19.0 cm, with upper and lower copper plates and Plexiglas sidewall. Water was used as the working fluid and measurements were made at the Rayleigh number Ra = 1.7 and 5.0 , with Prandtl number Pr = 5.3. As the two measurements give the same qualitative results, only results for Ra = 5.0 will be presented. Local temperatures in the fluid are measured by 8 thermistors of 300 m in diameter. As shown in Fig. 1(a), these thermistors are mounted on a star-shaped frame made of mm diameter stainless steel tube. They have an equal azimuthal separation and have a distance of 1 cm from the sidewall, where the main ascending and descending flows are passing through Sun et al. (2005). The frame is soldered perpendicularly to a mm diameter stainless steel tube and can thus traverse vertically along the central axis of the cell. The thermistors are labelled as 1, 2, … 8, which also represent their azimuthal positions. The temperatures in the top and bottom plates were measured by 16 thermistors of mm in diameter [shown as solid circles in Fig. 1 (a)]. Eight of them are embedded in the top plate at half radius from the plate center and about mm away from the fluid contact interface at positions TP1 to TP8; while the other eight are similarly embedded in the bottom plate at positions BP1 to BP8. To lock the azimuthal orientation of the LSC steadily, we tilted the convection cell with at position 1. Temperatures of the 8 small thermistors and 16 large thermistors are measured simultaneously by a -digit multimeter at a data rate of 0.55sec.
Figures 1(b) and (d) plot the frequency power spectra of the temperatures measured by the embedded thermistors in the top and bottom plates, respectively. Due to the finite thermal diffusivity of the plates, when a hot (cold) plume is emitted from the bottom (top) plate, it leaves a cold (hot) spot there for a finite time before the temperature recovers to the previous value by conduction. Similarly, when a hot (cold) plume impinge the top (bottom) plate, it will heat (cool) fluid in the boundary layer and leave a thermal imprint there. It has been shown in previous experiments that thermistors embedded in the plates are able to capture signatures of these plume departures and arrivals Cioni et al. (1997); Sun and Xia (2007). The prominent peaks in the power spectra near Hz) correspond to the same oscillation frequency (for the same Ra) measured in many previous studies both in the fluid and in the plates cas ; san (a); Ciliberto et al. (1996); Cioni et al. (1997); Qiu and Tong . It is seen from the figures that strong oscillations are observed at positions TP2, TP3, TP7, and TP8, where the hot ascending flow arrives at the top plate, and at positions BP3, BP4, BP6, and BP7, where the cold descending flow arrives at the bottom plate. On the other hand, no significant oscillation is observed at positions TP4, TP5, and TP6, where cold plumes are emitted, and at positions BP1, BP2, and BP8, where hot plumes are emitted. These results show clearly that there is no temperature oscillation at positions where plumes are emitted. Furthermore, if the plumes are not emitted periodically, then the oscillations observed at positions where plumes arrive from the opposite plate must originate in the bulk.
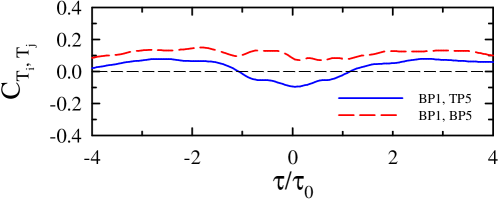
An important feature of the models that attribute the origin of temperature oscillations to the periodic emission of thermal plumes from the boundary layer is that emission of the hot (cold) plumes is triggered by arrival of cold (hot) plumes and thus hot and cold plumes are emitted alternatively from the bottom and top plates with a time separation equals to half of the oscillation period. To test this, we examine the phase relationships between the temperatures measured in the plates, which can be obtained from the cross-correlation function of the measured temperatures: , where and are the standard deviations of the two quantities respectively. Figure 2 shows the cross-correlation function between temperatures measured at the positions BP1 and TP5, where hot and cold plumes are emitted respectively. If the hot and cold plumes are shed alternatively from the bottom and the top plates, the cross-correlation function should have strong negative peaks at , with the approximate time for plumes to traverse the height of the cell (here sec). As shown in the figure the correlation is very weak and there is no negative peaks at , but a negative peak at . A negative peak at means that the hot and cold plumes are shed simultaneously. Also plotted in Fig. 2 is the cross-correlation function between temperatures measured at BP1 and BP5, the positions where in the bottom plate hot plumes depart and cold ones arrive, respectively. If the arrival of the cold plumes at BP5 triggers the emission of the hot plumes at position BP1, the cross-correlation function will have a strong positive peak near , which is clearly not the case as shown in the figure.
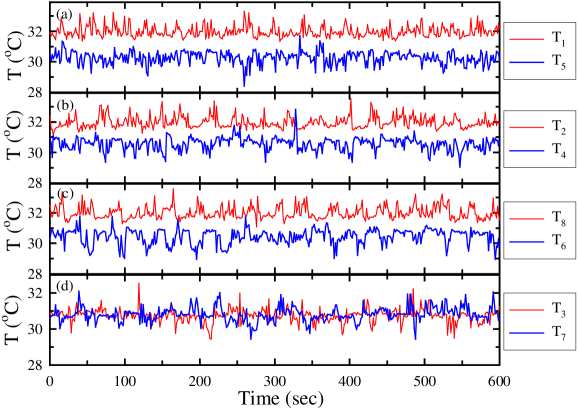
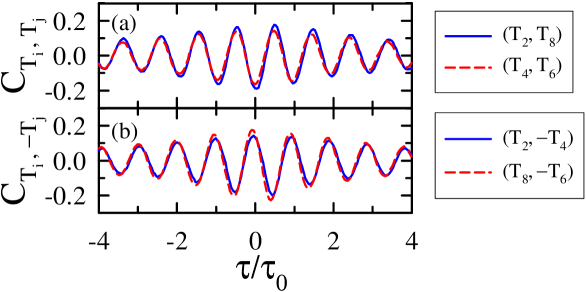
Figure 1(c) shows the power spectra of the individual temperatures to measured in the bulk fluid at the mid-height (H/2) plane by the 8 small thermistors. The prominent peaks in the power spectra have the same frequency as in Figs. 1(b) and (d). It is seen that no significant oscillations are observed at positions 1 and 5, which are within the circulation plane of the LSC. On the other hand, strong oscillations are present at positions 2, 4, 6 and 8. To understand why oscillation is present at some positions while absent in others at the mid-height plane, we plot in Fig. 3 segments of time traces of to . It can be seen that at positions 1, 2, 8 positive spikes dominate, suggesting hot plumes are ascending at these positions. At positions 4, 5 and 6 negative spikes dominate, suggesting cold plumes are descending there. At positions 3 and 7, both hot plumes and cold plumes are present. These temperature signals are consistent with a coherent large scale circulatory flow with a band of about half a diameter wide. To examine the phase relationships between the 8 temperature signals, we study their cross-correlation functions. Figure 4(a) shows the cross-correlations between the pair and between the pair. The peak of () near indicates that the hot (cold) fluids pass the positions and ( and ) alternatively with a time delay of . We calculate for a pair of thermistors when one of them mainly senses the upward spikes and the other mainly downward spikes. Figure 4(b) plots and and the peak near indicates that the hot fluids pass and cold ones pass simultaneously. Similar relationship exists between positions and 8. Simultaneous presence of hot bursts at position 2 (8) and cold bursts at position 4 (6) is another evidence that hot and cold plumes are not emitted alternatively. The phase relationships above could also be observed from the temperature time traces shown in Fig. 3. Together, these results suggest a horizontal oscillation of the bulk fluid along the direction perpendicular to the vertical plane containing positions 1 and 5. In this off-center or sloshing mode of the bulk fluid, hot ascending fluid oscillates between positions 2 and 8 and cold descending fluid oscillates between positions 4 and 6, and this explains why the oscillation strength at these positions are approximately the same [Fig. 1(c)]. It should be noted that signatures of this sloshing mode has been observed by Qiu et al. qiu (b) in a previous local velocity measurements, who found that the strongest oscillation occurs in the direction perpendicular to the LSC plane.
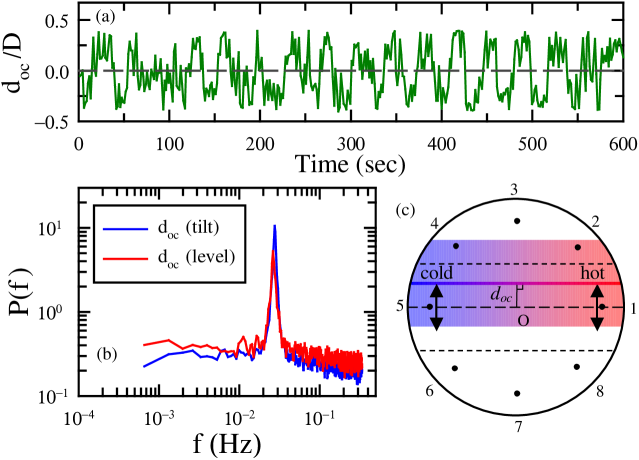
To study the sloshing oscillation of the bulk fluid quantitatively, we determine the hottest and coldest azimuthal positions of the bulk fluid along the sidewall from the instantaneous azimuthal temperature profile measured by the 8 thermistors at the mid-height plane. These positions are determined by making a quadratic fit around the hottest and coldest temperature readings respectively tob . The line connecting these two positions is the central line of the LSC band. The orientation of this line is the orientation of the LSC’s vertical circulating plane, which is found to be very similar to that obtained by fitting a cosine function to the instantaneous azimuthal temperature profile tob . We define the distance between this line and the cell’s central vertical axis as the off-center distance , which exhibits a periodic oscillation with an amplitude about of the cell diameter [Fig. 5(a)]. Figure 5(b) shows the power spectrum of , which has a peak at ( Hz). Also plotted in the figure is the power spectrum of when the cell is levelled. It shows that the sloshing mode exists in both tilted and levelled cases and that it is not a result of the LSC being locked in a fixed azimuthal orientation. Figure 5(c) draws schematically this sloshing mode of the bulk fluid at mid-height plane based on the measured properties of . This picture confirms some of the above conclusions inferred from the properties of cross-correlation functions between the local temperature probes. For example, it is seen that due to this periodical sloshing motion of the LSC, the thermistors at positions 2 and 8 (positions 4 and 6) will alternatively experience the hot ascending (cold descending) flow. For the positions 1 and 5, as the LSC has a width of roughly half cell diameter, they will always experience the hot ascending and cold descending flow but the degree of ‘hot’ and ‘cold’ varies due to the off-center oscillation. This explains the very weak peak at in the power spectra of and . The peak at 2 of these spectra is due to the fact that within one period of the off-center motion the central line of the LSC crosses the (1,5) plane twice. From Fig. 5 (c) it is seen that the positions 3 and 7 are farthest from the band of LSC and so they can barely sense the bulk off-center oscillation. This is evidenced by the barely visible peaks at in the power spectra of and .
Some of the features observed by the thermistors embedded in plates can also be understood now. The oscillation with frequency at positions TP2, TP3, TP7, TP8, BP3, BP4, BP6 and BP7, and the oscillation with frequency at positions TP1 and BP5 are due to the the sloshing plus twisting motion of LSC. On the other hand, no significant oscillation is seen at positions BP1, BP2, BP8, TP4, TP5 and TP6. But when we placed the 8 small thermistors very near (3 mm) the bottom plates, positions 2 and 8 have strong oscillations. This is because that the horizontal positions of the plumes are modulated by the flow field only after they leave the respective plates and are thus not sensed by the embedded probes. This is a further evidence that the temperature oscillation does not originate from the boundary layers. It may be noted that some recent models of the LSC dynammics res ; Brown and Ahlers have ignored the thermal boundary layer and the plumes. Thus, these models could in principle be modified to explain the results reported here.
With the above picture, we can understand the reason why some earlier measurements made in a 2D plane appear to observe that thermal plumes are emitted periodically. In the present experiment the orientation of the LSC is locked steadily in the plane by tilting the cell with a angle so that it has a very small range of azimuthal angular fluctuation ( 8.5∘). In some of the previous studies that observed temperature oscillations within the plane of the LSC, the convection cell was titled by lass than 1∘ Qiu and Tong ; qiu (b); Sun et al. (2005). When we tilted our cell by it is found that the LSC is able to explore much broader azimuthal range ( 22.6∘) Ahlers et al. (2006). When this azimuthal meandering is combined with the sloshing motion the LSC band could leave and return to the (1,5) plane so that the alternative occurrence of the hot and cold bursts in and can be observed. In fact in this case temperature oscillations at all 8 positions can be observed tob . Therefore the alternate appearance of hot and cold bursts at positions of 1 and 5 when the azimuthal orientation of the LSC is not steadily locked can be understood as a result of the horizontal motion of hot ascending and cold descending fluids being modulated by the sloshing mode. To conclude, our simultaneous multipoint temperature measurements show directly and convincingly that thermal plumes are emitted neither periodically nor alternatively from the top and bottom plates and that temperature oscillations are caused by the sloshing mode and the torsional mode of the velocity field in the central and boundary layer regions of the system, respectively.
We gratefully acknowledge support of this work by the Hong Kong Research Grants Council under Grant Nos. CUHK 403806 and 404307.
References
- Kadanoff (2001) L. P. Kadanoff, Phys. Today 54(8), 34 (2001).
- (2) G. Ahlers, S. Grossmann, and D. Lohse, Rev. Mod. Phys. in press (2009).
- (3) B. Castaing et al., J. Fluid Mech. 204, 1 (1989); M. Sano and X.-Z. Wu and A. Libchaber, Phys. Rev. A, 40, 6421, (1989).
- qiu (a) X.-L. Qiu and S.-H. Yao and P. Tong, Phys. Rev. E 61, R6075 (2000); X.-D. Shang and K.-Q. Xia, Phys. Rev. E 64, 065301(R) 2001.
- san (a) T. Takeshita et al., Phys. Rev. Lett. 76, 1465 (1996); S. Ashkenazi and V. Steinberg, Phys. Rev. Lett. 83, 3641 (1999); J. J. Niemela et al., J. Fluid Mech. 449, 169 (2001).
- (6) E. Brown, D. Funfschilling, and G. Ahlers, J. Stat. Mech. P10005 (2007).
- Niemela and Sreenivasan (2006) J. J. Niemela and K. R. Sreenivasan, J. Fluid Mech. 557, 411 (2006).
- du Puits et al. (2007) R. du Puits, C. Resagk, and A. Thess, Phys. Rev. E 75, 016302 (2007).
- Zhou et al. (2007) S.-Q. Zhou, C. Sun, and K.-Q. Xia, Phys. Rev. E 76, 036301 (2007).
- Villermaux (1995) E. Villermaux, Phys. Rev. Lett. 75, 4618 (1995).
- Cioni et al. (1997) S. Cioni, S. Ciliberto, and J. Sommeria, J. Fluid Mech. 335, 111 (1997).
- Ciliberto et al. (1996) S. Ciliberto, S. Cioni, and C. Laroche, Phys. Rev. E 54, R5901 (1996).
- (13) X.-L. Qiu and P. Tong, Phys. Rev. Lett. 87, 094501 (2001); Phys. Rev. E 66, 026308 (2002).
- san (b) Y. Tsuji et al., Phys. Rev. Lett. 94, 034501 (2005).
- Sun et al. (2005) C. Sun, K.-Q. Xia, and P. Tong, Phys. Rev. E 72, 026302 (2005).
- (16) D. Funfschilling and G. Ahlers, Phys. Rev. Lett. 92, 194502 (2004); D. Funfschilling, E. Brown and G. Ahlers, J. Fluid Mech. 607, 119 (2008).
- Xi et al. (2006) H.-D. Xi, Q. Zhou, and K.-Q. Xia, Phys. Rev. E 73, 056312 (2006).
- (18) C. Resagk et al., Phys. Fluids 18, 1095105 (2006).
- Brown and Ahlers (2006) E. Brown and G. Ahlers, J. Fluid Mech. 568, 351 (2006).
- Sun and Xia (2007) C. Sun and K.-Q. Xia, J. Fluid Mech. 570, 479 (2007).
- qiu (b) X.-L. Qiu et al., Phys. Fluids 16, 412 (2004).
- (22) Q. Zhou et al., eprint arXiv:0808.1171.
- (23) E. Brown and G. Ahlers, Phys. Rev. Lett. 98, 134501 (2007); Phys. Fluids 20, 075101 (2008).
- Ahlers et al. (2006) G. Ahlers, E. Brown, and A. Nikolaenko, J. Fluid Mech. 557, 347 (2006).