Spatially resolving the hot CO around the young Be star 51 Ophiuchi††thanks: Based on ESO/VLTI programs 077.C-0706 and 60.A-9054
Abstract
Aims. 51 Oph is one of the few young Be stars displaying a strong CO overtone emission at microns in addition to the near infrared excess commonly observed in this type of stars. In this paper we first aim to locate the CO bandheads emitting region. Then, we compare its position with respect to the region emitting the near infrared continuum.
Methods. We have observed 51 Oph with AMBER in low spectral resolution (R=35), and in medium spectral resolution (R=1500) centered on the CO bandheads.
Results. The medium resolution AMBER observations clearly resolve the CO bandheads. Both the CO bandheads and continuum emissions are spatially resolved by the interferometer. Using simple analytical ring models to interpret the measured visibilities, we find that the CO bandheads emission region is compact, located at AU from the star, and that the adjacent continuum is coming from a region further away (AU). These results confirm the commonly invoked scenario in which the CO bandheads originate in a dust free hot gaseous disk. Furthermore, the continuum emitting region is closer to the star than the dust sublimation radius (by at least a factor two) and we suggest that hot gas inside the dust sublimation radius significantly contributes to the observed 2 m continuum emission.
Key Words.:
Techniques: interferometric – Stars: individual: 51 Oph – planetary systems: protoplanetary disks1 Introduction
The environment of young stars is formed by a dusty and gaseous
circumstellar disk in which the first stages of planet formation are
thought to take place. Hence, building a comprehensive picture of the physical
mechanisms governing this formation requires the understanding of the
distribution and the evolution of both the dust and gas species.
The content and dynamics
of the gaseous component, which dominates the total mass
of the disk, control the accretion-ejection processes and will
define the final architecture of forming planetary systems.
On the other hand, the dust, responsible for the continuum infrared
excess, plays an essential role in determining the
structure of the protoplanetary disk itself,
since its opacity dominates in the continuum.
Dust grains are also the first building blocks
that will grow into kilometric planetesimals and then into eventual
planets.
To study the planet formation taking place in the very inner region of
the disk, one needs to combine milli-arcsecond high angular
resolution techniques with high spectral resolution in order
to directly probe the physical processes at stake both in the
continuum and in the emission lines.
In this respect, near infrared spectro-interferometry that associates
long baseline near infrared interferometry with spectroscopy appears
perfectly suited. This technique indeed offers a unique way to
spatially resolve both the continuum infrared excess and emission line components,
that is to locate the regions of emission independently of any
prior assumption regarding the physical mechanisms at play.
In that sense, infrared spectro-interferometry has already provided important results
about the origin of the hydrogen line .
Different authors have thus located the emission region, showing that it can arise either from
the accreting columns of gas falling onto the star (Eisner, 2007) or from
outflowing winds in which ionized matter is ejected from the star
(Malbet et al., 2007; Tatulli et al., 2007b; Kraus et al., 2008).
In this paper we are interested in exploring lines which are more
direct probes of gas in the disk itself.
We present the first interferometric observations of the
CO overtone emission in the (B9) Be star 51 Oph.
51 Oph is one of the very few young stars where this emission is strong
enough to be observed with infrared
spectro-interferometry (Thi et al., 2005; Berthoud et al., 2007). This star exhibits
also a strong emission, which, assuming a
magnetospheric origin (Muzerolle et al., 2004), indicates an accretion
rate of (Garcia Lopez et al., 2006; Brittain et al., 2007). The dust component is rather compact (Lagage & Pantin (1994); Liu et al. (2007)) and shows a strong silicate
feature in emission (Bouwman et al., 2001) but no PAH (Meeus et al., 2001), consistent
with a flat and geometrically thin dusty disk (Malfait et al., 1998). All the
previous analysis are pointing towards a disk seen nearly edge-on.
2 Observations and data reduction
| Date | Telescopes | Baseline (m) | PA (∘) | Wavelength (m) | Resolution | Calibrator | Absolute visibility |
|---|---|---|---|---|---|---|---|
| 10-09-2006 | U1-U2-U4 | 55/82/121 | 34/91/69 | 2.3 | 1500 | HD170499 | 1.00.1/0.80.05/0.80.03 |
| 05-09-2007 | G1-D0-H0 | 69/60/71 | 326/80/17 | 2.2 | 35 | HD163955 | 0.80.1/0.850.1/1.00.1 |
| 05-09-2007 | G1-D0-H0 | 65/46/70 | 345/89/24 | 2.2 | 35 | HD163955 | 1.00.15/1.00.1/0.870.1 |
| 06-09-2007 | G1-D0-H0 | 64/31/67 | 0/98/27 | 2.2 | 35 | HD172051 | 0.850.12/0.950.1/0.950.1 |
51 Oph () has been observed with AMBER, first in medium spectral
resolution (MR-K, R=1500) with the 8m Units Telescopes (UTs) of the VLTI in September
2006, then in low resolution (LR-K, R=35) with the 1.8m Auxiliary
Telescopes (ATs) in September 2007. The log of the observations is presented in Table 1.
Spectrally dispersed observations: The observations in medium
spectral resolution have been performed in the wavelength range
around the CO overtone bandheads emission.
On the AMBER detector are recorded both
the dispersed photometry from which the spectrum of our
target is derived, and the dispersed interference pattern from which the visibilities as a function of the wavelength are computed.
A reference source is required to calibrate both observables (i.e. the
spectrum and the visibilities).
51 Oph calibrated spectrum: In order to correct for the wavelength dependent telluric and instrumental features in the AMBER
spectra, we used the observations of the calibration star
HD170499. This star has a K4III spectral type and has intrinsic
photospheric absorption features that need to be removed before using its observations to derive the response of the atmosphere and instrument. In
particular, cool stellar photospheres show strong CO absorption
longward of 2.9 m (e.g. Wallace & Hinkle (1997)). To correct for the
photospheric emission we constructed a template photospheric spectrum averaging three of the best quality spectra of stars with spectral type as
close as possible to our own from Wallace & Hinkle (1997): HR 1457
(K5III), HR 3275 (K4.5III), and HR 6705 (K5III). The average
spectrum (normalized to the continuum) was then multiplied by the spectral slope of a K4 III star using the Pickles (1998) models available on the ISAAC
web pages at ESO to obtain the template. The template spectrum was
then smoothed to the AMBER spectral resolution and used
to remove the photospheric signatures in the calibrator spectrum and
derive the response of the system. This response was then used to
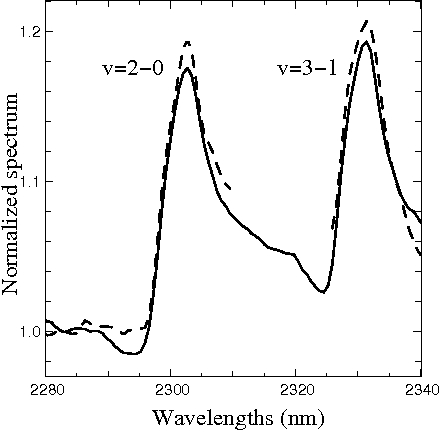
correct the spectrum of 51 Oph. In Fig. 1
we show the final AMBER spectrum compared to a
K band spectrum of 51 Oph obtained at the TNG telescope with the
NICS NIR spectrograph (Isella, priv. comm.).
51 Oph dispersed calibrated visibilities: We computed
visibilities using the standard data reduction algorithms described in
Tatulli et al. (2007a), previously applying the AMDC sofware
(Li Causi et al., 2007) to take away the spurious
fringes of the detector that can bias the estimation of the
visibility. A drastic fringe signal-to-noise ratio (SNR) selection
using the best frames was performed (for both the source
and the calibrator) to insure reliable absolute calibrated
visibilities (Tatulli et al., 2007a). These latter were obtained by
dividing the 51 Oph raw visibilities by the reference ones, assuming
a diameter of mas for the calibrator, according to the catalog of
Mérand et al. (2005). Finally, we binned the spectrally
dispersed visibilities in the wavelength direction in order to
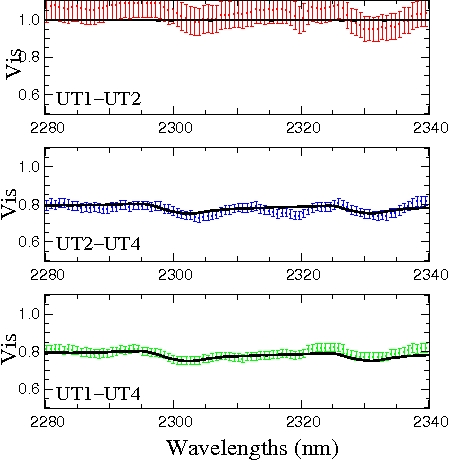
increase the SNR. The results are presented in
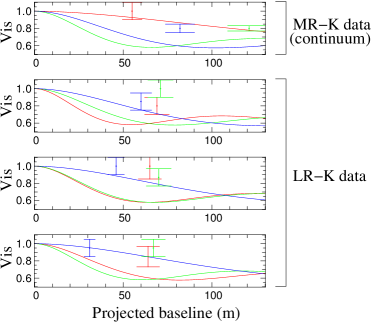
Fig. 2 and the values of the visibilities in
the continuum (i.e. average on the continuum spectral range) are given in Table 1.
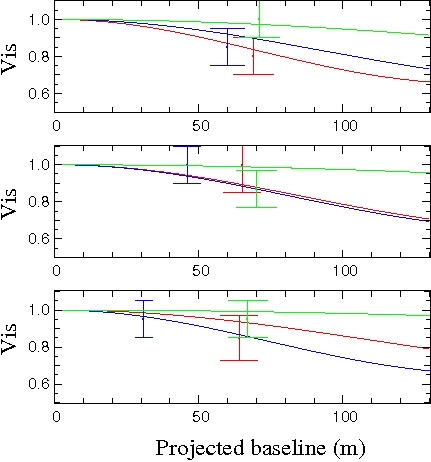
51 Oph low resolution visibilities: LR-K data were reduced
following the same procedure as the MR-K ones and then
averaged spectrally to derive one single visibility of the continuum
per baseline, whose values are plotted in
Fig. 3 and given in Table 1 as well.
3 Modelling
Our MR-K data resolve spectrally the two CO bands
(although not the rotational components within each band).
For the longest baselines UT2-UT4 and UT1-UT4, the emission is
spatially resolved at all wavelengths, though with rather high
visibilities of 0.8. Our LR-K data are consistent with the MR-K ones,
displaying high visibilities between 0.8 and 1 in the continuum at 2.2m.
To derive more information, we need to compare the observed
visibilities to model predictions. We adopt simple geometrical models
and describe both the continuum and bandheads emitting regions as coming
from rings of constant surface brightness. At each wavelength we
assume that the emission is the sum of the unresolved stellar flux
, of a continuum excess emission and of emission in the CO
bandheads , with ratios that we derive from observations. In
particular, the ratio is derived from the spectral
energy distribution (SED) photometric data (Waters et al., 1988), fitting
a Kurucz spectrum (Kurucz, 1979) for the star with K,
. We find and at 2.2m and 2.3m, respectively. The
ratio is given by our normalized AMBER spectrum
(see Fig. 1, left) in the CO bandheads and is about
at the peak of the 2-0 band and at the peak of the 3-1 band.
We compute two families of models, one with narrow111the width of the ring is fixed at the
typical value of , the results being
poorly dependent on its value as long as
. rings and one with broad rings
extending from the stellar radius (in the following, uniform brightness).
The parameters of the model are the inclination (), the position
angle () of the system and the size of the bandheads () and
continuum () emitting region, respectively. The visibility as a function of the wavelength is given by:
| (1) |
where is the visibility of the region emitting the
continuum and that of the region emitting the bandheads.
Fitting together the continuum and bandheads models, we have
performed a least-square minimization test on a large grid of
parameters varying both radii from 0 to 3AU, the inclination from
0 to 90∘ and the position angle from 0 to 180∘.
The function presents a clear and unambiguous minimum, for two reasons: (i) the high value of the visibilities imposing that we
are in the first lobe of the visibility function, hence that the
emission regions are rather compact and, (ii) the broad range of
baseline orientations which put strong constraints on the inclination
and the position angle of the system.
The parameters of the best-fit model
are summarized in Table 2, and the
result of the fit is shown in Fig. 2 and 3, for the
narrow ring model case.
We note that both the bandheads and continuum components are unresolved for
the smallest UT baseline shown in the top panel of
Fig. 2. This suggests that the small variations of the visibility detected in the CO bandheads
are probably remaining biases of the data reduction, given the low SNR of
the interferograms. However, considering the error bars
of the measurements, this (possible) bias has only a very marginal influence on the sizes we derive and does not impact on their interpretation.
| Model | (∘) | (∘) | (AU) | (AU) | |
|---|---|---|---|---|---|
| Uniform Brightness | 0.8 | ||||
| Narrow Ring | 0.8 |
4 Discussion
4.1 Sizes of emitting regions vs. modelling
The uniform brightness and the narrow ring are the two extreme cases of a unique model of uniform distribution in which the width of the emitting region is varying. We emphasize that this geometrical modelling defines the metric that allows us to unequivocally link the measured visibilities to the spatial brightness distribution of these regions, through the Zernicke-Van Cittert theorem (Goodman, 1985). It does not introduce assumptions regarding the mechanisms at the origin of these emissions. We present in Table 2 the results for the two scenarios. All the intermediate models would also work, with intermediate values for the sizes. Note that the uniform brightness returns the largest size because emission is added at small spatial scales down to the stellar radius. The uniform brightness has no proper physical meaning since neither the dust nor the CO gas can survive so close to the star. However, it represents the characteristic size of the emission region. As this quantity is commonly used in infrared interferometry, it is given here for this purpose. Conversely the narrow ring model is sensitive to the location where most of the emission is arising from, usually the inner rim of this emission. In the following, we will analyze our results in the light of the narrow ring only. We emphasize that the size of the CO emitting region is smaller than the one of the continuum, independently of the choice of our model.
4.2 Inclination and position angle of the system
We find a position angle of degrees and an inclination of degrees. This inclination is in agreement with most of the previous studies. Berthoud et al. (2007) have, however, proposed an alternative scenario in which the object would have an inclination lower than . Our measurements are positively ruling out this latter option.
4.3 Locating the CO bandheads emission region
For the first time, we are spatially resolving the CO bandheads emission region in 51 Oph. We find that most of the CO bandheads are emitted at a radius of AU from the central star. This is fully supporting the scenario in which the CO bandheads emission is arising from the inner region of a hot gaseous disk in Keplerian rotation, between AU and AU, as derived from spectroscopic modelling of the CO bandheads (Thi et al., 2005; Berthoud et al., 2007), and where the temperature is hot enough (K) to excite the first overtone bands at 2.3m. More precisely, these authors, though they are fitting the CO bandheads with a broad ring, are pointing out that most of the emission comes from a region close to the inner radius of their gaseous disk model at 0.15AU. This is in excellent agreement with the value we derive in the present analysis. We note that one single ring enables us to reproduce the visibility in the two bandheads, indicating that both the 2-0 and 3-1 bands come from the same physical region. We also note that the CO emission region is inside the near infrared continuum one, the latter being located at a radius of AU. This result corroborates that the CO is emitted from a dust free region, regardless of the true origin of the continuum (see Sect. 4.4). At such a distance from the star, the survival of the CO gas from photo-dissociation must however be considered. Thi et al. (2005) suggested that two mechanisms can circumvent the photo-dissociation process: the self-shielding of the CO molecules that occurs if the column density is high enough (, van Dishoeck & Black (1988)), as well as the C + OH CO + H chemical reaction, which insures a continuous replenishment of this molecule.
4.4 The origin of the continuum near-infrared excess
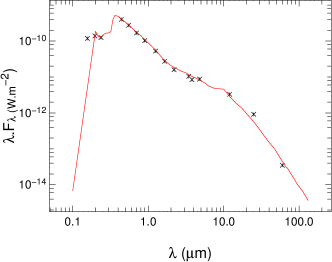
The continuum excess of 51 Oph is weak and, according to the shape
of its SED (Waters et al., 1988), appears to come from
a small and tenuous disk of dust which is optically thin at most
wavelengths, as already inferred by Malfait et al. (1998).
We performed SED fitting with the MCFOST dusty disk code of Pinte et al. (2006), and found the same
results with a low amount of dust present in the disk ().
The result of our
modelling is shown in Fig. 4.
This model however requires a dust
inner edge located at the dust sublimation radius, which in the case
of 51 Oph would be at AU for a typical grain size
distribution of spherical particles222, ranging from m to
mm, with optical constants from
Mathis
& Whiffen (1989) and a dust sublimation temperature of . Obviously this model, with such a large inner rim, is not
compatible with our measured visibilities as shown by Fig.
5, and for which we calculate a of 10. Studying the extreme case where only big grains
are present would shrink the dust sublimation radius down to AU, still at
least two times further out than the distance suggested by our data.
Interestingly, a similar problem was evidenced by
Leinert et al. (2004) on the same star, the 0.5AU mid-infrared size of
51 Oph derived from their MIDI measurements being too small to be
compatible with the shape of the SED.
Several scenarios may however circumvent this apparent
disagreement of the location of the dust evaporation radius with
respect to our derived inner edge position. First, the gas inside the dust
sublimation may help the
dust to survive closer in by absorbing a fraction of the stellar
radiation available to heat the dust. According to
Muzerolle et al. (2004), the gas accreting onto the star becomes
optically thick to stellar radiation for accretion rates higher than
. The accretion rate of
derived from luminosity
would actually place the gas in 51 Oph at the frontier between the
optically thin and optically thick regimes.
Another possibility comes
from the rapidly rotating nature of 51 Oph. Given its measured
rotational velocity km/s (Dunkin et al., 1997), and knowing that
this star is seen almost edge-on, 51 Oph would rotate at of its
critical velocity given by km/s. Therefore, 51 Oph is
likely elongated with a drop of its gravity () from pole to
equator, and subsequently of its effective temperature (von Zeipel, 1924).
The star being cooler at the equator than at the poles, the dust
distributed in the equatorial plane will be heated less efficiently
and the evaporation radius moved closer to the star. From the gravity
darkening law (solid body approximation),
the effective temperature of 51 Oph at the equator can be estimated
to be of the order of of that of the pole, hence lowering the sublimation
radius by a factor of 2.
Finally, one last explanation would be that the infrared
excess is not entirely originating from dust thermal emission.
The gas inside the dust sublimation radius could substantially contributes
to the near infrared energy balance. Muzerolle et al. (2004) have shown
that inner optically thick gaseous zones are indeed expected to emit a
large continuum excess in the near infrared through free-free
emission. Interestingly, this effect has been recently shown to take
place in Herbig Ae/Be stars (Eisner et al., 2007; Isella et al., 2008; Tannirkulam et al., 2008).
4.5 51 Oph: a classical Be star?
51 Oph appears to be a peculiar source in an unusual transitional state. In the frame of Herbig Ae/Be stars, its SED presents a near infrared excess which is too small to account for a classical puffed-up inner rim. In the frame of -Pic like stars, 51 Oph is also lacking the far infrared-excess bump associated with the presence of an outer dusty disk, the inner disk being emptied by a potential forming planet (Malfait et al., 1998). Instead these authors suggest that 51 Oph is undergoing an alternative evolution scheme, without forming planets. Furthermore, the presence of strong CO overtone emission bandheads also makes 51 Oph quite a puzzling case. Such emission requires large column densities of warm gas in order to produce detectable emission. Such large column densities are rare except in sources with the largest accretion rates (Najita et al., 2007). Interestingly, the CO overtone has also been detected in the B9 star HD58647 (Berthoud, 2008), for which the SED profile is similar to that of 51 Oph (Malfait et al., 1998). In HD58647 however, there is less CO emission but its infrared excess is stronger. Berthoud (2008) thus concluded that both stars are most likely classical Be stars surrounded by massive gaseous disk, though seen at different evolutionary stages. This scenario is in agreement with their high rotational velocities (km/s and km/s for 51 Oph and HD58647 respectively) and gives credit to the hypothesis that most of the near infrared continuum emission – if not all – is arising from the circumstellar gas. HD58647 has been observed with the Keck interferometer (Monnier et al., 2005) and these authors have derived a rather compact size of AU for its near infrared continuum emission, slightly larger as that of 51 Oph for an equivalent luminosity ( for 51 Oph vs. for HD58647). This is again below – or at the very lower limit of – the dust sublimation radius, pointing towards the same gaseous origin for the continuum than that of 51 Oph. Hence, the very inner environment of this type of stars seems to follow an intriguing evolution scheme where the dust progressively dissipates leaving behind a massive gas-rich, strongly accreting disk. As the hot dust is vanishing, the relative contribution of the gas to the continuum infrared excess increases, its region of emission moving closer to the star. How the circumstellar dust disappears remains rather unclear. Repeated studies combining spectroscopic detection of emission bandheads (CO, hydrogen) and interferometric measurements in a large sample of stars would certainly help improve our understanding on how these disks are evolving and dissipating.
5 Summary
The principal results are summarized here:
-
•
using the AMBER/VLTI interferometer, we have spatially and spectrally resolved the CO bandheads emission at m
-
•
the inclination of the system is constrained by our observations, and we confirm that the object is seen nearly edge-on.
-
•
assuming simple ring models for the distribution of both the near infrared continuum and CO emissions, we locate the bandheads emission region at a distance of AU from the star, inside the continuum emission region, reinforcing the scenario in which the CO bandheads originate from the inner part of a dust free gaseous disk.
-
•
the continuum emission is located at a distance of AU, at least two times closer to the star than the dust sublimation radius. This suggests that the inner disk of gas is playing an important role, whether by shielding the star light and thus allowing the dust to survive closer to the star, and/or by contributing to a non negligible part of the near infrared continuum emission.
Acknowledgements.
Authors would like to thanks C. Pinte and G. Duchêne for fruitful discussions concerning the disk modelling using the MCFOST sofware. This project was partially supported by the PRIN INAF 2006 grant ”From Disks to Planetary Systems”. At LAOG E.T. is supported by a postdoc grant from CNRS/INSU, France. This research is supported by Agence Nationale de la Recherche (ANR) of France through contract ANR-07-BLAN-0221 and by Programme National de Physique Stellaire (PNPS) of CNRS/INSU, France.A.N. and L.T. were partially supported by the INAF 2005 grant “Interferometria in- frarossa: ottimizzazione di osservazioni astrofisich” and by the INAF 2006 grant “From Disks to Planetary Systems”.References
- Berthoud et al. (2007) Berthoud, M. G., Keller, L. D., Herter, T. L., Richter, M. J., & Whelan, D. G. 2007, ApJ, 660, 461
- Berthoud (2008) Berthoud, M. G. 2008, Ph.D. Thesis
- Bouwman et al. (2001) Bouwman, J., Meeus, G., de Koter, A., Hony, S., Dominik, C., & Waters, L. B. F. M. 2001, A&A, 375, 950
- Brittain et al. (2007) Brittain, S. D., Simon, T., Najita, J. R., & Rettig, T. W. 2007, ApJ, 659, 685
- Dunkin et al. (1997) Dunkin, S. K., Barlow, M. J., & Ryan, S. G. 1997, MNRAS, 290, 165
- Eisner (2007) Eisner, J. A. 2007, Nature, 447, 562
- Eisner et al. (2007) Eisner, J. A., Chiang, E. I., Lane, B. F., & Akeson, R. L. 2007, ApJ, 657, 347
- Garcia Lopez et al. (2006) Garcia Lopez, R., Natta, A., Testi, L., & Habart, E. 2006, A&A, 459, 837
- Goodman (1985) Goodman, J. W. 1985, New York: Wiley, 1985,
- Isella et al. (2008) Isella, A., Tatulli, E., Natta, A., & Testi, L. 2008, A&A, 483, L13
- Kraus et al. (2008) Kraus, S., et al. 2008, accepted
- Kurucz (1979) Kurucz, R. L. 1979, ApJS, 40, 1
- Lagage & Pantin (1994) Lagage, P. O., & Pantin, E. 1994, Experimental Astronomy, 3, 57
- Leinert et al. (2004) Leinert, C., et al. 2004, A&A, 423, 537
- Li Causi et al. (2007) Li Causi, G., Antoniucci, S., & Tatulli, E. 2008, A&A, 479, 589
- Liu et al. (2007) Liu, W. M., Hinz, P. M., Meyer, M. R., Mamajek, E. E., Hoffmann, W. F., Brusa, G., Miller, D., & Kenworthy, M. A. 2007, ApJ, 658, 1164
- Malbet et al. (2007) Malbet, F., et al. 2007, A&A, 464, 43
- Malfait et al. (1998) Malfait, K., Bogaert, E., & Waelkens, C. 1998, A&A, 331, 211
- Mathis & Whiffen (1989) Mathis, J. S., & Whiffen, G. 1989, ApJ, 341, 808
- Meeus et al. (2001) Meeus, G., Waters, L. B. F. M., Bouwman, J., van den Ancker, M. E., Waelkens, C., & Malfait, K. 2001, A&A, 365, 476
- Mérand et al. (2005) Mérand, A., Bordé, P., & Coudé Du Foresto, V. 2005, A&A, 433, 1155
- Monnier et al. (2005) Monnier, J. D., et al. 2005, ApJ, 624, 832
- Muzerolle et al. (2004) Muzerolle, J., D’Alessio, P., Calvet, N., & Hartmann, L. 2004, ApJ, 617, 406
- Najita et al. (2007) Najita, J. R., Carr, J. S., Glassgold, A. E., & Valenti, J. A. 2007, Protostars and Planets V, 507
- Pickles (1998) Pickles, A. J. 1998, PASP, 110, 863
- Pinte et al. (2006) Pinte, C., Ménard, F., Duchêne, G., & Bastien, P. 2006, A&A, 459, 797
- Tatulli et al. (2007a) Tatulli, E., et al. 2007, A&A, 464, 29
- Tatulli et al. (2007b) Tatulli, E., et al. 2007, A&A, 464, 55
- Tannirkulam et al. (2008) Tannirkulam, A., et al. 2008, ApJ, 677, L51
- Thi et al. (2005) Thi, W.-F., van Dalen, B., Bik, A., & Waters, L. B. F. M. 2005, A&A, 430, L61
- van Dishoeck & Black (1988) van Dishoeck, E. F., & Black, J. H. 1988, ApJ, 334, 771
- von Zeipel (1924) von Zeipel, H. 1924, MNRAS, 84, 684
- Wallace & Hinkle (1997) Wallace, L., & Hinkle, K. 1997, ApJS, 111, 445
- Waters et al. (1988) Waters, L. B. F. M., Cote, J., & Geballe, T. R. 1988, A&A, 203, 348