X-ray Emission from Young Stellar Objects in the Chamaeleontis Group: the Herbig Ae Star HD 104237 and Associated Low-Mass Stars
Abstract
We present Chandra-hetgs observations of the Herbig Ae star HD 104237 and the associated young stars comprising lower mass stars, in the 0.15-1.75 mass range, in their pre-main sequence phase. The brightest X-ray source in the association is the central system harboring the Herbig Ae primary, and a K3 companion. Its X-ray variability indicates modulation possibly on time scales of the rotation period of the Herbig Ae star, and this would imply that the primary significantly contributes to the overall emission. The spectrum of the Herbig Ae+K3 system shows a soft component significantly more pronounced than in other K-type young stars. This soft emission is reminiscent of the unusually soft spectra observed for the single Herbig Ae stars HD 163296 and AB Aur, and therefore we tentatively attribute it to the Herbig Ae of the binary system. The hetgs spectrum shows strong emission lines corresponding to a wide range of plasma temperatures. The He-like triplet of Mg xi and Ne ix suggest the presence of plasma at densities of about cm-3, possibly indicating accretion related X-ray production mechanism.
The analysis of the zero-order spectra of the other sources indicates X-ray emission characteristics typical of pre-main sequence stars of similar spectral type, with the exception of the T Tauri HD 104237-D, whose extremely soft emission is very similar to the emission of the classical T Tauri star TW Hya, and suggests X-ray production by shocked accreting plasma.
1 Introduction
Nearby young associations provide ideal targets for the study of star and planet formation, and have sparked growing interest in the past few years. The early evolution of young stars is strongly dependent on stellar mass (e.g., Larson 1972). For low-mass stars () the accretion timescales are shorter than the evolution time to the zero-age main sequence, and these stars can be observed in their pre-main sequence (PMS) T Tauri phase (D’Antona & Mazzitelli, 1994). In massive protostars (), however, core hydrogen burning already starts during the accretion phase (Appenzeller, 1994; Bernasconi & Maeder, 1996). The behavior at the boundaries between high and low mass ranges is yet unclear (Palla & Stahler, 1993).
Herbig Ae stars (HAe; Herbig 1960) are PMS stars of intermediate mass (2–10), and share several characteristics with T Tauri stars (TTS), such as IR excess emission, irregular photometric variability, and disk properties (Waters & Waelkens, 1998; Mannings & Sargent, 1997). HAe stars show evidence for a disk-like geometry of the circumstellar material, and the disk properties are similar to those of TTS (Mannings & Sargent, 1997; Grady et al., 1999). There is some evidence of magnetic accretion in HAe stars, analogous to the magnetospheric accretion scenario generally accepted for classical TTS (CTTS, i.e. TTS that are still actively accreting) and are therefore thought to be more massive analogs of CTTS (e.g., Muzerolle et al. 2004; Grady et al. 2004; Guimarães et al. 2006). While magnetic fields have been detected in a few HAe stars (e.g., Donati et al. 1997; Hubrig et al. 2004), their origins are still unknown; however, a shear magnetic model does allow generation of magnetic fields in the early evolutionary stages of A-stars (Tout & Pringle, 1995).
Systematic X-ray studies have shown that HAe stars are moderately bright X-ray sources (Damiani et al., 1994; Zinnecker & Preibisch, 1994; Hamaguchi et al., 2005; Stelzer et al., 2006). Since main sequence A-stars are not known to be luminous X-ray sources due to lack of strong enough winds or magnetic-dynamo driven coronae, the findings may imply that the physical characteristics of young A-stars stars differ from those of main sequence A-stars.
HAe X-ray emission mechanisms remain unknown. Early studies based on ROSAT and Einstein observations proposed the standard wind shock model as for early-type massive stars (Damiani et al., 1994; Zinnecker & Preibisch, 1994). However, typical / ratios found for HAe stars are significantly higher than the empirical luminosity ratio of for early type stars (Skinner et al., 2004), casting some doubt for this paradigm. Also, the high X-ray temperature ( K) component found for a large fraction of HAe X-ray sources (see e.g., Skinner et al. 2004; Hamaguchi et al. 2005; Stelzer et al. 2006) cannot be produced through this mechanism. Others works attribute the emission to magnetic activity (either coronal activity as in late-type stars, or magnetic activity due to star-disk interaction), or to unresolved late-type companions (Hamaguchi et al., 2005; Skinner & Yamauchi, 1996; Skinner et al., 2004; Stelzer et al., 2006).
Another emission mechanism possibly at work in HAe stars is X-ray emission from shocks in accreting plasma, proposed as the production mechanism for soft X-rays in several CTTS (TW Hya, BP Tau, V4046 Sgr, MP Mus; Kastner et al. 2002; Stelzer & Schmitt 2004; Schmitt et al. 2005; Günther et al. 2006; Argiroffi et al. 2007). For these CTTS, Chandra and XMM-Newton high resolution spectra have revealed peculiar characteristics with respect to all other observed stellar spectra, in particular showing (i) soft excess—prominent cool component at temperatures of K, TW Hya being an extreme case, where this soft component largely dominates the X-ray spectrum; (ii) unusually high density ( cm-3) for the cool ( K) plasma, as diagnosed through the analysis of the He-like triplets line ratios; (iii) peculiar abundances—extremely high Ne, low metal abundances (Kastner et al., 2002; Stelzer & Schmitt, 2004; Drake et al., 2005). Analogously, Chandra imaging spectra of the HAe star HD 163296 revealed a very soft spectrum ( keV) possibly suggesting accretion dominated X-ray emission (Swartz et al., 2005), as for the CTTS TW Hya (Kastner et al., 2002); Grady et al. (2007) also find extremely soft X-ray emission ( keV) from the Herbig Ae star HD 169142. Recently, XMM-Newton observations of the HAe star AB Aur have shown a very similar soft spectrum (Telleschi et al., 2007). In this case, the high resolution spectrum provides additional diagnostics: the high forbidden/intercombination ratios () of the He-like triplets, especially O vii, indicate the absence of high density and high UV field, expected if X-rays are produced in the accretion shocks, and rule out accretion-related X-ray emission for AB Aur. For AB Aur, which has spectral type A0, the photospheric UV emission is strong enough to alter the O He-like triplet up to several stellar radii from the surface; the large measured O vii line ratio, constrains the emission to originate high above the photosphere () and therefore it implies that also coronal emission is unlikely for AB Aur. A plausible alternative for this source is X-ray emission from magnetically confined winds, as in the scenario of Babel & Montmerle (1997). It is important to keep in mind that some of the different X-ray emission mechanisms might not be mutually exclusive and instead they might coexist, as seems to be the case for some CTTS (Schmitt et al., 2005; Günther et al., 2006; Argiroffi et al., 2007) where both magnetically confined coronal plasma and accretion streams likely contributes to the overall X-ray emission.
HD 104237 is one of the nearest known ( pc; Perryman et al. 1997) and well studied HAe stars, and it is also a strong X-ray source ( erg s-1). Chandra observations have spatially resolved the X-ray emission from HD 104237, showing that the brightest X-ray source is coincident with the HAe source, and identifying 4 previously unknown nearby sources, likely TTS forming a young stellar group associated with HD 104237 (Feigelson et al. 2003, hereafter FLG03; see §2). Chandra (FLG03) and XMM-Newton (Skinner et al., 2004) imaging spectra of this HAe star have shown the presence of hot plasma ( keV), taken as evidence of magnetic activity. HD 104237 with its proximity, high , and low line-of-sight extinction is a unique target to study the X-ray emission mechanism in HAe stars, through high resolution spectroscopy. High resolution spectra provide plasma diagnostics which are the only means for detailed study of the physical conditions of the emitting material. Cool, dense plasma (, ) is now thought to be a signature of accretion, while variable hot emission is indicative of magnetic activity.
In this paper we present Chandra-hetgs observations of HD 104237. The relatively long exposure of ks provides detailed information on the X-ray variability of the HAe star, as well as of other stars in the field, and it yielded a well exposed hetgs spectrum of the HAe star providing detailed diagnostics for the emitting plasma.
2 HD 104237: the Herbig Ae star and the T Tauri association
HD 104237 is the optically brightest HAe star, and it is also a moderately strong X-ray source with erg/s, observed with ROSAT (Alcala et al., 1995), ASCA (Skinner & Yamauchi, 1996), Chandra (FLG03), and XMM-Newton (Skinner et al., 2004).
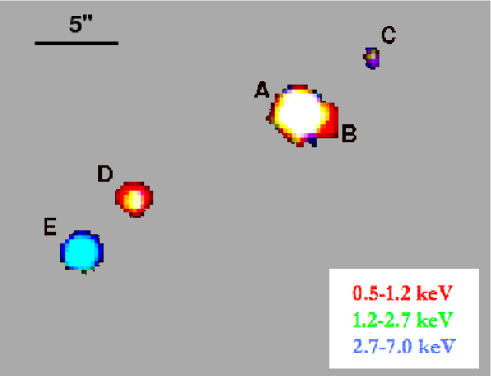
Chandra imaging observations, thanks to the unprecedented sub-arcsecond spatial resolution, have revealed the presence of four other X-ray emitting young stellar objects associated with HD 104237, labeled B–E, A being the HAe star (Figure 1; see also FLG03). Grady et al. (2004) (hereafter G04) have conducted intensive high angular resolution multiwavelength imaging (optical, NIR, mid-IR), and spatially resolved spectroscopy (optical, UV, FUV) to probe the characteristics of A, and the associated star-forming environment. The comprehensive study by G04, has provided detailed information on the HAe star and constraints on possible close companions.
The stellar parameters of the members of this young ( 2-5 Myr) stellar group are listed in Table 1. IR excess, H emission, and Li absorption indicate a T Tauri nature for the components B, D, and E (FLG03; G04). FLG03 hypothesized that C is a late M-type TTS or a brown dwarf.
| Object | Spec. Type aaRanges of spectral types from Feigelson et al. (2003); Grady et al. (2004); Luhman (2004). | EW(H) bbEquivalent width, in Å, of H emission from Acke et al. (2005); Grady et al. (2004). | offset ccfrom Grady et al. (2004). | comments |
|---|---|---|---|---|
| A ddA has a K3 spectroscopic companion within AU (Böhm et al., 2004) whose parameters are listed in Table 2. | A7.5Ve-A8Ve | -24.5 | … | HAe, IR and UV excess, jets |
| B | M3-4 | … | ′′ | IR excess |
| C | … | … | ′′ | BD (FLG03) or M6V (G04) |
| D | M2-3 | -9 | ′′ | H near CTTS limit |
| E | K3IVe | -9 | ′′ | H near CTTS limit, IR excess |
| Parameter | HD 104237-A | companion | Ref. aaReferences: (1) Perryman et al. (1997); (2) Böhm et al. (2004); (3) Böhm et al. (2006); (4) Donati et al. (1997); (5) Grady et al. (2004). |
|---|---|---|---|
| d | 116 pc | 1 | |
| / | 2.25 | 1.75 | 2 |
| / | 3 | ||
| 0.5 | 2 | ||
| 3.87 | 3.675 | 2 | |
| Age | 2-5 Myr | 2,5 | |
| km s-1 | 4 | ||
| ∘, ∘ | 5,3 | ||
| bbPeriodicity of modulation observed in H, and possibly associated to rotational modulation by Böhm et al. (2006). | hrs | 3 | |
| 19.859 days | 2 | ||
| ccEccentricity of the binary orbit. | 0.66486 | 2 |
HD 104237-A:
HD 104237-A has been identified as an Herbig Ae star by Hu et al. (1989), based on its optical spectrum and IR excess. It was initially assigned a spectral type A0pe by Walker & Wolstencroft (1988), then A4 ve by Hu et al. (1991), and recently G04 have revised its classification as A7.5 ve-A8 ve. The HAe star presents evidence of activity–as indicated by line emission, UV excess, outflows–and is still accreting at an estimated rate of /yr (G04, Garcia Lopez et al. 2006). UV high resolution spectra show P Cygni profiles for several lines (Blondel & Djie, 2006). G04 also found a bipolar microjet and Herbig-Haro knots; from the analysis of proper motion of a knot they derived the inclination of the system to be ∘. The inclination may be a meaningful parameter for the detection of accretion signatures, assuming the geometry of magnetospheric accretion models; for instance, the CTTS TW Hydrae and BP Tau, whose soft X-ray emission appears accretion dominated, have both nearly pole-on aspects of 10∘ and 30∘ respectively. The observations suggest a magnetospheric accretion scenario for HD 104237-A similar to CTTS (G04). A magnetic field of this HAe has been marginally detected ( G; Donati et al. 1997). If the geometry of the accretion is similar in HD 104237-A we will likely observe almost along the accretion stream. The HD 104237-A disk extends at most to 0.6′′ ( 70 AU).
HST observations put tight constraints on the distance of any unknown close companion to A (other than the resolved X-ray source B at ′′ separation; G04), excluding the presence of a companion with distance to the A star 0.05′′1′′, implying that a possible companion would have to be closer than AU to A. Böhm et al. (2004) through high resolution spectral observations (aimed at the study of Scuti pulsation observed for this HAe star) revealed the presence of a spectroscopic binary companion to the HAe star, and determined the orbital parameters. They find a mass ratio , and an orbital period of about 20 days, implying an average separation of AU. They assign a spectral type K3 to this spectroscopic companion which is responsible for the Li-line traces in the spectrum of the HAe star revealed by FLG03 and which they attributed to contamination from the adjacent B component. The parameters of the HAe star and the K3 close companion are included in Table 2. Recently, Tatulli et al. (2007) using near-IR interferometric observations of this HAe star modeled the spatial distribution of the circumstellar material and outflows on AU scales; their observations are compatible with outflowing wind launched in the vicinity of the dusty disk inner rim ( AU). Considering the very small distance between the spectroscopic binary components, the circumstellar disk of the HAe star is likely a circumbinary disk, and this could in principle affect the magnetospheric accretion scenario and other phenomena occurring on small scales close to the stars.
The presence of this later type companion, unresolved in the X-ray observations, significantly changes the perspective for interpretation of the X-ray emission of HD 104237-A, as K-type PMS stars are known strong X-ray emitters (e.g., Getman et al. 2005). We will thoroughly discuss this issue in §5.
HD 104237-B:
The proximity of HD 104237-B to the HAe star hampers the precise determination of its stellar parameters, as thoroughly discussed by G04. FLG03 tentatively assigned a K spectral type to B due to the presence of Li-line features in the optical spectrum of HD 104237-A; however, these features are actually produced by the the K-type close companion subsequently discovered as discussed above. G04 finds that HD 104237-B is likely a M-type TTS on the basis of its infrared excess, and of its PSF in HST/STIS images, compatible with M3-M4 spectral type.
HD 104237-C:
FLG03 has tentatively classified HD 104237-C as a brown dwarf candidate.
HD 104237-D:
The H equivalent width, close to the classical TTS limit, the Li features, and the X-ray luminosity indicate the T Tauri nature of HD 104237-D (G04).
HD 104237-E:
This star has a late spectral type, broad H emission, and photometric variability, which are typical of accreting CTTS (G04). This source was also variable in X-rays and showed a remarkable change in emission level by a factor between the two short acis-i observations of FLG03, who also found it to be much more absorbed than the other stars in the association. This suggests that the obscuration is due to local circumstellar material.
3 Observations and Analysis
We observed the Herbig Ae star HD 104237 and the group of young stellar objects associated to it with the Chandra High Energy Transmission Grating Spectrometer (see Canizares et al. 2005 for a description of the instrumentation) for a total exposure time of ks. The details of the observations are presented in Table 3.
We also re-analyzed the acis imaging-mode observations of FLG03 (ObsID 2404 and 3428).
The data used here have been reprocessed using standard CIAO (Fruscione et al., 2006) v3.4 tools. Effective areas were calculated using standard CIAO procedures, which include an appropriate observation-specific correction for the time-dependent acis contamination layer.
Spectral analysis of grating and zeroth order spectra were done with the Interactive Spectral Interpretation System (ISIS111ISIS is available at http://space.mit.edu/cxc/isis/) version 1.4.2 (Houck & Denicola, 2000).
In Figure 1 we present a color coded image of the Chandra-hetgs observations where photons energies in the range keV correspond to blue, keV to green, and keV to red. The X-ray sources are labeled following the classification of FLG03.
| Obs ID | Start date and time | [ks] | count rate [cts/ks] | ||||||
|---|---|---|---|---|---|---|---|---|---|
| A | B aacount rate from zero order counts in the 0.5-8 keV energy range. | C aacount rate from zero order counts in the 0.5-8 keV energy range. | D aacount rate from zero order counts in the 0.5-8 keV energy range. | E aacount rate from zero order counts in the 0.5-8 keV energy range. | |||||
| 0th aacount rate from zero order counts in the 0.5-8 keV energy range. | 1st bbcount rate from first order (MEG -1,+1, HEG -1,+1) dispersed counts, in the 1.5-26Å wavelength range. | ||||||||
| 7319 | 2006-04-11 23:46:08 | 43.39 | 23.0 | 33.7 | 0.67 | 0.21 | 1.5 | 3.7 | |
| 7320 | 2006-04-13 10:13:06 | 43.83 | 19.8 | 28.0 | 0.62 | 0.73 | 1.4 | 2.3 | |
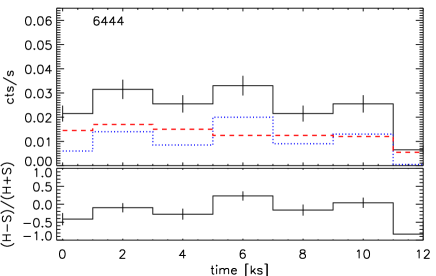
| 6444 | 2006-04-16 09:51:47 | 12.57 | 20.4 | 27.8 | 1.85 | 0.48 | 1.9 | 3.9 | |
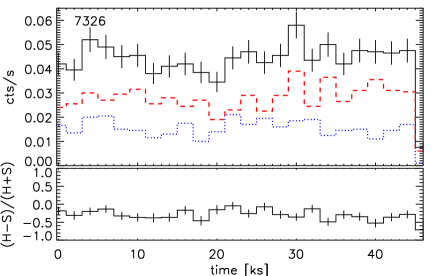
| 7326 | 2006-06-13 05:32:27 | 45.61 | 35.0 | 46.9 | 0.85 | 0.31 | 2.2 | 5.1 | |
In the following section we present the analysis of the X-ray emission of all sources of this young stellar association. We analyzed the low resolution spectra and variability for all group members, and the high resolution spectrum of source A which has enough counts for a meaningful analysis of the dispersed photons.
4 Results
In the total ks hetg observations we detected all sources studied in FLG03. Source A is the strongest X-ray source but even for this source the pileup in the zeroth order is essentially negligible (up to a few %). Source E and D have comparable count rates about an order of magnitude smaller than for source A. Source B, which is at an angular distance of ′′ (FLG03, G04), is apparent as an elongation of source A in the SW direction; even though there is a small contamination of source B in the spectrum of source A its contribution to the A+B spectrum is lower than 10%. Finally, source C is detected at a level only for a portion of the observing time.
The hetg observations presented here provide significantly better statistics than the previous acis-i observations analyzed by FLG03. For source A, we obtained more than 3700 integrated zero-order counts vs. 640 of the short acis observations. For the sources B, C, D and E we obtain 152, 54, 251, and 543 zero-order counts which are a factor 2.5 to 9 times higher than the counts of the acis-i observations which were 44, 6, 70, 225, respectively.
In order to extract the zero-order spectrum of source B we needed to take into account the contamination of source A. This contamination was estimated by extracting the counts of source A in an annular region 2-4 pixels from the center, and excluding a sector containing source B (between -0.64 and 0.24 rad, where 0.0 is west and positive angles are in the north direction). These counts were then scaled to the region of extraction of source B and used as a background for this source.
4.1 Variability
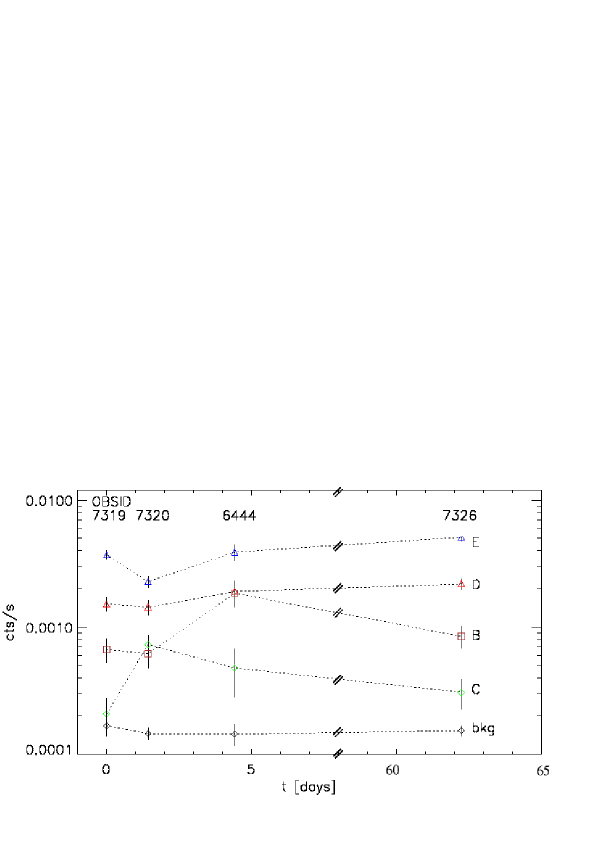
All sources in the HD 104237 field appear to be variable. In Figure 2 we show the lightcurves obtained from zero-order photons for sources B, C, D, E. In order to show how significant the detection of source C is in the different segments of observation we also derived a lightcurve for the background, using an extraction region, close to source C, and with radius 4 times larger than the default value used for the extraction of the spectra of all sources, and then scaling the rate to the source region areas. All sources present significant variability over time scales of days to months.
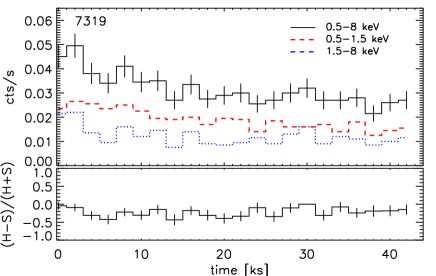
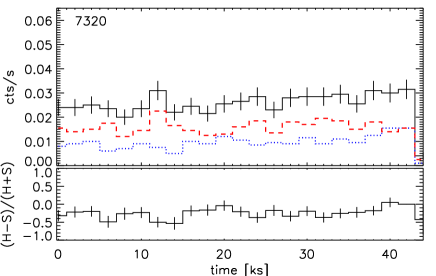
In Figure 3 we plot the lightcurves of source A as obtained from the dispersed photons. In the upper panels we plot the lightcurve of all dispersed photons (black curves), and also the lightcurves in two spectral bands in order to show possible changes in spectral hardness: the hard band corresponding to the keV energy range (blue curves), and the soft band corresponding to the keV range (red curves). The lower panels show the corresponding hardness ratio (defined as [hard-soft]/[hard+soft]). These plots show that the source presents continuous variability (within a factor from an average value) on time scales from hours to days. However the observed variability does not show obvious similarities with very dynamic events such as flares, which are typical of active stellar coronae and are generally characterized by significant increases in hardness ratio and time scales of hours up to days for the most extreme events observed in very active young stars.
We searched for possible periodicity in the lightcurves of source A, in particular exploring possible periodic variation on the characteristic time scales of the system: the orbital period of the binary system ( days; Böhm et al. 2004), and the rotation period. The rotation period of this Herbig Ae star is however not well determined, therefore we used different estimates. Using the km s-1 obtained by Donati et al. (1997) (derived from several photospheric spectral lines), the inclination ∘ estimated by G04, and a stellar radius (Böhm et al., 2006) we obtain a rotation period days; however, considering the uncertainties on all these parameters222For instance, Blondel & Djie (2006) assume very different values for both (150 km s-1), and (53∘), which they infer from optical lines, and the redshifted component of the Ly emission respectively., the rotation period is poorly determined. Böhm et al. (2006) present a possible indication of rotational modulation by studying modulation of lines forming close to the stellar photosphere: they find modulation in the H line that might be due to rotation and it would yield hrs, i.e. days. Therefore we performed a period analysis in this range of periods and we find a best fit period of 95 hrs.
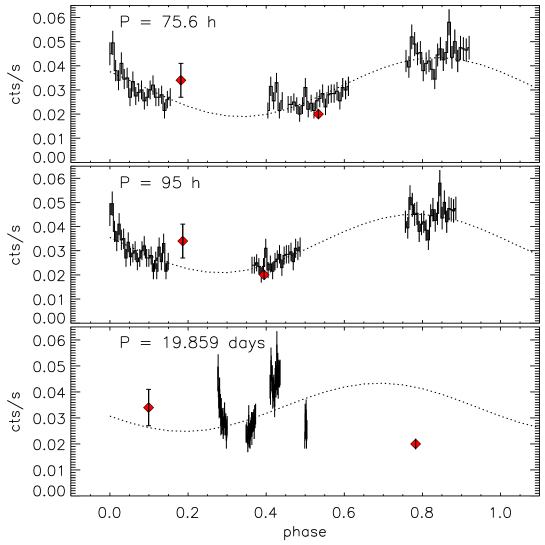
Figure 4 shows the phase folded lightcurves for three different periods. All plots indicate that our X-ray observations do not provide a large phase coverage even for the shortest period, therefore making difficult to identify possible periodic modulation of the X-ray emission. Nevertheless, the observed lightcurve seem to be compatible with modulation on time scale comparable with the rotation period as estimated by Böhm et al. (2006); if true this would imply that the Herbig Ae star is likely a significant contributor to the overall X-ray emission of the binary system. The variability does not show correlation with the orbital period of the HD 104237-A system of 19.859 days (bottom panel of Fig. 4).
In Figure 4 we also superimpose the count rates estimated for the two early acis-i observations studied by FLG03 (ObsID 2404 and 3428). FLG03 in their analysis assumed negligible and did not account for pileup. In order to take into account these effects and estimate the expected count rate for these two observations, we re-analyzed the data using the pileup model of (Davis, 2001) as implemented in ISIS. This model accounts for coincident detection of multiple photons and has the advantage of using all the counts in the source region, not just those in an outer, un-piled annulus. We found a two-temperature model was necessary, and that the pileup fraction was about 20%. In fitting the spectra we fixed the abundances to the values derived from the hetgs analysis, and the to cm-2 (see detailed discussion in §4.2). We note that our analysis of the acis-i spectra of HD 104237-A yields for both temperature components lower values with respect to those found by FLG03; also, our derived luminosity values are larger than the values found by FLG03 (by about 20% and 50% respectively in the two observations). These discrepancies are due to the inclusion of interstellar absorption and pileup effects.
| Parameter aaThe 1 confidence intervals are listed in square brackets. is fixed at cm-2 and element abundances are fixed to the values derived from the hetgs spectrum (see Table 8). and are the X-ray luminosity values in the 0.5-2.0 keV and 0.5-8.0 keV respectively, as in FLG03; these value are corrected for absorption. | ObsID 2404 | ObsID 3428 |
|---|---|---|
| T1 ( K) | 4.7 [4.1-5.3] | 4.8 [4.1-5.3] |
| EM1 ( cm-3) | 19.6 [17.7-20.9] | 22.9 [13.7-26.6] |
| T2 ( K) | 36.8 [26.8-56.7] | 18.8 [16.3-21.4] |
| EM2 ( cm-3) | 3.4 [2.9-4.2] | 15.4 [9.9-17.4] |
| ( erg s-1) | 2.7 | 4.1 |
| ( erg s-1) | 3.0 | 4.7 |
| hetgs modeled zero order count rate | 0.020 | 0.035 |
| acis-i modeled (unpiled) count rate | 0.16 | 0.27 |
| acis-i observed count rate | 0.12 | 0.15 |
4.2 Low resolution spectra
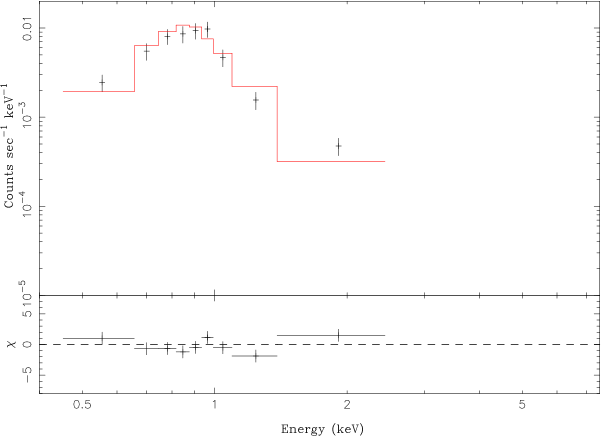
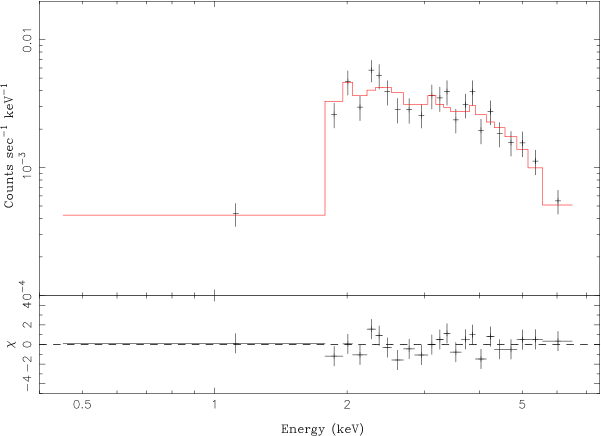
The color coded image (Figure 1) shows that source E is characterized by a hard spectrum, source D is on the contrary extremely soft, and source A is an intermediate case. Here we present the low resolution spectra of source A, B, C, D, and E and the results of the fits to these spectra with isothermal or two-temperature plasma models.
For source A, the higher signal to noise allow us to study separately the low resolution spectra of each observation to highlight possible changes in the spectral characteristics with changes in the X-ray emission level. For all other sources due to the poorer statistics we combined the spectra of all four observations in order to improve the signal-to-noise ratio and better constrain the average spectral parameters.
We extracted the low resolution spectra of source A for each observation, and performed a fit with a thermal model of plasma in collisional ionization equilibrium with variable absorption. A single temperature model, even with variable abundances, does not provide a good fit to the spectrum. Therefore we use a 2-T component model with single . The fits to the spectra obtained for the separate observations do not show significant changes in the spectral parameters within the uncertainties, therefore we summed up the spectra for all four observations to better constrain the parameters of the model.
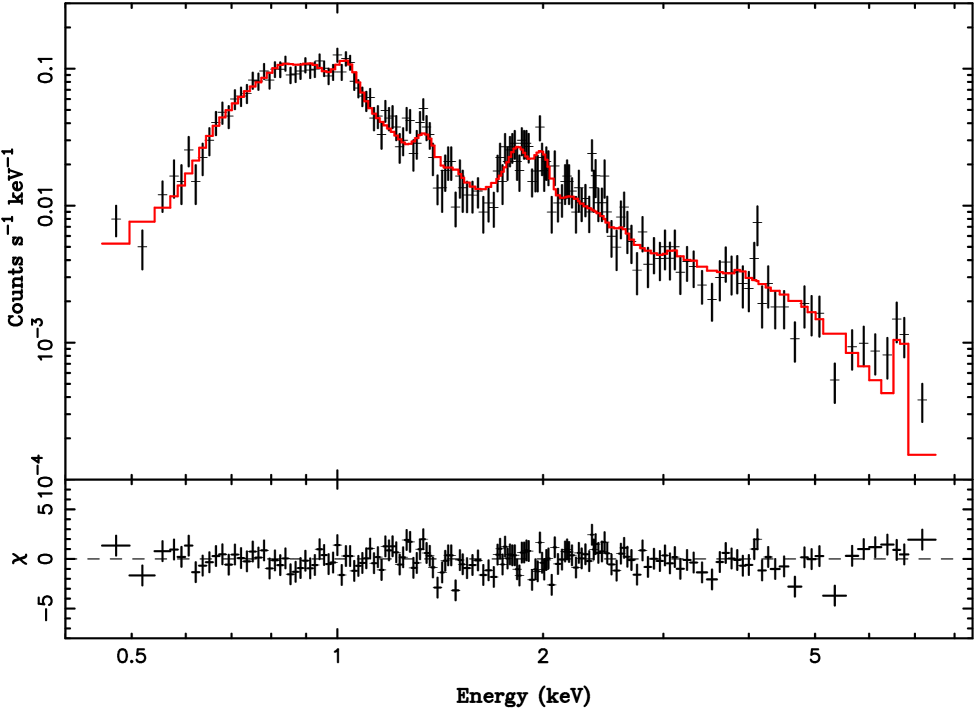
As thoroughly discussed in §4.3.1, the high-resolution spectrum provides additional strong constraints to the fit of the X-ray spectrum. Here we use the abundances found from the analysis of the dispersed spectra and we fit the low-resolutions spectrum with a 2-T model with abundances fixed to those values. This 2-T model, whose parameters are listed in Table 5, provides a good fit to the integrated zero-order spectrum of source A, and shown in Figure 5. We also fitted the model with a similar 2-T model but with variable abundances (model II in Table 5), however the comparison with model I indicates that this model does not provide a significantly better fit: when abundances are let free to vary their best fit values are very similar to the values found from the analysis of the dispersed spectra which provide more robust results because single lines are resolved and used for the determination of the element abundances (see §4.3.1).
Furthermore we explored two more different models: a 2-T model with fixed abundances as in I but different for each temperature component (model III), and 3-T model with fixed abundances as in model I (model IV). The former model explores the scenario of two temperature components corresponding to different X-ray emitting plasma regions with different , as likely for example if the two components are emitted by the two binary stars. Skinner & Yamauchi (1996) already investigated this possibility when analyzing the ASCA data and found a hot more absorbed component (T MK, cm-3) and a cool slightly less absorbed component (T MK, cm-3). They tentatively interpreted the hot absorbed component as produced by an embedded TTS companion, and the cool emission as the HAe star emission; the uncertainties however were too large to provide any real constraint to this model. From our data we find that the absorption of the hot component might be actually lower than the absorption of the cool component, but they are not significantly different within the uncertainties. The 3-T temperature best fit model has a cool component with parameters essentially identical to the 2-T models, while the hot component is redistributed in two hot components at 20 and 80 MK respectively; the only parameter slightly different is the lower absorption . Neither of these two model provides a statistically better fit to the observed spectrum than the 2-T model with fixed abundances, therefore we consider model I (Table 5) the best fit to the low-resolution spectrum.
Comparing these results with the finding of analysis of previous X-ray observations of HD 104237 we note that the overall characteristics (T, ) of its X-ray emission seem remarkably constant for more than a decade, with erg s-1 and at least two temperature components needed to explain its spectrum (Skinner & Yamauchi 1996, FLG03, Skinner et al. 2004; Stelzer et al. 2006). Both FLG03 and Stelzer et al. (2006) find from the analysis of Chandra-acis data slightly higher temperatures for both T components; however this can be explained considering that they assume essentially negligible . Our model parameters compare well with the findings of Skinner et al. (2004) based on XMM-Newton data, the only significant difference being in the derived element abundances which Skinner et al. (2004) find to be significantly above solar for all elements except S, and Fe, about solar333They find Ne, Mg, Si, Ca, to be 2.3, 2, 2, 9.9 times solar respectively for their 2-T model, and 2.2, 1.7, 1.6, 6.6 times solar for their 3-T model. As discussed in §4.3.1 the analysis of the high resolution spectra allows to determine the element abundances accurately, ruling out such large values..
The fits to the low resolution spectra of HD 104237-A all yield values compatible with the visual extinction derived for this star: the value spans the range 0.1-0.2 cm-2, which, using the conversion of Gorenstein (1975), corresponds to in the range 0.45-0.9, in good agreement with values found from optical studies (e.g., 0.3 of van den Ancker et al. 1998, and 0.8 of Malfait et al. 1998). This is also consistent with previous findings of Skinner et al. (2004).
| Parameter aaThe 90% confidence intervals are listed in square brackets. For X-ray flux and luminosity (, ; derived in the 0.5-7.0 keV energy range) we list the value corrected for absorption, while the observed (absorbed) values are in parentheses. Abundances are relative to solar (Anders & Grevesse, 1989). | I bbModel with two temperature components and abundances fixed to the values found from the analysis of the high resolution spectra (see §4.3.1). This is our favored model. | II ccModel with two temperature components and variable abundances. |
|---|---|---|
| 2T | 2T | |
| 1 ( cm-2) | 0.17 [0.09-0.25] | 0.12 [0.07-0.19] |
| T1 ( K) | 4.7 [4.3-5.4] | 5.0 [4.3-5.3] |
| EM1 ( cm-3) | 16.4 [11.6-23.8] | 11.4 [10.6-12.1] |
| 2 ( cm-2) | =1 | =1 |
| T2 ( K) | 27 [24-31] | 27 [24-30] |
| EM2 ( cm-3) | 7.1 [6.0-8.5] | 6.8 [6.3-7.4] |
| T3 ( K) | - | - |
| EM3 ( cm-3) | - | - |
| ( erg cm-2 s-1) | 1.7 (1.1) | 1.5 (1.1) |
| ( erg s-1) | 2.9 (1.7) | 2.4 (1.7) |
| O/O⊙ | =0.65 | 0.46 [0.26-0.63] |
| Ne/Ne⊙ | =1.1 | 1.7 [1.4-1.9] |
| Mg/Mg⊙ | =0.66 | 1.1 [0.6-1.3] |
| Si/Si⊙ | =0.91 | 1.2 [0.7-1.5] |
| S/S⊙ | =1.24 | 1.4 [0.6-1.6] |
| Fe/Fe⊙ | =0.50 | 0.42 [0.41-0.53] |
| (d.o.f.) | 1.12 (149) | 1.05 (143) |
| Parameter | B | C | D | E |
|---|---|---|---|---|
| ( cm-2) | 0.0 [0.0-0.8] | 0.8 [0.-1.7] | 0.44 [0.26-0.67] | 3.4 [2.6-5.2] |
| T ( K) | 8.4 [1.8-10.] | 7.0 [2.1-32.] | 2.8 [2.0-3.6] | 22. [18-34] |
| EM ( cm-3) | 0.085 [0.064-0.11] | 0.13 [0.012-27.] | 2.9 [0.5-18.] | 1.8 [0.5-3.8] |
| ( erg cm-2 s-1) | 0.35 (0.35) | 0.4 (0.09) | 6.5 (0.73) | 7.1 (1.9) |
| ( erg s-1) | 0.057 (0.057) | 0.07 (0.0015) | 1.0 (0.12) | 1.1 (0.31) |
| 1.45 | 1.24 | 1.54 | 0.86 | |
| d.o.f. | 13 | 2 | 6 | 20 |
Note. — The 90% confidence intervals are listed in square brackets. For X-ray flux and luminosity (, ; derived in the 0.5-7.0 keV energy range) we list the value corrected for absorption, while the observed (absorbed) values are in parentheses. For all sources the global metal abundances are fixed to 0.3 times solar.
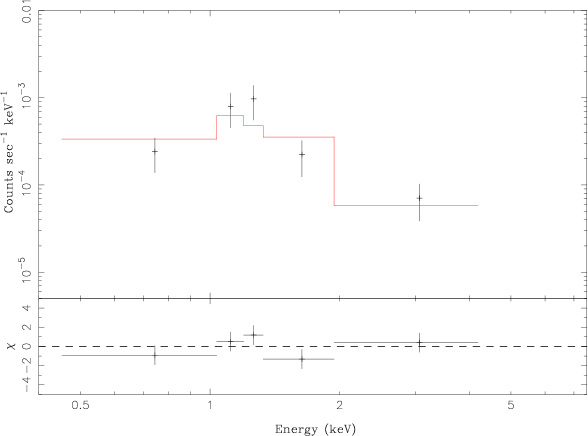
The zero-order spectra of the other four sources are shown in Figure 6 and 7, and the parameters of the fits with corresponding uncertainties are listed in Table 6.
The left panel of Figure 6 shows the zero-order spectrum of source B with the corresponding best fit model. We find that a model with a single temperature at keV and zero absorption reproduces well enough the observed spectrum. The parameters of the X-ray spectrum are rather typical of similar M-type TTS (see discussion in §5). However the relatively low number of counts () obtained for this source does not allow to constrain the parameters very well, as demonstrated in the confidence contours in the -T parameter space shown in the panel below the spectrum plot in Figure 6.
Source C is a very weak source for which very scarce information is available. On the basis of the X-ray observation and the (lack of) optical data, FLG03 proposed a possible identification as a brown dwarf; the association with the young stellar group of HD 104237 is uncertain. In our 145 ks observation we gathered about 54 net counts for source C (subtracting a background estimated on a nearby extraction region); the spectrum and the best fit model are shown in Figure 6. The poor statistics do not provide stringent constraints on the spectral properties of the X-ray emission of this source. Within the uncertainties, we find parameters compatible with the emission by a brown dwarf at the distance of HD 104237 confirming the findings of FLG03.
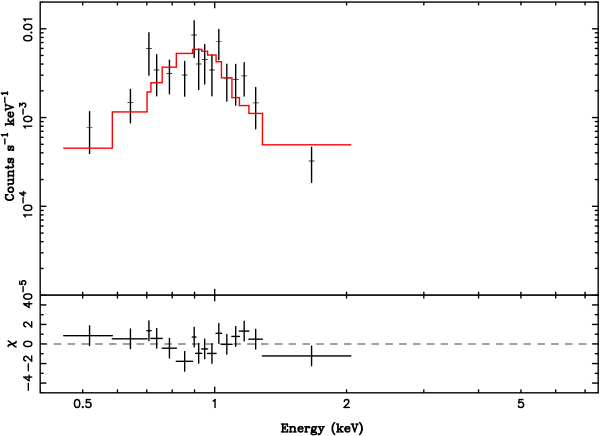
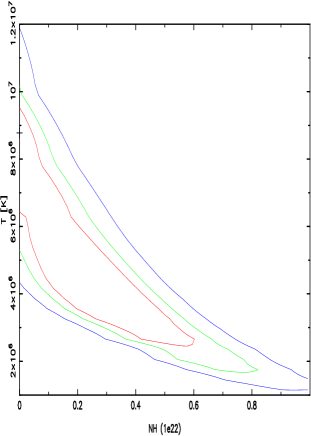
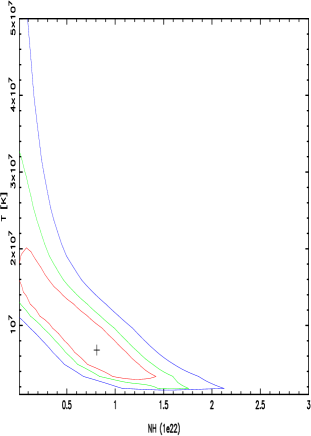
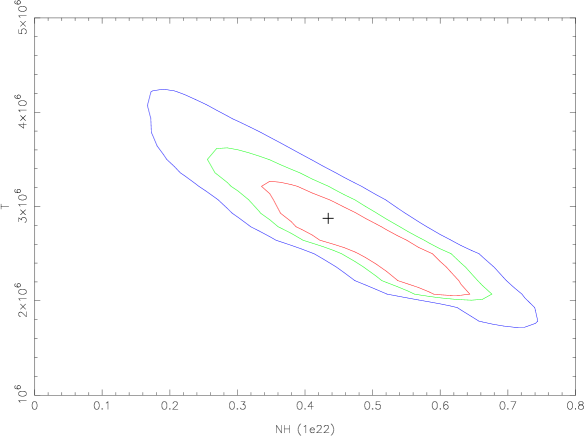
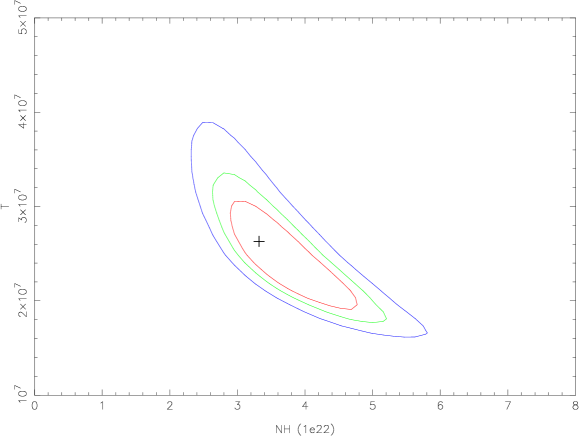
For source D, and E, which are identified as T Tauri stars associated to HD 104237, we have obtained about 250 and 540 zero-order counts respectively, over the 145 ks observation. As already apparent in the color coded image (Fig. 1), source E is heavily absorbed and only the hard photons are detected. The spectral fit indicates in fact a large of cm-2, much larger than the interstellar absorption and that can be therefore ascribed to local absorption from circumstellar material. This source is identified as a K3 classical T Tauri star, and the infrared excess detected by G04 provide further evidence of presence of large amounts of circumstellar material. Source D is a lower mass T Tauri star, of spectral-type M, border-line classical T Tauri star as indicated by the equivalent width very similar to source E (G04). At variance with respect to source E, infrared measurement do not indicate large infrared excess (G04; however the measurements are characterized by poorer statistics for this source and therefore the limits are not very stringent). Its X-ray spectrum is very soft for its emission level (its erg s-1 is rather large for M-type TTS; see §5 for a more detailed discussion), and it is fit well with an isothermal model with K (0.24 keV). These spectral parameters for source D, and E, are well determined within the statistical uncertainties as clear from the confidence contours in the -T space shown in Figure 7 (bottom panels).
4.3 hetgs spectrum of HD 104237-A
A goal of our observing program was to obtain a high resolution X-ray spectrum of the Herbig Ae star with high signal-to-noise ratio, in order to investigate the X-ray production mechanisms in intermediate mass pre-main sequence stars. The HETGS spectrum of sources A and B cannot be resolved spatially in the dispersed spectra. However, our zero-order analysis (§4.2) indicates that component B’s contribution is % that of A. Henceforth we will refer to the spectrum as if from A alone, but it should be kept in mind that there is some level of contamination from B. Other sources in the field are distant enough that order-sorting results in unique determination in meg-heg crossed-order regions. In the 145 ks hetgs observation we obtained slightly more than 5000 total counts in the heg and meg -1,+1 orders.
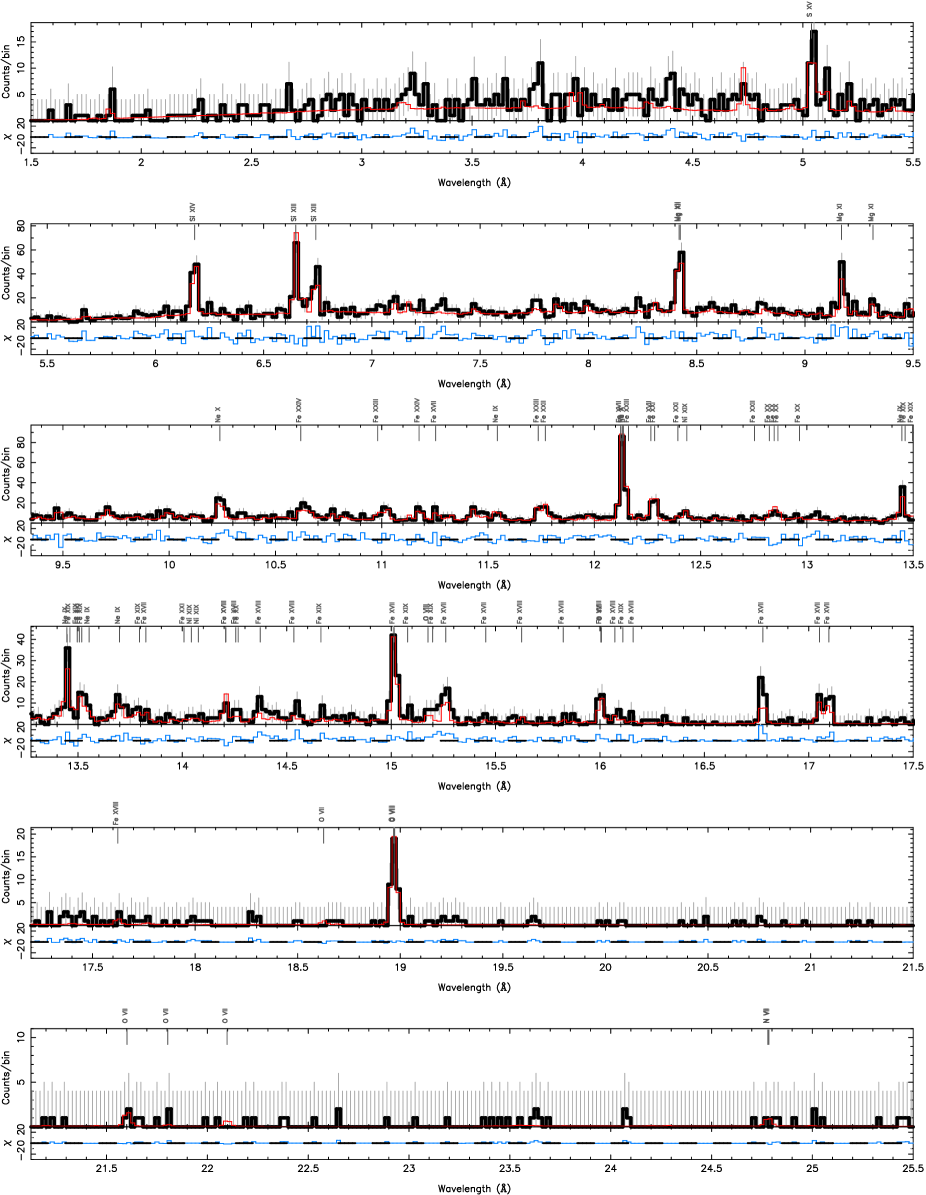
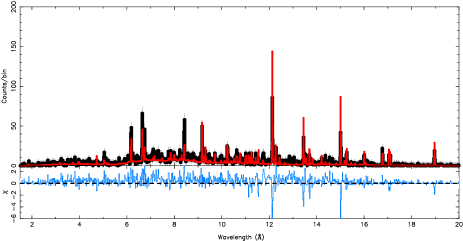
In Figure 8 we show the high resolution spectrum of HD 104237-A, obtained by summing heg and meg spectra (-1 and +1 orders). The spectrum is dominated by line emission of H-like and He-like ions of Si, Mg, Ne, by Fe xvii transitions around 15Å and 17Å, and by transitions of H-like oxygen. Also, some continuum emission is present as well as transitions of highly ionized Fe around Å both indicating the presence of significant amounts of hot ( K) plasma.
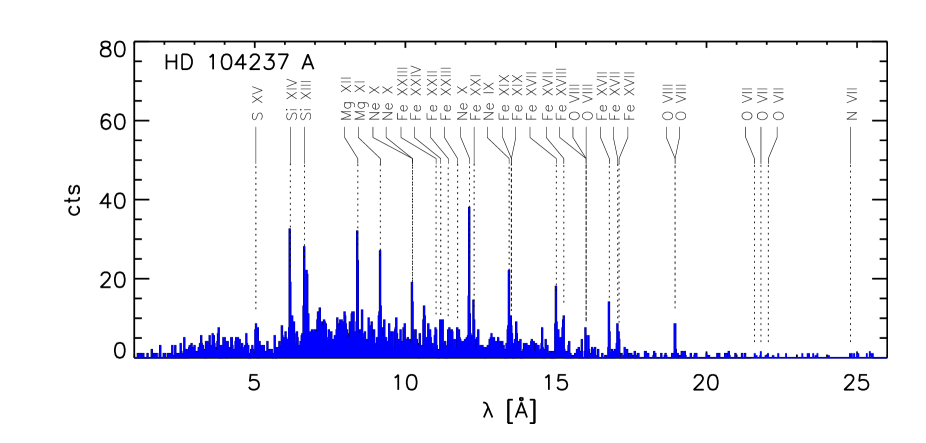
The measured line fluxes together with the statistical errors, are listed in Table 7.
These fluxes were determined by fitting each narrow ( Å) region of interest with a sum of Gaussians and a plasma model continuum, all multiplied by a function of absorption by neutral gas with solar abundances. The model was folded through the instrument response for each of the negative and positive first orders for each grating, then the positive and negative orders were combined before computing the statistic. heg and meg orders were combined when feasible (roughly between 3-16 Å, where the spectral coverage overlaps with significant sensitivity). The line widths were usually frozen at a negligible intrinsic value (in §4.3.3 we describe an independent analysis of line profiles). Only for O viii 19 Å did we need to free the width parameter; this is because of the high dispersion at this wavelength and the fact that the H-Ly-like lines are doublets, with a separation of Å for O viii.
The continuum model was determined by a prior fit of a three temperature-component continuum model to relatively line-free regions of the spectrum, using the Astrophysical Plasma Emission Database continuum emissivities (APED444APED is available from http://cxc.harvard.edu/atomdb/; Smith et al. 2001). This continuum then became an a priori determined component for the line fits. For the absorption, we used the wabs function from the XSPEC module in ISIS and a fixed value of (see §4.3). From these fits we obtained a single (unabsorbed) flux value as well as a wavelength.
We did not physically merge any data or response files into new files. Combination of the orders was done dynamically. There are many advantages to this technique. Foremost is that the individual responses are still applied to the model to compute the predicted counts for each order. Second, individual orders can be noticed and ignored as required for each region. Third, the combination after folding, and before the statistic, increases the signal-to-noise per bin (which does not occur for a joint fit). Fourth, the method is transparent to combination of orders from one observation or from multiple observations, since all responses, counts spectra, and exposure times are still unique. The visualization in Figure 8 shows the summed, combined, and rebinned heg plus meg counts spectrum, but this was not the object directly fit.
Since we have a fairly low-counts spectrum, we also regridded the data (and corresponding response) to the heg binsize ( Å). This allowed us to combine heg and meg spectra, but to keep heg resolution in the heg counts spectrum where feasible. Otherwise, we grouped data by an integral numbers of bins independently for each feature.
For Fe xxv ( Å), we also included the zeroth order spectrum in the fit, since the zeroth order has a comparable number of counts, and though lower resolution, there are no significant confusing lines.
These dynamic functions for combining data, regridding responses and data, and for grouping data are standard features of ISIS.
| Ion | UseaaThe label E indicates the lines used for the emission measure reconstruction. | bbAverage logarithmic temperature (kelvins) of formation. | ccTheoretical wavelengths of identification (from APED), in Å units. If the line is a multiplet, we list the wavelength of the strongest component. | ddMeasured wavelength, in angstrom units (uncertainty is in mÅ). Errors equal to (-) indicate that the line wavelength was frozen because the feature is very weak. | eeMeasured line fluxes in photons cm-2 s-1 for heg+meg first orders, with 1 uncertainties, assuming cm-2. | ffFluxes (in photons cm-2 s-1) predicted using the emission measure distribution model (see Fig. 9). | ggLine flux residuals, . | hhDiscrepancy between observed and predicted fluxes in units of . |
|---|---|---|---|---|---|---|---|---|
| Fe xxv | E | 7.8 | 1.861 | 1.868 (4.8) | 1.15 (0.34) | 0.712 | 0.441 | 1.30 |
| Ar xviii | E | 7.7 | 3.734 | 3.738 (15.) | 0.18 (0.23) | 0.154 | 0.025 | 0.11 |
| Ar xvii | E | 7.4 | 3.949 | 3.949 (8.5) | 0.56 (0.47) | 0.223 | 0.335 | 0.71 |
| Ar xvii | 7.3 | 3.968 | 3.953 (15.) | 0.001 (0.37) | 0.061 | -0.060 | -0.16 | |
| S xvi | 7.5 | 3.992 | 4.007 (4.7) | 0.26 (0.27) | 0.249 | 0.006 | 0.02 | |
| S xv | E | 7.3 | 4.088 | 4.088 (15.) | 0.07 (0.18) | 0.064 | 0.006 | 0.03 |
| S xvi | E | 7.6 | 4.730 | 4.729 (11.) | 1.65 (0.85) | 1.221 | 0.431 | 0.51 |
| Si xiv | E | 7.4 | 4.947 | 4.947 (-) | 0.11 (0.19) | 0.086 | 0.019 | 0.10 |
| S xv | E | 7.2 | 5.039 | 5.040 (2.0) | 2.22 (0.61) | 1.670 | 0.551 | 0.91 |
| S xv | E | 7.2 | 5.065 | 5.065 (-) | 0.23 (0.32) | 0.390 | -0.160 | -0.49 |
| S xv | E | 7.2 | 5.102 | 5.107 (5.8) | 1.03 (0.46) | 0.576 | 0.453 | 0.99 |
| Si xiv | E | 7.4 | 5.217 | 5.219 (2.8) | 0.86 (0.46) | 0.407 | 0.450 | 0.99 |
| Si xiii | 7.1 | 5.285 | 5.285 (-) | 0.002 (0.18) | 0.062 | -0.059 | -0.33 | |
| Si xiii | E | 7.1 | 5.405 | 5.405 (-) | 0.14 (0.29) | 0.136 | 0.000 | 0.00 |
| Si xiv | E | 7.4 | 6.183 | 6.181 (2.1) | 3.51 (0.88) | 3.053 | 0.462 | 0.53 |
| Si xiv | 7.1 | 6.265 | 6.256 (15.) | 0.45 (0.57) | 0.072 | 0.374 | 0.65 | |
| Mg xii | 7.2 | 6.580 | 6.580 (-) | 0.001 (0.11) | 0.063 | -0.062 | -0.59 | |
| Si xiii | E | 7.0 | 6.648 | 6.650 (1.1) | 3.63 (0.48) | 3.609 | 0.018 | 0.04 |
| Si xiii | 7.0 | 6.687 | 6.687 (-) | 0.18 (0.21) | 0.688 | -0.506 | -2.44 | |
| Si xiii | 6.8 | 6.720 | 6.720 (-) | 0.60 (0.28) | 0.035 | 0.561 | 2.02 | |
| Si xiii | E | 7.0 | 6.740 | 6.743 (1.3) | 2.06 (0.35) | 1.465 | 0.594 | 1.69 |
| Mg xii | E | 7.2 | 7.106 | 7.107 (5.5) | 0.83 (0.32) | 0.458 | 0.370 | 1.15 |
| Al xiii | 7.4 | 7.171 | 7.167 (11.) | 0.40 (0.28) | 0.686 | -0.284 | -1.02 | |
| Mg xi | 6.9 | 7.310 | 7.317 (6.8) | 0.56 (0.31) | 0.051 | 0.508 | 1.65 | |
| Fe xxii | E | 7.1 | 7.681 | 7.667 (15.) | 0.06 (0.19) | 0.037 | 0.020 | 0.11 |
| Al xii | E | 7.0 | 7.757 | 7.761 (15.) | 0.62 (0.37) | 0.243 | 0.374 | 1.00 |
| Al xii | 6.9 | 7.805 | 7.790 (15.) | 0.06 (0.19) | 0.079 | -0.015 | -0.08 | |
| Mg xi | E | 6.9 | 7.850 | 7.852 (5.8) | 0.57 (0.33) | 0.349 | 0.218 | 0.66 |
| Al xii | E | 6.9 | 7.872 | 7.879 (15.) | 0.26 (0.30) | 0.220 | 0.038 | 0.12 |
| Fe xxiii | 7.2 | 7.901 | 7.897 (15.) | 0.33 (0.35) | 0.062 | 0.267 | 0.76 | |
| Fe xxiv | E | 7.4 | 7.986 | 7.988 (10.) | 0.35 (0.38) | 0.192 | 0.161 | 0.43 |
| Fe xxiv | E | 7.4 | 7.996 | 8.011 (7.5) | 0.28 (0.29) | 0.097 | 0.179 | 0.63 |
| Fe xxiii | E | 7.2 | 8.304 | 8.300 (11.) | 0.28 (0.33) | 0.229 | 0.052 | 0.16 |
| Fe xxiv | E | 7.4 | 8.316 | 8.317 (15.) | 0.20 (0.31) | 0.217 | -0.018 | -0.06 |
| Fe xxiv | 7.4 | 8.376 | 8.389 (-) | 0.34 (0.34) | 0.083 | 0.253 | 0.75 | |
| Mg xii | E | 7.2 | 8.422 | 8.422 (1.6) | 3.65 (0.50) | 3.626 | 0.026 | 0.05 |
| Fe xxi | E | 7.1 | 8.574 | 8.567 (4.9) | 0.58 (0.21) | 0.188 | 0.395 | 1.88 |
| Fe xxiii | E | 7.2 | 8.815 | 8.816 (3.9) | 0.69 (0.28) | 0.247 | 0.447 | 1.59 |
| Fe xxii | E | 7.1 | 8.975 | 8.976 (6.6) | 0.42 (0.28) | 0.321 | 0.095 | 0.34 |
| Mg xi | E | 6.8 | 9.169 | 9.169 (1.3) | 4.24 (0.78) | 3.046 | 1.195 | 1.54 |
| Fe xxi | 7.1 | 9.194 | 9.194 (-) | 1.14 (0.44) | 0.144 | 0.994 | 2.24 | |
| Mg xi | 6.8 | 9.230 | 9.230 (-) | 1.39 (0.50) | 0.489 | 0.895 | 1.80 | |
| Mg xi | 6.8 | 9.314 | 9.315 (2.7) | 2.20 (0.65) | 1.447 | 0.755 | 1.17 | |
| Fe xxii | 7.1 | 9.393 | 9.393 (-) | 0.001 (0.20) | 0.072 | -0.071 | -0.36 | |
| Ne x | 7.0 | 9.481 | 9.472 (3.2) | 0.48 (0.25) | 0.379 | 0.096 | 0.38 | |
| Fe xix | 6.9 | 9.695 | 9.680 (3.8) | 0.72 (0.36) | 0.122 | 0.601 | 1.66 | |
| Ne x | E | 7.0 | 9.708 | 9.708 (-) | 1.35 (0.61) | 0.858 | 0.492 | 0.81 |
| Fe xx | E | 7.0 | 9.727 | 9.727 (-) | 0.51 (0.39) | 0.143 | 0.362 | 0.94 |
| Ni xix | E | 6.8 | 10.110 | 10.111 (9.6) | 0.31 (0.36) | 0.233 | 0.074 | 0.20 |
| Fe xx | E | 7.0 | 10.120 | 10.127 (14.) | 0.39 (0.27) | 0.161 | 0.232 | 0.87 |
| Ne x | E | 7.0 | 10.239 | 10.240 (1.7) | 3.98 (0.83) | 2.817 | 1.165 | 1.41 |
| Fe xxiv | E | 7.4 | 10.619 | 10.619 (-) | 1.36 (0.60) | 1.576 | -0.217 | -0.36 |
| Fe xix | E | 6.9 | 10.641 | 10.641 (-) | 1.05 (0.78) | 0.273 | 0.772 | 1.00 |
| Fe xix | E | 6.9 | 10.649 | 10.649 (-) | 0.42 (0.60) | 0.264 | 0.152 | 0.25 |
| Fe xxiv | E | 7.4 | 10.663 | 10.663 (-) | 0.80 (0.58) | 0.830 | -0.026 | -0.04 |
| Fe xxiii | 7.2 | 10.981 | 10.983 (13.) | 0.39 (0.47) | 1.443 | -1.053 | -2.26 | |
| Ne ix | E | 6.7 | 11.001 | 11.001 (-) | 1.23 (0.61) | 0.418 | 0.812 | 1.33 |
| Fe xxiii | E | 7.2 | 11.019 | 11.019 (-) | 1.34 (0.72) | 0.953 | 0.382 | 0.53 |
| Fe xxiv | E | 7.4 | 11.029 | 11.029 (-) | 1.25 (0.65) | 1.047 | 0.205 | 0.32 |
| Fe xvii | 6.7 | 11.131 | 11.123 (15.) | 0.001 (0.09) | 0.810 | -0.809 | -8.82 | |
| Fe xxiv | E | 7.4 | 11.176 | 11.176 (2.3) | 2.72 (0.77) | 1.915 | 0.799 | 1.04 |
| Fe xvii | E | 6.7 | 11.254 | 11.251 (2.8) | 2.54 (0.76) | 1.146 | 1.397 | 1.84 |
| Fe xviii | E | 6.8 | 11.326 | 11.321 (4.5) | 1.61 (0.64) | 0.838 | 0.766 | 1.19 |
| Fe xviii | E | 6.8 | 11.527 | 11.524 (6.8) | 0.99 (0.61) | 0.890 | 0.101 | 0.17 |
| Ne ix | E | 6.6 | 11.544 | 11.548 (4.9) | 1.67 (0.69) | 1.362 | 0.304 | 0.44 |
| Fe xxiii | 7.2 | 11.736 | 11.741 (1.8) | 4.96 (0.99) | 3.323 | 1.637 | 1.66 | |
| Fe xxii | E | 7.1 | 11.770 | 11.773 (2.3) | 3.34 (1.01) | 3.561 | -0.223 | -0.22 |
| Ne x | E | 6.9 | 12.135 | 12.131 (1.0) | 24.0 (2.9) | 24.246 | -0.254 | -0.09 |
| Fe xxiii | 7.2 | 12.161 | 12.150 (4.2) | 4.88 (2.05) | 1.934 | 2.943 | 1.43 | |
| Fe xvii | E | 6.7 | 12.266 | 12.265 (3.4) | 3.60 (1.37) | 3.113 | 0.483 | 0.35 |
| Fe xxi | E | 7.1 | 12.284 | 12.284 (2.1) | 7.82 (1.75) | 7.538 | 0.282 | 0.16 |
| Fe xx | E | 7.0 | 13.385 | 13.396 (6.5) | 1.53 (1.17) | 1.043 | 0.487 | 0.42 |
| Fe xix | E | 6.9 | 13.423 | 13.423 (-) | 2.57 (1.38) | 0.559 | 2.008 | 1.46 |
| Ne ix | E | 6.6 | 13.447 | 13.449 (1.5) | 15.2 (2.7) | 12.577 | 2.657 | 1.00 |
| Fe xix | E | 6.9 | 13.462 | 13.462 (-) | 2.34 (1.73) | 1.274 | 1.066 | 0.62 |
| Fe xix | 6.9 | 13.497 | 13.497 (-) | 0.36 (0.74) | 2.245 | -1.884 | -2.54 | |
| Fe xix | E | 6.9 | 13.518 | 13.519 (1.9) | 9.60 (2.34) | 4.958 | 4.646 | 1.98 |
| Ne ix | 6.6 | 13.552 | 13.554 (3.3) | 3.95 (1.57) | 1.904 | 2.041 | 1.30 | |
| Fe xix | E | 6.9 | 13.645 | 13.653 (-) | 1.49 (2.46) | 0.801 | 0.687 | 0.28 |
| Ne ix | E | 6.6 | 13.699 | 13.694 (6.4) | 6.91 (3.20) | 6.299 | 0.607 | 0.19 |
| Fe xx | E | 7.0 | 13.767 | 13.762 (10.) | 3.77 (3.37) | 0.917 | 2.856 | 0.85 |
| Fe xix | E | 6.9 | 13.795 | 13.790 (7.6) | 3.90 (3.33) | 2.036 | 1.863 | 0.56 |
| Fe xvii | E | 6.7 | 13.825 | 13.827 (11.) | 3.92 (3.26) | 2.787 | 1.129 | 0.35 |
| Fe xviii | E | 6.8 | 14.208 | 14.207 (8.3) | 9.60 (4.83) | 12.652 | -3.051 | -0.63 |
| Fe xviii | E | 6.8 | 14.256 | 14.249 (13.) | 3.57 (3.68) | 2.445 | 1.122 | 0.31 |
| Fe xx | E | 7.0 | 14.267 | 14.268 (13.) | 3.59 (4.22) | 1.561 | 2.030 | 0.48 |
| Fe xviii | E | 6.8 | 14.343 | 14.355 (15.) | 1.52 (3.24) | 1.429 | 0.090 | 0.03 |
| Fe xviii | E | 6.8 | 14.373 | 14.374 (5.4) | 9.40 (3.77) | 3.077 | 6.324 | 1.68 |
| Fe xviii | 6.8 | 14.425 | 14.410 (15.) | 3.49 (2.96) | 0.668 | 2.821 | 0.95 | |
| Fe xviii | 6.8 | 14.534 | 14.547 (6.1) | 4.36 (3.49) | 2.365 | 1.999 | 0.57 | |
| Fe xix | E | 6.9 | 14.664 | 14.667 (11.) | 4.95 (3.14) | 1.558 | 3.389 | 1.08 |
| O viii | E | 6.7 | 14.821 | 14.817 (4.4) | 4.37 (1.78) | 1.174 | 3.193 | 1.79 |
| Fe xvii | E | 6.7 | 15.014 | 15.014 (3.4) | 32.8 (7.4) | 39.169 | -6.377 | -0.86 |
| Fe xix | E | 6.9 | 15.079 | 15.087 (9.2) | 6.55 (6.59) | 1.809 | 4.738 | 0.72 |
| O viii | E | 6.7 | 15.176 | 15.178 (15.) | 3.26 (6.12) | 2.741 | 0.515 | 0.08 |
| Fe xix | E | 6.9 | 15.198 | 15.209 (11.) | 7.39 (6.26) | 1.514 | 5.875 | 0.94 |
| Fe xvii | E | 6.7 | 15.261 | 15.261 (5.5) | 17.3 (6.8) | 11.351 | 5.939 | 0.87 |
| Fe xvii | E | 6.7 | 15.453 | 15.451 (15.) | 4.26 (4.53) | 1.484 | 2.778 | 0.61 |
| Fe xviii | 6.8 | 15.494 | 15.488 (15.) | 2.17 (3.32) | 0.386 | 1.784 | 0.54 | |
| Fe xviii | E | 6.8 | 15.625 | 15.625 (15.) | 2.51 (3.69) | 3.604 | -1.096 | -0.30 |
| Fe xviii | 6.8 | 15.759 | 15.763 (15.) | 3.37 (4.31) | 0.497 | 2.876 | 0.67 | |
| Fe xviii | E | 6.8 | 15.824 | 15.826 (15.) | 4.60 (5.04) | 2.251 | 2.346 | 0.47 |
| Fe xviii | E | 6.8 | 15.870 | 15.875 (15.) | 5.22 (5.49) | 1.200 | 4.018 | 0.73 |
| O viii | 6.7 | 16.006 | 16.004 (2.2) | 21.7 (5.0) | 9.436 | 12.242 | 2.43 | |
| Fe xviii | E | 6.8 | 16.071 | 16.075 (6.1) | 4.22 (2.39) | 5.304 | -1.087 | -0.45 |
| Fe xix | 6.9 | 16.110 | 16.095 (2.5) | 7.60 (2.97) | 2.642 | 4.963 | 1.67 | |
| Fe xviii | 6.8 | 16.159 | 16.150 (4.0) | 6.05 (2.49) | 2.132 | 3.922 | 1.57 | |
| Fe xvii | E | 6.7 | 16.780 | 16.779 (4.0) | 41.4 (11.6) | 21.558 | 19.810 | 1.71 |
| Fe xvii | E | 6.7 | 17.051 | 17.052 (6.3) | 29.4 (10.9) | 26.525 | 2.838 | 0.26 |
| Fe xvii | E | 6.7 | 17.096 | 17.100 (4.4) | 37.8 (11.2) | 24.814 | 13.014 | 1.16 |
| Fe xviii | 6.8 | 17.623 | 17.635 (4.7) | 6.14 (3.39) | 4.127 | 2.010 | 0.59 | |
| O vii | 6.4 | 17.768 | 17.762 (8.1) | 4.87 (3.26) | 0.663 | 4.203 | 1.29 | |
| Fe xvii | E | 6.6 | 17.793 | 17.778 (15.) | 0.001 (1.48) | 0.000 | 0.000 | 0.00 |
| O vii | 6.4 | 18.627 | 18.627 (-) | 0.001 (1.24) | 2.329 | -2.328 | -1.87 | |
| Ca xviii | E | 7.1 | 18.691 | 18.691 (-) | 0.46 (3.05) | 0.644 | -0.185 | -0.06 |
| O viii | E | 6.7 | 18.970 | 18.971 (2.2) | 104. (17.) | 89.094 | 14.826 | 0.85 |
| Ca xvi | 6.7 | 20.859 | 20.869 (12.) | 7.09 (7.70) | 0.043 | 7.046 | 0.92 | |
| N vii | 6.5 | 20.910 | 20.881 (30.) | 0.001 (5.28) | 1.958 | -1.958 | -0.37 | |
| O vii | E | 6.3 | 21.601 | 21.605 (10.) | 20.0 (16.3) | 28.511 | -8.519 | -0.52 |
| O vii | 6.3 | 21.802 | 21.817 (6.4) | 17.3 (15.3) | 3.861 | 13.392 | 0.88 | |
| O vii | 6.3 | 22.098 | 22.083 (15.) | 2.20 (9.83) | 16.800 | -14.603 | -1.49 | |
| N vii | E | 6.5 | 24.782 | 24.797 (15.) | 20.4 (14.3) | 13.131 | 7.253 | 0.51 |
4.3.1 Emission Measure Distribution and Abundances
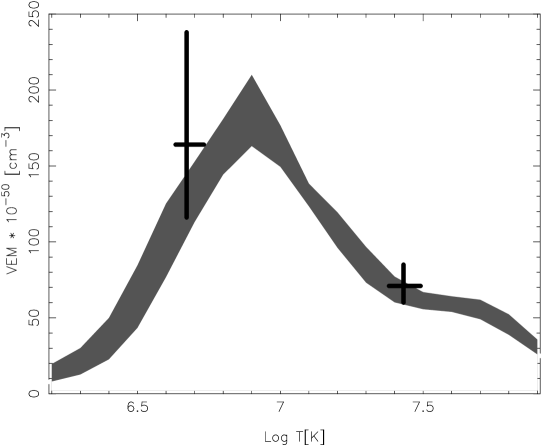
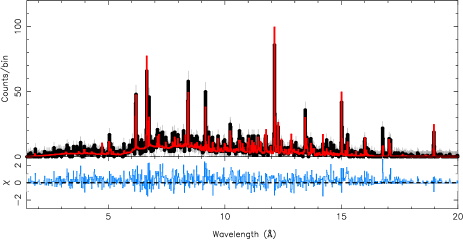
We reconstructed an emission measure distribution () and elemental abundances by minimizing line flux residuals for features marked in Table 7 with an “E” in the “Use” column. This was an iterative process, since some features are blended or mis-identified: we excluded those with very large residuals during the fitting process. We also excluded the He-like resonance and intercombination lines since they are density dependent. Theoretical emissivities from APED were integrated over the temperature range of sensitivity after weighting by the trial and abundances. The fit was subject to the constraint that the be smooth. To obtain some estimate of the uncertainty in the reconstructed and abundances, we performed 100 Monte-Carlo iterations in which the observed fluxes were randomly perturbed using a Gaussian distribution with their measurement uncertainties as the Gaussian . We computed the standard deviation in the resulting at each temperature and for the abundances and use these for the fit uncertainty. This is not rigorously correct because it does not account for correlations in the allowed solutions. Other examples of this method, and further details, can be found in Huenemoerder et al. (2006, 2007), along with requisite caveats and limitations of emission measure modeling. As a final check, the synthetic spectrum was evaluated and compared to the observation (see Figure 10). Model line fluxes are listed in Table 7, the is shown in Figures 9, and abundances are given in Table 8.
The emission measure distribution shown in Figure 9 is characterized by significant amount of plasma over a wide temperature range, as anticipated on the basis of a visual inspection of the spectrum, and by a peak at . These characteristics are similar to the temperature distributions derived for several coronae of late-type stars (see e.g., Sanz-Forcada et al. 2003), typically presenting an emission measure peak around K. However, coronae of active stars with X-ray luminosity erg s-1 often present an additional significant peak at higher temperatures (a few K) typically associated with flaring activity. Hot plasma is present in HD 104237-A as well, but with a lower relative weight than observed in other stellar coronae at a similar activity level.
In Figure 9 we also compare the model with the model obtained from the low-resolution spectra (model I in Table 5): the emission measure values for the components of the model are scaled for comparison purposes, but their sum compares well with the integrated emission measure distribution. Figure 10 shows the synthetic spectrum from the model, compared with the actual spectrum. Figure 11 compares the predicted spectrum from the two models with the actual observed spectrum and shows that while the overall characteristics of the model are somewhat similar to the detailed model, the latter reproduces the spectral features of the high-resolution spectrum much more satisfactorily.
| Element | aaElement abundances of the X-ray emitting plasma from the high resolution X-ray spectrum, expressed as relative to solar (Grevesse & Sauval, 1998). We also list 1 errors. | bbElement abundances of the X-ray emitting plasma from the high resolution X-ray spectrum, expressed as relative to photospheric abundances. Errors are calculated propagating the errors on both the photospheric abundances, and the abundances of the X-ray emitting plasma. | [dex] ccPhotospheric values of element abundances from Acke & Waelkens (2004); for Si we list their values derived from Si i, and from Si ii respectively. |
|---|---|---|---|
| O | |||
| Ne | … | … | |
| Mg | |||
| Si | |||
| S | |||
| Fe |
The element abundances of the X-ray emitting plasma of HD 104237-A derived from the analysis of its hetgs spectrum are listed in Table 8, both compared to solar values (Grevesse & Sauval, 1998) and to the photospheric values of HD 104237-A from Acke & Waelkens (2004). These abundances show a general depletion of elements in the X-ray emitting plasma with the exception of S, generally in line with X-ray studies of other PMS stars (e.g., Maggio et al. 2007), however with some possible differences: the Ne/Fe abundance ratio is relatively low (),with respect to the extremely high values observed in other young stars (see e.g., Kastner et al. 2002; Argiroffi et al. 2005 finding values of Ne/Fe for PMS stars in TWA); also, possible dependence of fractionation on the element first ionization potential, as often observed in coronae of late-type stars (e.g., Telleschi et al. 2005), is not obviously present in the X-ray emitting plasma of HD 104237-A.
4.3.2 Density and Temperature Diagnostics from Line Ratios
The He-like triplets, in particular the cooler Ne ix and O vii triplets, thanks to their sensitivity to plasma density and temperature (e.g., Gabriel & Jordan 1969), and to photoexcitation from possible UV field, provide effective diagnostics for the X-ray emission mechanism in young stars (e.g., Kastner et al. 2002). In particular, in absence of intense UV field, the ratio of the forbidden to intercombination line, , is sensitive to plasma densities above a critical density value that depends on the element and increases from approximately cm-3 for O vii to about cm-3 for Si xiii. The presence of strong UV field, either photospheric for hot stars or produced in accretion shocks in young stars, affects the ratio similarly to high densities, i.e. decreasing its value. In the case of HD 104237-A the stellar effective temperature is low enough (see Table 2) to rule out any effect of the photospheric UV field on the X-ray triplet lines. The ratio of the summed forbidden and intercombination lines with the resonance line, , provides instead a temperature diagnostic (though with some caveats on the reliability of the diagnostics, as discussed e.g., by Testa et al. 2004).
The O vii He-like triplet at 22Å is too weak in hetgs spectrum of HD 104237-A to provide any meaningful diagnostic (only 3 counts are detected for the strongest triplet line, the 21.6Å resonance line). Ne ix, Mg xi, and Si xiii have good signal-to-noise ratios and provide useful info on the plasma density and temperature. The Si xiii triplet is at the low density limit as for all other observed high resolution spectra of late-type stars (e.g., Testa et al. 2004).
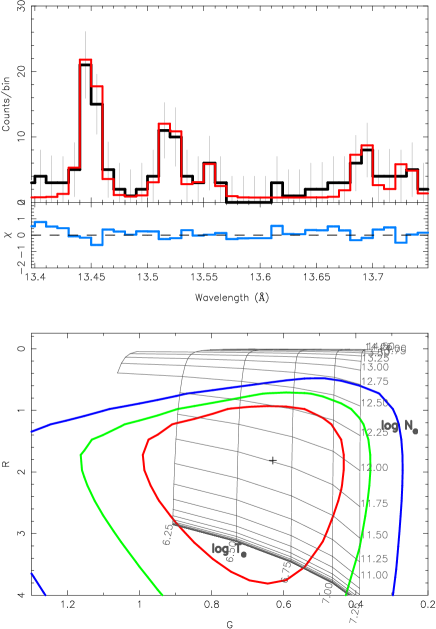
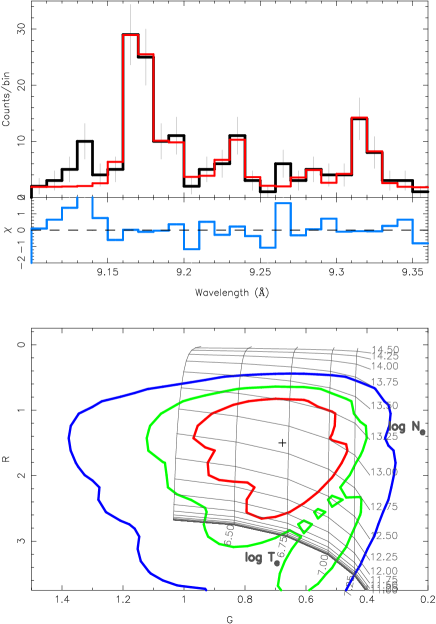
In Figure 12 we show the Ne ix and Mg xi triplet regions with our best fit parametric models (upper panels), and the confidence contours in the parameter space of the line ratios and (lower panels). In the and parameter space we overplot the grid of corresponding densities and temperature according to Smith et al. (2001). The fitting model for the Ne ix triplet region includes the blends of mostly Fe lines as computed from the model (see e.g., Huenemoerder et al. 2006). The best fit to the Ne ix triplet lines corresponds to a density cm-3; however the relatively low statistics of the spectrum does not allow to put stringent limits on this value and we can reliably derive only an upper limit to the density of about cm-3.
The fits to the Mg xi triplet region included Ne x Ly series blends, and blends of Fe lines (see e.g., Testa et al. 2004). Mg xi allows to put slightly better constraints on the plasma density: the best fit density is cm-3 with a interval cm-3, somewhat high compared with typical values of active late-type stars (e.g., Testa et al. 2004). Also the ratio is somewhat extreme when compared with typical coronal values, being at the low-end of the range of measured ratios (Testa et al., 2004), even though the rather large uncertainties do not allow to draw definite conclusions. Interpreting the ratio as a temperature diagnostics would point to a plasma temperature in agreement with the expected values for the formation of these lines. This is at variance with findings relative to He-like triplets of stellar coronae whose ratios generally underestimate the plasma temperature. Therefore it is difficult to interpret an unusually low ratio in HD 104237-A as a temperature effect considering that its temperature structure does not seem peculiar when compared to stellar coronae. We note that also the Ne ix ratio has a value among the lowest measured in a large sample of active stars at different activity levels (Ness et al., 2004).
4.3.3 Line profiles
Spectral line profiles in X-rays allow us to probe the bulk velocity of hot plasma and its turbulent state. We carried out the measurement of line centroid positions of several prominent emission lines detected in the meg spectra with sufficient counts for meaningful fits.
The methodology used here is somewhat different from the line-flux measurements described in §4.3. Line centroids are very sensitive to blending, even with weak features. Here we take advantage of a model spectrum which predicts the relative positions and relative strengths of many features in any region. Including thermal broadening in the flux evaluation automatically accounts for any line-width difference between species, and turbulent broadening can be included to test for excess width. For the best accuracy, these fits were only done on strong-line regions, whereas flux measures for emission measure reconstruction were also done for weak lines, since the absence of a line can be significant for the temperature structure. Since the line widths are barely resolved, if at all, the width measurement can best be done on only the highest signal-to-noise features, and though the heg has higher spectral resolution, the higher counts in the meg can makes its determination of width more significant.
Utilizing the latest calibration product for meg line spread function (available for Chandra CALDB v.3.4.0 or higher), grating ARFs and RMFs are generated for meg +1 and -1 orders. Then the order meg spectra are simultaneously fit with a simple 2T model similar to the ones listed in Table 5 (close to model I) with line centroid and broadening parameters as free parameters. We have taken thermal broadening into account upon fitting. Since the observations were taken at four different times over the two-month period, each spectrum was corrected for appropriate barycentric motion of the Earth (-8.3, -9.9, -9.4, and +13 km s-1 for ObsID 6444, 7319, 7320 and 7326, respectively) prior to the fitting process.
| Ion | [Å] | [km s-1]aaThe 99% confidence intervals are listed in square brackets. |
|---|---|---|
| Si xiv | 6.183 | 0.0 [] |
| Mg xii | 8.422 | 76 [] |
| Mg xi | 9.169 | 120 [] |
| Ne x | 12.135 | 0.0 [] |
| Fe xvii | 15.014 | 43 [] |
| Fe xvii | 17.096 | 41 [] |
| O viii | 18.970 | 43 [] |
We selected eight prominent lines in a wavelength range from 6 to 20Å: the H-like Ly transitions of Si, Mg, Ne, and O, and the Fe xvii transitions at 15.0 and 17.1Å. The measured line velocities are tabulated in Table 9.
The mean line centroid velocity of the source is km s-1 with a 99% confidence level. The large uncertainty in the measurement results from the low S/N level detected in each emission lines. As noted, HD 104237-A is a binary system. Generally a small radial velocity correction should be made – prior to line fitting – for a spectrum obtained at each epoch. However, we intentionally neglect this since (i) we do not know the relative contribution of each component to the spectra and (ii) all of the spectra were obtained in the phase ranging from 0.25 – 0.5 (see bottom panel of Figure 4), placing the stars near apastron where the change in radial velocity happens to be very small, of order of 7 km s-1 based on Böhm et al. 2004.
At the observed times, the radial velocity of the primary star, the HAe star, should be observed at km s-1, whereas the companion, K3, should be at km s-1. While the measured radial velocity prefers the primary star to be the source of hard X-rays, the companion is not statistically ruled out as the source. Furthermore, with the radial velocity correction of the systemic binary motion, the measured line centroid velocity becomes consistent with the hard X-ray source being at rest.
We also measured the width of the lines, using meg (and heg for lines with sufficient counts like the Ne x Ly transition) order spectra. The line widths are consistent with zero broadening for all the strongest lines, with upper limit for of the order of 300 km s-1. The fit to the Fe xvii 15Å line provides a best fit width corresponding to a turbulent velocity of about 280 km s-1, and barely compatible with 0 at the 99% level. However, we note that the statistics are limited, and a small error in the continuum can cause to be compatible with 0 at the 68% confidence level. Also, the other Fe xvii lines around 17Å are compatible with zero broadening casting doubts on the results to the fit to the 15Å line.
5 Discussion
The HD 104237 young association, with presumably coeval stars spanning 0.15-2.3, offers a laboratory for studying X-ray emission in young low/intermediate mass stars. The brightest X-ray source (and also so in optical, UV, and IR bands) in the stellar group is a system harboring a binary of intermediate mass stars (2.25/1.75 ) with a HAe star, and a slightly lower mass star in an early evolutionary stage with spectral type K3. The Herbig Ae star HD 104237-A with its proximity, high , and low line-of-sight extinction is one of the few HAe stars accessible to high resolution X-ray spectroscopy, allowing us to investigate the nature of the X-ray emission from young intermediate mass stars that is still a mystery. The age of the binary system is estimated between 2 and 5 Myr (Böhm et al. 2004, FLG03), and the HAe star is correspondingly in the late stages of its pre-main sequence phase.
The long Chandra-hetgs observation provides important clues to the X-ray emission mechanism through spectral diagnostics and variability. Different scenarios may be considered to explain the X-ray emission of HD 104237-A: (1) all X-ray emission comes from the HAe star; (2) all X-ray emission comes from the companion; (3) both binary components contribute to the observed X-ray emission. The companion hypothesis is still considered a viable explanation for the X-ray emission of Herbig Ae stars, considering that these intermediate mass stars are not expected to produce X-rays either through wind shocks, as in earlier type stars, because their winds are weak, or through magnetic activity as in later type stars, because they should not have an efficient solar-like dynamo mechanism producing magnetic fields since they lack sizable convective zones. However, some alternative mechanisms might be at work in the early stages of their evolution: (i) X-ray emission from accretion shocks, as in some classical T Tauri stars (e.g., Kastner et al. 2002), (ii) coronal activity due to non-solar dynamo mechanism (Tout & Pringle, 1995), (iii) magnetically confined winds (Babel & Montmerle, 1997). All these mechanisms require the presence of some sizable magnetic field in this evolutionary stage. The magnetic field in HAe stars has been investigated on large sample of these intermediate mass stars, and a small number of them do show evidence of magnetic fields of strength from a few tens of Gauss to a few hundreds of Gauss in a few cases (Donati et al., 1997; Hubrig et al., 2004; Wade et al., 2005, 2007; Hubrig et al., 2007; Catala et al., 2007). HD 104237-A is one of those showing that, whatever the mechanism that generates it, at some stage these intermediate mass stars can have magnetic fields. The expected X-ray properties are different depending on the mechanisms with (i) characterized by soft X-rays emitted by high density plasma, and harder X-ray emission due to magnetic confinement (and presumably heating) in (ii), and (iii). In particular in the scenario of coronal activity we expect a large degree of variability and flare-like dynamic events.
What do we know from observations of other HAe stars? X-ray observations with Chandra allow to resolve the Herbig Ae stars from close (′′) companions and therefore reduce the confusion, and still indicates that a significant fraction (%; Stelzer et al. 2006) of Herbig Ae star with unknown companions are X-ray sources. As shown by Stelzer et al. (2006), the HAe stars have X-ray properties (, ) very similar to lower mass young stars; therefore they conclude that either their emission and, likely, X-ray production mechanisms are very similar to TTS (i.e., coronal), or their X-ray emission comes from yet to be discovered companions. A few exceptions exist: HD 163296 has been observed with Chandra and shows an unusually soft spectrum, that Swartz et al. (2005) tentatively attribute to accretion shocks as in some CTTS; analogously AB Aur shows a very soft spectrum (Telleschi et al., 2007).
The spectroscopic companion to HD 104237-A is a later spectral type star (similar to SU Aur) and similar stars are known to be strong X-ray emitters (see e.g., Getman et al. 2005, and Güdel et al. 2007). Therefore the K3 companion is expected to contribute significantly to the overall X-ray emission. We explore the companion hypothesis assuming that the X-ray emission is entirely due to the K-type companion to HD 104237-A, and comparing its properties with the X-ray properties of stars of similar mass and evolutionary stage. The Chandra Orion Ultradeep Project (COUP; Getman et al. 2005) provides information for putting the X-ray emission properties of the HD 104237 members into context. In Figure 13 we compare some spectral properties of the HD 104237 members with the large sample from COUP (Preibisch et al., 2005). In particular Preibisch et al. (2005) analyzed the Chandra-acis spectra of the COUP sources with a two-temperature model and studied how the best fit temperatures change with spectral type. We superimpose on the results from COUP our temperature values from the modeling of the zero-order spectra, assuming a spectral type K3 for HD 104237-A (Figure 13, left panel). We analyze in the same context also the results found for source D and E, which have well determined spectral types.
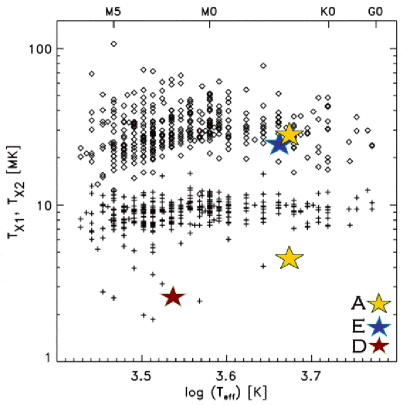
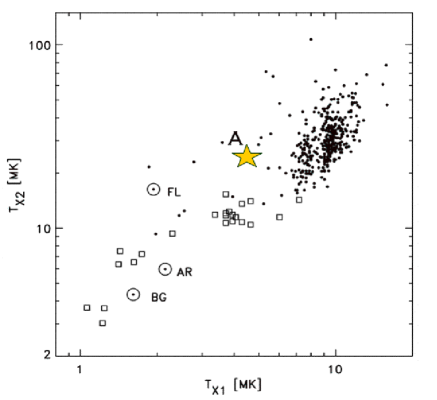
The plots of Figure 13 show that the hotter of the two temperatures fitting the spectrum of source A compares well with the high temperature component found for early K-type stars in the young star forming region of Orion, and also with the temperature of source E which has same spectral type as the spectroscopic binary companion to A. On the other hand, the soft component seems significantly cooler than the soft component of these similar stars. This soft component is reminiscent of the soft spectra found for the two Herbig Ae stars, HD 163296 and AB Aur (Swartz et al., 2005; Telleschi et al., 2007). These recent findings might lend support to the idea that characteristic soft X-ray emission could be a defining property of X-ray spectra of HAe stars. The persistent hot component, however, cannot be explained by either the wind models or magnetic infall scenario proposed for the CTTS, and therefore the detection of the hot component suggests the presence of magnetically confined plasma. This hot emission is likely produced, at least partially, by the later type companion; on the other hand the X-ray emission mechanisms – emission from magnetically confined coronal plasmas, or from accretion streams, or from magnetically confined winds – may not be mutually exclusive and may all contribute to the X-ray emission in some HAe systems. Possible generation of magnetic fields in HD 104237-A cannot be easily explained with existing models. The estimated position in the HR diagram and evolutionary tracks imply that HD 104237-A is already completely radiative and therefore it should not be able to produce any magnetic field by solar-like dynamo mechanism. In the alternative shear magnetic model by Tout & Pringle (1995), X-ray luminosities at levels high enough to explain the observed of HAe stars can be produced for time scales of the order of 1 Myr, and then they are rapidly decreasing as , where depends on the stellar parameters. As calculated by Skinner et al. (2004) depending on the set of stellar parameters adopted in the ranges discussed in §2 this model underestimates the observed by a factor (for spectral type A4 ive and age Myr) to (for the more recently determined spectral type A7.5 ve-A8 ve and age 2-5 Myr).
HD 163296, AB Aur and HD 104237-A show similar level of X-ray emission with fractional luminosity / of about -5.5 (Swartz et al., 2005), -5.6 (Telleschi et al., 2007), and -5 (this work; / if we assume that the K3 companion is the X-ray source) respectively. Another similarity between HD 104237-A and AB Aur consists in their X-ray variability: both sources are slowly varying within a factor , do not present any clear evidence of flaring activity, and their X-ray lightcurve is compatible with their respective rotational period as derived from periodicity of optical lines. The hetgs observations presented in this paper do not provide enough phase coverage to definitely determine the presence of X-ray modulation on the timescales of modulation of the H line, however, if the observed modulation is confirmed to be consistent with the rotation period of the HAe star, this would imply that a significant portion of the observed X-ray emission is produced by the HAe star. X-ray rotational modulation has been previously observed in a number of X-ray bright PMS stars, such as for instance by Flaccomio et al. (2005) who found evidence of X-ray emission being modulated by rotation in at least 10% of the Orion PMS stars sample observed in the COUP campaign; these findings are also compatible with theoretical modeling of TTS coronae from extrapolations of surface magnetograms derived from Zeeman-Doppler imaging (Gregory et al., 2006).
The high resolution hetgs spectra offer additional spectral diagnostics providing clues to the yet unestablished X-ray production mechanisms in young intermediate mass stars. Particularly useful diagnostics are provided by the He-like triplets: specifically the Ne ix and Mg xi triplets, since the O vii triplet is essentially undetected, and the Si xiii lines are at the low density limit (therefore providing only an upper limit to density of a few cm-3). Both Ne and Mg He-like triplets line ratios indicate plasma densities somewhat larger than typically observed in stellar coronae at the same level of activity, though the limited statistics do not provide very stringent constraints to these findings. In the scenario tentatively drawn above, with the Herbig Ae star being the main contributor to the cool ( K) emission and the K3 companion producing most of the hard emission, these triplets lines would be produced mainly by the Herbig Ae star. Considering the presence of significant ongoing accretion (at an estimated rate of yr-1), in analogy with TW Hya and other accreting T Tauri stars showing high density in their high resolution spectra (e.g., Kastner et al. 2002; Stelzer & Schmitt 2004; Schmitt et al. 2005; Günther et al. 2006; Argiroffi et al. 2007), the high densities observed for HD 104237-A can be interpreted as a signature of X-ray production in accretion shocks. The high resolution spectra also provide line profile diagnostics potentially able to determine the contribution to the X-ray emission of each component of a binary system (see e.g., Ishibashi et al. 2006). We find that the measured line centroids for the strongest lines (see §4.3.3) indicate that the Herbig Ae star is more likely, with respect to the K3 companion, to be the primary X-ray source. However, in our case the involved velocities are small, and the statistics limited, therefore not providing conclusive results. As discussed in §4.3.3 no convincing evidence of line broadening is found in the strong X-ray lines.
Among the other sources in the association, source D shows interesting characteristics: as clear from Figure 13 (left panel), source D is characterized by an unusually cool plasma temperature with respect to the bulk of similar M-type young stars in Orion. Even though no clear evidence of ongoing accretion is available for this star, its emission is near the CTTS limit indicating that this star might still be actively accreting from its circumstellar disk; in this scenario, the soft excess might indicate that X-rays produced by shocked accreting plasma dominate the X-ray emission of this star, analogously to the peculiar case of TW Hydrae (Kastner et al., 2002), and differently from the majority of TTS where the coronal component generally dominates the overall X-ray emission (e.g., Preibisch et al. 2005).
6 Conclusions
We have analyzed Chandra-hetg observations of young low-mass and intermediate-mass stars in the small stellar group associated with the Herbig Ae star HD 104237 to investigate the X-ray emission mechanisms in their pre-main sequence phase. The close ( AU) binary system of the HAe star and its K-type companion cannot be resolved in X-rays, however our findings with respect to the X-ray variability and spectral properties provide clues to the origin of the X-ray emission and the X-ray production mechanisms. The modulation on time scales of the estimated rotation period of the HAe star suggests that the primary contributes significantly to the observed X-ray emission. The spectral analysis reveals a strong soft component ( keV) significantly cooler than typically found in K-type stars of evolutionary stage similar to that of the HD 104237-A companion ( keV). We interpret these findings in a possible scenario where the soft X-rays are produced mainly by the HAe star and the hard emission by the later-type companion. The analysis of the hetgs spectrum provides additional diagnostics, in particular through the He-like triplets: the line ratios of the Mg xi and Ne ix triplets suggest the presence of plasma at high densities of about cm-3, possibly indicating accretion related X-ray production mechanism.
The observed X-ray emission of the other sources is typical of pre-main sequence stars of similar ages and spectral types, except for the M-type T Tauri star HD 104237-D for which we find evidence of remarkably soft emission, with temperature of 3 MK reminiscent of the X-ray emission of the classical T Tauri star TW Hya whose emission is attributed to shocks in the accreting plasma.
References
- Acke et al. (2005) Acke, B., van den Ancker, M. E., & Dullemond, C. P. 2005, A&A, 436, 209
- Acke & Waelkens (2004) Acke, B., & Waelkens, C. 2004, A&A, 427, 1009
- Alcala et al. (1995) Alcala, J. M., Krautter, J., Schmitt, J. H. M. M., Covino, E., Wichmann, R., & Mundt, R. 1995, A&AS, 114, 109
- Anders & Grevesse (1989) Anders, E., & Grevesse, N. 1989, Geochim. Cosmochim. Acta, 53, 197
- Appenzeller (1994) Appenzeller, I. 1994, in Astronomical Society of the Pacific Conference Series, Vol. 62, The Nature and Evolutionary Status of Herbig Ae/Be Stars, ed. P. S. The, M. R. Perez, & E. P. J. van den Heuvel, 12–+
- Argiroffi et al. (2007) Argiroffi, C., Maggio, A., & Peres, G. 2007, A&A, 465, L5
- Argiroffi et al. (2005) Argiroffi, C., Maggio, A., Peres, G., Stelzer, B. & Neuhäuser, R. 2007, A&A, 439, 1149
- Babel & Montmerle (1997) Babel, J., & Montmerle, T. 1997, A&A, 323, 121
- Bernasconi & Maeder (1996) Bernasconi, P. A., & Maeder, A. 1996, A&A, 307, 829
- Blondel & Djie (2006) Blondel, P. F. C., & Djie, H. R. E. T. A. 2006, A&A, 456, 1045
- Böhm et al. (2004) Böhm, T., Catala, C., Balona, L., & Carter, B. 2004, A&A, 427, 907
- Böhm et al. (2006) Böhm, T., Dupret., M. A., & Aynedjian, H. 2006, Memorie della Societa Astronomica Italiana, 77, 362
- Canizares et al. (2005) Canizares, C. R., Davis, J. E., Dewey, D., Flanagan, K. A., Galton, E. B., Huenemoerder, D. P., Ishibashi, K., Markert, T. H., Marshall, H. L., McGuirk, M., Schattenburg, M. L., Schulz, N. S., Smith, H. I., & Wise, M. 2005, PASP, 117, 1144
- Catala et al. (2007) Catala, C., Alecian, E., Donati, J.-F., Wade, G. A., Landstreet, J. D., Böhm, T., Bouret, J.-C., Bagnulo, S., Folsom, C., & Silvester, J. 2007, A&A, 462, 293
- Damiani et al. (1994) Damiani, F., Micela, G., Sciortino, S., & Harnden, Jr., F. R. 1994, ApJ, 436, 807
- D’Antona & Mazzitelli (1994) D’Antona, F., & Mazzitelli, I. 1994, ApJS, 90, 467
- Davis (2001) Davis, J. E. 2001, ApJ, 562, 575
- Donati et al. (1997) Donati, J.-F., Semel, M., Carter, B. D., Rees, D. E., & Collier Cameron, A. 1997, MNRAS, 291, 658
- Drake et al. (2005) Drake, J. J., Testa, P., & Hartmann, L. 2005, ApJ, 627, L149
- Feigelson et al. (2003) Feigelson, E. D., Lawson, W. A., & Garmire, G. P. 2003, ApJ, 599, 1207
- Flaccomio et al. (2005) Flaccomio, E., Micela, G., Sciortino, S., Feigelson, E. D., Herbst, W., Favata, F., Harnden, Jr., F. R., & Vrtilek, S. D. 2005, ApJS, 160, 450
- Fruscione et al. (2006) Fruscione, A., McDowell, J. C., Allen, G. E., Brickhouse, N. S., Burke, D. J., Davis, J. E., Durham, N., Elvis, M., Galle, E. C., Harris, D. E., Huenemoerder, D. P., Houck, J. C., Ishibashi, B., Karovska, M., Nicastro, F., Noble, M. S., Nowak, M. A., Primini, F. A., Siemiginowska, A., Smith, R. K., & Wise, M. 2006, in Presented at the Society of Photo-Optical Instrumentation Engineers (SPIE) Conference, Vol. 6270, Observatory Operations: Strategies, Processes, and Systems. Edited by Silva, David R.; Doxsey, Rodger E.. Proceedings of the SPIE, Volume 6270, pp. 62701V (2006).
- Gabriel & Jordan (1969) Gabriel, A. H., & Jordan, C. 1969, MNRAS, 145, 241
- Garcia Lopez et al. (2006) Garcia Lopez, R., Natta, A., Testi, L., & Habart, E. 2006, A&A, 459, 837
- Getman et al. (2005) Getman, K. V., Flaccomio, E., Broos, P. S., Grosso, N., Tsujimoto, M., Townsley, L., Garmire, G. P., Kastner, J., Li, J., Harnden, Jr., F. R., Wolk, S., Murray, S. S., Lada, C. J., Muench, A. A., McCaughrean, M. J., Meeus, G., Damiani, F., Micela, G., Sciortino, S., Bally, J., Hillenbrand, L. A., Herbst, W., Preibisch, T., & Feigelson, E. D. 2005, ApJS, 160, 319
- Gorenstein (1975) Gorenstein, P. 1975, ApJ, 198, 95
- Grady et al. (1999) Grady, C. A., Woodgate, B., Bruhweiler, F. C., Boggess, A., Plait, P., Lindler, D. J., Clampin, M., & Kalas, P. 1999, ApJ, 523, L151
- Grady et al. (2004) Grady, C. A., Woodgate, B., Torres, C. A. O., Henning, T., Apai, D., Rodmann, J., Wang, H., Stecklum, B., Linz, H., Williger, G. M., Brown, A., Wilkinson, E., Harper, G. M., Herczeg, G. J., Danks, A., Vieira, G. L., Malumuth, E., Collins, N. R., & Hill, R. S. 2004, ApJ, 608, 809
- Grady et al. (2007) Grady, C. A., Schneider, G., Hamaguchi, K., Sitko, M. L., Carpenter, W. J., Hines, D., Collins, K. A., Williger, G. M., Woodgate, B. E., Henning, T., Ménard, F., Wilner, D., Petre, R., Palunas, P., Quirrenbach, A., Nuth, III, J. A., Silverstone, M. D. & Kim, J. S. 2007, ApJ, 665, 1391
- Gregory et al. (2006) Gregory, S. G., Jardine, M., Cameron, A. C. & Donati, J.-F. 2006, MNRAS, 373, 827
- Grevesse & Sauval (1998) Grevesse, N., & Sauval, A. J. 1998, Space Science Reviews, 85, 161
- Güdel et al. (2007) Güdel, M., Briggs, K. R., Arzner, K., Audard, M., Bouvier, J., Feigelson, E. D., Franciosini, E., Glauser, A., Grosso, N., Micela, G., Monin, J.-L., Montmerle, T., Padgett, D. L., Palla, F., Pillitteri, I., Rebull, L., Scelsi, L., Silva, B., Skinner, S. L., Stelzer, B., & Telleschi, A. 2007, A&A, 468, 353
- Guimarães et al. (2006) Guimarães, M. M., Alencar, S. H. P., Corradi, W. J. B., & Vieira, S. L. A. 2006, A&A, 457, 581
- Günther et al. (2006) Günther, H. M., Liefke, C., Schmitt, J. H. M. M., Robrade, J., & Ness, J.-U. 2006, A&A, 459, L29
- Hamaguchi et al. (2005) Hamaguchi, K., Yamauchi, S., & Koyama, K. 2005, ApJ, 618, 360
- Herbig (1960) Herbig, G. H. 1960, ApJS, 4, 337
- Houck & Denicola (2000) Houck, J. C., & Denicola, L. A. 2000, in ASP Conf. Ser. 216: Astronomical Data Analysis Software and Systems IX, Vol. 9, 591
- Hu et al. (1991) Hu, J. Y., Blondel, P. F. C., The, P. S., Tjin A Djie, H. R. E., de Winter, D., Catala, C., & Talavera, A. 1991, A&A, 248, 150
- Hu et al. (1989) Hu, J. Y., The, P. S., & de Winter, D. 1989, A&A, 208, 213
- Hubrig et al. (2007) Hubrig, S., Pogodin, M. A., Yudin, R. V., Schöller, M., & Schnerr, R. S. 2007, A&A, 463, 1039
- Hubrig et al. (2004) Hubrig, S., Schöller, M., & Yudin, R. V. 2004, A&A, 428, L1
- Huenemoerder et al. (2007) Huenemoerder, D. P., Kastner, J. H., Testa, P., Schulz, N. S., & Weintraub, D. A. 2007, ApJ, 671, 000
- Huenemoerder et al. (2006) Huenemoerder, D. P., Testa, P., & Buzasi, D. L. 2006, ApJ, 650, 1119
- Ishibashi et al. (2006) Ishibashi, K., Dewey, D., Huenemoerder, D. P., & Testa, P. 2006, ApJ, 644, L117
- Kastner et al. (2002) Kastner, J. H., Huenemoerder, D. P., Schulz, N. S., Canizares, C. R., & Weintraub, D. A. 2002, ApJ, 567, 434
- Larson (1972) Larson, R. B. 1972, MNRAS, 157, 121
- Luhman (2004) Luhman, K. L. 2004, ApJ, 616, 1033
- Maggio et al. (2007) Maggio, A., Flaccomio, E., Favata, F., Micela, G., Sciortino, S., Feigelson, E. D. & Getman, K. V. 2007, ApJ, 660, 1462
- Malfait et al. (1998) Malfait, K., Bogaert, E., & Waelkens, C. 1998, A&A, 331, 211
- Mannings & Sargent (1997) Mannings, V., & Sargent, A. I. 1997, ApJ, 490, 792
- Muzerolle et al. (2004) Muzerolle, J., D’Alessio, P., Calvet, N., & Hartmann, L. 2004, ApJ, 617, 406
- Ness et al. (2004) Ness, J.-U., Güdel, M., Schmitt, J. H. M. M., Audard, M., & Telleschi, A. 2004, A&A, 427, 667
- Palla & Stahler (1993) Palla, F., & Stahler, S. W. 1993, ApJ, 418, 414
- Perryman et al. (1997) Perryman, M. A. C., Lindegren, L., Kovalevsky, J., Hoeg, E., Bastian, U., Bernacca, P. L., Crézé, M., Donati, F., Grenon, M., van Leeuwen, F., van der Marel, H., Mignard, F., Murray, C. A., Le Poole, R. S., Schrijver, H., Turon, C., Arenou, F., Froeschlé, M., & Petersen, C. S. 1997, A&A, 323, L49
- Preibisch et al. (2005) Preibisch, T., Kim, Y.-C., Favata, F., Feigelson, E. D., Flaccomio, E., Getman, K., Micela, G., Sciortino, S., Stassun, K., Stelzer, B., & Zinnecker, H. 2005, ApJS, 160, 401
- Sanz-Forcada et al. (2003) Sanz-Forcada, J., Brickhouse, N. S., & Dupree, A. K. 2003, ApJS, 145, 147
- Schmitt et al. (2005) Schmitt, J. H. M. M., Robrade, J., Ness, J.-U., Favata, F., & Stelzer, B. 2005, A&A, 432, L35
- Skinner et al. (2004) Skinner, S. L., Güdel, M., Audard, M., & Smith, K. 2004, ApJ, 614, 221
- Skinner & Yamauchi (1996) Skinner, S. L., & Yamauchi, S. 1996, ApJ, 471, 987
- Smith et al. (2001) Smith, R. K., Brickhouse, N. S., Liedahl, D. A., & Raymond, J. C. 2001, ApJ, 556, L91
- Stelzer et al. (2006) Stelzer, B., Micela, G., Hamaguchi, K., & Schmitt, J. H. M. M. 2006, A&A, 457, 223
- Stelzer & Schmitt (2004) Stelzer, B., & Schmitt, J. H. M. M. 2004, A&A, 418, 687
- Swartz et al. (2005) Swartz, D. A., Drake, J. J., Elsner, R. F., Ghosh, K. K., Grady, C. A., Wassell, E., Woodgate, B. E., & Kimble, R. A. 2005, ApJ, 628, 811
- Tatulli et al. (2007) Tatulli, E., Isella, A., Natta, A., Testi, L., Marconi, A., Malbet, F., Stee, P., Petrov, R. G., & et al. 2007, A&A, 464, 55
- Telleschi et al. (2007) Telleschi, A., Güdel, M., Briggs, K. R., Skinner, S. L., Audard, M., & Franciosini, E. 2007, A&A, 468, 541
- Telleschi et al. (2005) Telleschi, A., Güdel, M., Briggs, K. R., Audard, M., Ness, J. U., & Skinner, S. L. 2005, ApJ, 622, 653
- Testa et al. (2004) Testa, P., Drake, J., & Peres, G. 2004, ApJ, 617, 508
- Tout & Pringle (1995) Tout, C. A., & Pringle, J. E. 1995, MNRAS, 272, 528
- van den Ancker et al. (1998) van den Ancker, M. E., de Winter, D., & Tjin A Djie, H. R. E. 1998, A&A, 330, 145
- Wade et al. (2007) Wade, G. A., Bagnulo, S., Drouin, D., Landstreet, J. D., & Monin, D. 2007, MNRAS, 376, 1145
- Wade et al. (2005) Wade, G. A., Drouin, D., Bagnulo, S., Landstreet, J. D., Mason, E., Silvester, J., Alecian, E., Böhm, T., Bouret, J.-C., Catala, C., & Donati, J.-F. 2005, A&A, 442, L31
- Walker & Wolstencroft (1988) Walker, H. J., & Wolstencroft, R. D. 1988, PASP, 100, 1509
- Waters & Waelkens (1998) Waters, L. B. F. M., & Waelkens, C. 1998, ARA&A, 36, 233
- Zinnecker & Preibisch (1994) Zinnecker, H., & Preibisch, T. 1994, A&A, 292, 152