Imaging the dense stellar cluster R136 with VLT-MAD
Abstract
We evaluate the performance of the Multi-conjugate Adaptive optics Demonstrator (MAD) from H and Ks imaging of 30 Doradus in the Large Magellanic Cloud. Maps of the full-width half maximum (FWHM) of point sources in the H and Ks images are presented, together with maps of the Strehl ratio achieved in the Ks-band observations. Each of the three natural guide stars was at the edge of the MAD field-of-view, and the observations were obtained at relatively large airmass (1.4-1.6). Even so, the Strehl ratio achieved in the second pointing (best-placed compared to the reference stars) ranged from 15% to an impressive 30%. Preliminary photometric calibration of the first pointing indicates 5 sensitivities of Ks21.75 and H22.25 (from 22 and 12 min exposures, respectively).
keywords:
instrumentation: adaptive optics – techniques: high angular resolution – techniques: photometric – stars: mass function – Magellanic Clouds1 INTRODUCTION
Correction of atmospheric turbulence with adaptive optics (AO) is an increasingly important method to improve the performance of large telescopes. AO-corrected instruments such as NAOS-CONICA[1] now routinely deliver excellent image quality in the near-infrared when compared to natural seeing. However, sky coverage has been limited by the requirement for a bright natural guide star (NGS) with which to monitor atmospheric variations. The introduction of laser guide stars (LGS) at each of the major 8-m class observatories has opened-up the night sky for AO-assisted imaging and spectroscopy, but the field-of-view (FoV) over which the point spread function (PSF) can be improved remains limited to 10-20′′, except in very favourable conditions. The concept of multi-conjugate adaptive optics (MCAO) overcomes this limitation, delivering a larger corrected FoV via tomographic reconstruction of multiple turbulent layers using multiple (natural or artificial) guide stars[2].
As part of the technology development plan towards the European Extremely Large Telescope (E-ELT), the Multi-conjugate Adaptive optics Demonstrator (MAD)[3, 4, 5] was developed by the European Southern Observatory (ESO) as a visiting instrument for the Very Large Telescope (VLT) in Chile. Three Shack-Hartmann wavefront sensors are used to observe three NGS across a 2′ circular field, thereby allowing mapping of the turbulence. The turbulence is then corrected using two deformable mirrors (operating at 400 Hz), one conjugated to the ground-layer (i.e. 0 km), the second conjugated to 8.5 km above the telescope.
The high-resolution, near-IR camera used with MAD is the CAmera for Multi Conjugate Adaptive Optics (CAMCAO), designed and built by a consortium led by the University of Lisbon [6, 7]. CAMCAO operates over the J, H, and Ks bands, with critical (2 pixel) sampling of the diffraction-limited PSF at 2.2m. The detector is a HAWAII2 2k2k HgCdTe array, with a pixel scale of 0.028′′/pixel, giving a FoV of 57′′x57′′. A useful feature is that the camera can be moved within the 2′ field without requiring positional offsets of the telescope, meaning that the AO loop can remain closed.
MAD was installed at the Nasmyth visitor focus of UT3 Melipal in early 2007 for technical evaluation. The performance of the instrument was impressive[5], with the observations from the first run already beginning to yield science results[8, 9]. Here we present preliminary analysis of MAD H- and Ks-band imaging of the central region of 30 Doradus, the most massive star-formation region in the Large Magellanic Cloud (LMC).
2 SCIENTIFIC BACKGROUND
30 Doradus is one of the largest star-forming regions in the Local Group. At its core is the dense star cluster R136, with stellar ages in the range of 2-4 Myr and a total stellar mass of 5x , putting it on a par with massive clusters found in starburst and interacting galaxies such as M51, M82 and the Antennae. As a proto-typical ‘starburst’, significant observational effort has been directed toward the region over the past 20 years. 30 Dor provides an excellent laboratory to study star formation, and also offers insight into the nature of distant super-star-clusters and starburst galaxies, for which we only have integrated properties – if we can understand large clusters on our doorstep, we can be more confident of accurate interpretation of those far away.
However, the formation of large clusters remains poorly understood. In a relatively short period of time (a few Myrs) a complicated mixture of various physical processes take place that transform a giant molecular cloud (GMC) into a star cluster. In the competitive accretion model of star formation[10], massive stars form in the centre of the gravitational well of the GMC. This model successfully explains observations that show massive stars to be more concentrated in young clusters such as in the Orion Nebula[11], yet the situation is complicated by the fact that massive stars will also tend to move toward the cluster centre over their lifetimes due to dynamical interactions, i.e. mass segregation.
To date, ground-based optical imaging and spectroscopy has been used in 30 Dor to study the initial mass function (IMF), reddening, star-formation history, stellar content and kinematics[12, 13, 14, 15, 16]. However, only with near-IR imaging are we able to disentangle multiple objects, and to identify nascent stars that are still partially embedded in their gas clouds. Indeed, HST-NICMOS observations of some of the complex nebular structures in 30 Dor have provided evidence of triggered star-formation, showing the region to be a two-stage starburst [17, 18]. The core of R136 is too dense for traditional (seeing-limited) ground-based techniques, with a core radius of only 13[19]. Only with the arrival of HST was R136 resolved in optical and UV images [20, 21, 22], with follow-up spectroscopy revealing a hitherto unprecedented concentration of the earliest O-type stars [23]. The conclusion of these studies was that the high- and intermediate-mass IMF is ‘completely normal’, i.e. Salpeter-like [23]. This contrasts with results from AO-corrected, near-IR images from the ESO 3.6-m that, when combined with the HST data, found evidence of mass-segregation via a flattening of the IMF in the core [24]. Unfortunately, by virtue of using such novel technology, the 3.6-m images were limited to a relatively small field-of-view, with the core of R136 in one quadrant of a 128 x 128 field.
The offer to the community of Science Demonstration (SD) observations with MAD presented the perfect opportunity to revisit these conflicting results, while also providing further tests of its capabilities. There is NICMOS H-band imaging of R136 [25], but the spatial resolution is lower and the field-of-view is smaller than that provided by MAD. Our primary objective with the new MAD observations is to probe the intermediate-mass IMF of R136 at unparalleled spatial resolution. For instance, do we see evidence for a flattening of the intermediate-mass IMF with radius?
Secondly, from direct star counts the luminosity profile of R136 appears to be best described by two components[19], with a break at 10′′. There is significant extinction at this radius in the cluster so, by penetrating the gas and dust more successfully than in the optical, we should be able to provide empirical constraints on the outer component of the luminosity profile, investigating the so-called ‘excess light’ that is predicted to originate from rapid gas removal in the early stages of cluster evolution[26]. Determining if R136 is an expanding group or a dynamically-stable star cluster will serve as an important ingredient in the recent debate on the importance of ‘infant mortality’ of young clusters [27, 28].
3 OBSERVATIONS & DATA REDUCTION
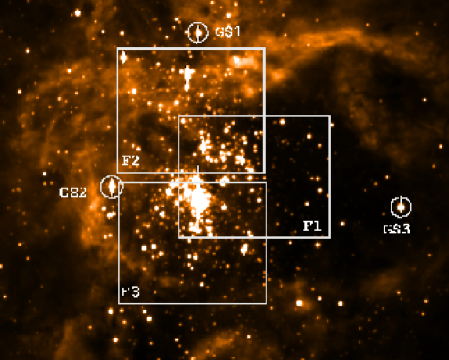
The data presented here were obtained from one of twelve SD programmes, observed in November 2007 and January 2008. H- and Ks-band images were obtained of three pointings in the central region of 30 Dor, as shown in Figure 2. The central co-ordinates for the CAMCAO observations of Field 1 were 05h38m46.5s, 69∘05′52′′ (J2000.0). Fields 2 and 3 were offset from this first pointing by 25′′ in right ascension and 25′′ in declination. The three NGS used for wavefront sensing are also shown in Figure 2 – these are Parker #952 (GS1), #499 (GS2), and #1788 (GS3), with V = 12.0, 11.9, and 12.0, respectively[13]. Closer NGS with a more even spread over the three pointings would have been preferable, but these were the only three stars available that were both uncrowded and suitably bright in the band. A positive side-effect of this is that, for the three observed fields, the wider separation allows tests of the MCAO performance for a variety of distances/orientations to the NGS.
The observations are summarised in Table 1. The detector integration time (DIT) for all of the observations was 2 s, with 30 integrations (NDIT) for each exposure. ‘Batches’ of three (H) and six (Ks) object and sky frames were interleaved in an A-B-A-B-A-B-A pattern, yielding total exposures of 12 min for each field in the H band, and 24 min in Ks. The science exposures within each batch were each dithered by 5′′ – although this reduces the effective area of the final combined images, it was intended to minimise the impact of bad pixels and cosmetic features from array. Given the spatial extent of 30 Dor, the sky offsets were somewhat large (12s of right ascension, 13′ in declination) to ensure they were uncontaminated by nebulosity. Observations were halted mid-way through the Ks exposures for Field 1 on 2008/01/07 due to bad weather, but were completed the following night. The airmass of the observations ranged from 1.4 to 1.6. Note that the LMC never rises above an altitude of approx. 45∘ as viewed from Paranal, i.e. the minimum zenith distance of the MAD observations was 45∘. The range of seeing values for each pointing, as measured by the Differential Image Motion Monitor (DIMM) at Paranal, are given in Table 1.
| Pointing | Band | Date | Total Exp. | DIMM range | Image FWHM | FWHM |
|---|---|---|---|---|---|---|
| [min] | [′′] | [′′] | [′′] | |||
| Field 1 | Ks | 2008/01/07 & 08 | 22 | 0.4-1.8 | 0.10-0.13 | 0.11 |
| Field 2 | Ks | 2008/01/07 | 24 | 0.5-1.1 | 0.08-0.10 | 0.09 |
| Field 3 | Ks | 2007/11/27 | 23 | 0.6-1.0 | 0.10-0.20 | 0.14 |
| Field 1 | H | 2008/01/08 | 12 | 0.3-0.6 | 0.10-0.12 | 0.11 |
| Field 2 | H | 2008/01/08 | 12 | 0.9-1.1 | 0.08-0.11 | 0.09 |
| Field 3 | H | 2008/01/08 | 11 | 0.6-1.6 | 0.08-0.15 | 0.12 |

The MAD data were reduced with standard iraf routines, using calibration frames from the SD runs to correct for the dark current and to flat-field all of the object and sky exposures. Median sky frames were created for each batch of science observations using the sky frames observed immediately before and/or after, although (in general) the sky background did not appear to vary strongly over each sequence of observations. The sky-subtracted frames were then aligned with each other and combined. At this stage we omitted the worst one or two images in some pointings, hence the exposure times in Table 1 differ slightly to the numbers mentioned previously.
Although it proved impossible to remove some of detector artefacts in the final images (experiments with different -clips led to unpleasant effects on genuine sources!), these are relatively low-level features and the final images are truly impressive. The combined, sky-subtracted Ks-band image for Field 3 is shown in Figure 2, highlighting the extreme density of stars in the cluster. In Figure 3 we compare the H-band image of the core of R136 (from Field 3), with a HST-WFPC2 optical image[23] (left-hand image in the montage) and with a F160W (i.e. H band) HST-NICMOS image[25, 29]. Note that the spatial performance achieved in the MAD image is comparable to the optical performance of HST, with improved spatial performance compared to the near-IR HST image. Also, the MAD image does not suffer the diffraction effects seen in the NICMOS image, making fainter companions easier to identify.

4 PRELIMINARY ANALYSIS
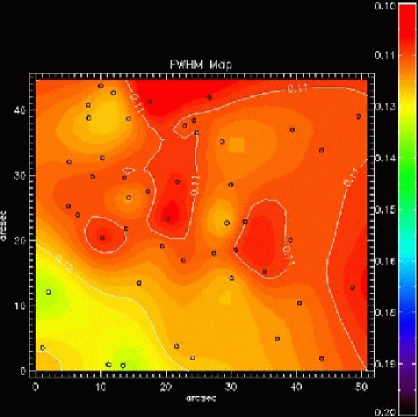
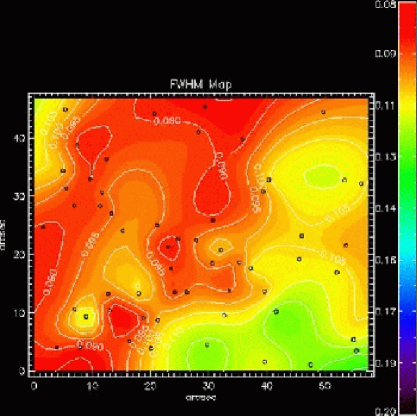
To investigate the instrument performance in our three pointings we first measured the full-width half maximum (FWHM) of 32 stars, uniformly distributed across each co-added image. Using stars that appear to be single objects (that were not saturated and relatively uncrowded) the position, ellipticity and FWHM were measured, as well as visual inspection of the radial profiles and contour maps. These results are summarised in Table 1. Residual ellipiticity/PSF asymmetries are often seen to arise from partial correction of turbulence[30]. Although there is some variability in the ellipticity results from object-to-object in the MAD frames, there appears to be no obvious correlation between the ellipticity of a star and its proximity to the NGS position, nor the axis of asymmetry and its position in the field.
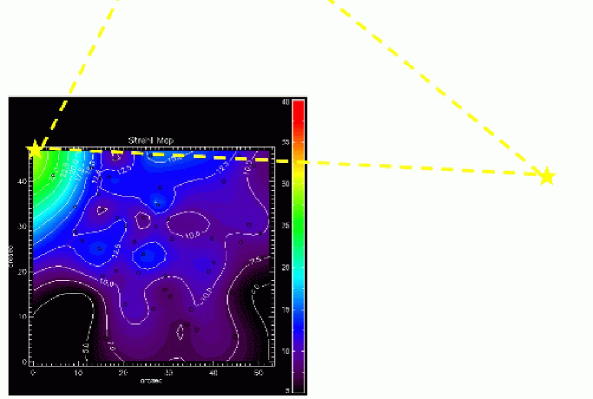
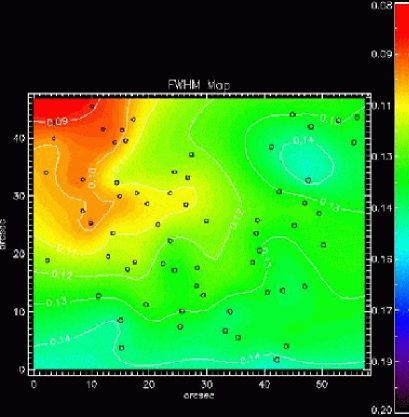
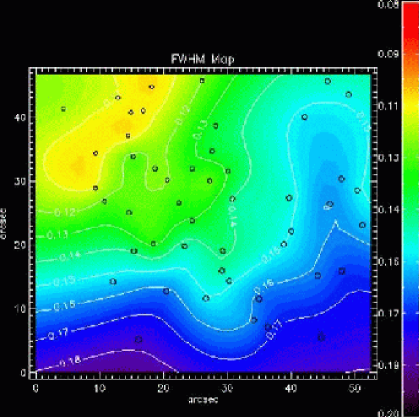
A set of IDL routines was used to create maps of the FWHM across each field, and maps of the Strehl ratio in the Ks-band images – note that it is not possible to create similar maps for the H-band images due to the undersampling of the detector. The Strehl map for the Ks-band image of Field 1 is shown in Figure 5 (including the relative positions of the NGS), with the FHWM maps for both H and Ks shown in Figure 5. Similar maps are shown in Figures 7 and 7 for Field 2, and in Figures 9 and 9 for Field 3.
The best Strehl ratio achieved in Fields 2 and 3 was 25-30%, in the regions closest to the NGS (as one would expect). The performance in Field 2 is particularly good, with an average FWHM of 0.09′′ in both the H and Ks images (compared to diffraction limits [/D] of approx 0.04′′ and 0.06′′, respectively). Although the Strehl is lower in Field 1, this was in the best position with respect to all three NGS – note the uniformity across the 50′′x50′′ field (Figure 5). This is in strong contrast to Field 3 (Figure 9), in which the performance is very good in one corner, but then steeply declines away from the NGS – more in keeping with ‘classical’ AO observations. In general, the performances are comparable with those found from the first round of MAD observations[5, 8]. The Strehl achieved in Field 2 is comparable to that obtained in observations of the Trapezium cluster from the first MAD observations[8]. These were also observed at relatively large airmass (1.4 to 1.7), but had the advantage of two NGS within the CAMCAO field, with the third just outside it.
Photometric analysis and calibration of the 30 Dor data is now underway. Given the large density of stars in the images we are using PSF-fitting methods in daophot – the observed PSFs are slightly variable across the field so the model PSF is also allowed to vary. For a first estimate of sensitivities we have used the Two Two Micron All Sky Survey (2MASS) catalogue to calibrate the images of Field 1. In such a dense region there are a limited number of well-resolved 2MASS targets, with 14 in the H band with quality ratings of A, B or C, and 10 in the Ks image (which has a smaller effective area owing to a larger number of dithers). The zero points were ZPK = 26.300.35 and ZPH = 26.890.30. Assuming, for now, that the MAD filters match those of 2MASS, only zero point corrections have been applied to the observed magnitudes – this gives 5- sensitivity estimates of Ks 21.75 and H 22.25. Work is now proceeding on photometric calibrations using published photometry from higher-resolution imaging than 2MASS.


5 SUMMARY
The observations presented here provide a further demonstration of the excellent performance of VLT-MAD. The image quality (as measured by the FWHM of the PSF) across Fields 1 and 2 was uniform to within 003. Such stability across ‘wide’ fields (compared to classical AO observations) is very encouraging in advance of future multi-laser, MCAO systems on 8-m class telescopes, and the developement of ‘wide-field’, AO-corrected, imagers and spectrometers for the E-ELT.
MAD has also provided us with a truly unique view of the stellar populations in 30 Doradus, in terms of both spatial resolution and spatial coverage compared to previous studies. Work is now underway on the photometric calibrations and the resulting catalogue will be used to investigate the IMF and star-formation history of this important cluster.
Acknowledgements.
We are grateful to the ESO staff, in particular to Paola Amico at Paranal and Enrico Marchetti in Garching, for their advice and suggestions. We thank Morten Andersen for his NICMOS image in advance of publication, also Nate Bastian, Bernhard Brandl, Jacco van Loon and Hans Zinnecker for useful input and discussion.References
- [1] Rousset, G. et al. SPIE, 4839, 140 (2003).
- [2] Raggazoni, R. et al. Nature, 403, 54 (2000).
- [3] Marchetti, E. et al. SPIE, 4839, 317 (2003).
- [4] Marchetti, E. et al. SPIE, 5490, 236 (2004).
- [5] Marchetti, E. et al. The Messenger, 129, 8 (2007).
- [6] Amorim, A. et al. SPIE, 5492, 1699 (2004).
- [7] Amorim, A. et al. SPIE, 6269, 164 (2006).
- [8] Bouy, H. et al. A&A, 477, 681 (2008).
- [9] Gullieuszik, M. et al. A&A, 483, L5 (2008).
- [10] Bonnell, I. A. & Bate, M. R. MNRAS, 370, 488 (2006).
- [11] Hillenbrand, L. A. & Hartmann, L. W. ApJ, 492, 540 (1998).
- [12] Melnick, J. A&A, 153, 235 (1985).
- [13] Parker, J. W. AJ, 106, 560 (1993).
- [14] Bosch, G. et al. A&A, 380, 137 (2001).
- [15] Parker J. W. & Garmany, C. D. AJ, 106, 1471 (1993).
- [16] Selman, F. A&A, 341, 98 (1998).
- [17] Walborn, N. R. et al. AJ 117, 225 (1999).
- [18] Walborn, N. R. et al. AJ 124, 1601 (2002).
- [19] Mackey, A. D. & Gilmore, G. F. MNRAS 338, 85 (2003).
- [20] Hunter, D. A. et al. ApJ 448, 179 (1995).
- [21] Hunter, D. A. et al. ApJ 113, 1691 (1997).
- [22] Sirianni, M. et al. ApJ 533, 203 (2000).
- [23] Massey, P. & Hunter, D. A. ApJ 493, 180 (1998).
- [24] Brandl, B. et al. ApJ 466, 254 (1996).
- [25] Andersen, M. PhD Thesis, Potsdam University (2004).
- [26] Bastian, N. & Goodwin, S. P. MNRAS 369, L9 (2006).
- [27] Chandar, R. et al. ApJ 650, L111 (2006).
- [28] Gieles, M. et al. ApJ 668, 268 (2007).
- [29] Andersen, M. et al. in press (2008).
- [30] Tokovinin, A. PASP 116, 941 (2004).