The Rate and Spatial Distribution of Novae in M101 (NGC 5457)
Abstract
A new multi-epoch H imaging study of M101 (NGC 5457) has been carried out as part of a larger campaign to study the rate and stellar population of extragalactic novae. The survey yielded a total of 13 nova detections from 10 epochs of M101 observations spanning a three year period. After correcting for the temporal coverage and survey completeness, a global nova rate of yr-1 is found. This value corresponds to a luminosity-specific nova rate of novae per year per when the luminosity is derived from the color, or novae per year per when the magnitude from the Two Micron All Sky Survey is used. These values are consistent with previous estimates by Shafter et al. that were based on more limited data. The spatial distribution of the combined nova sample from the present survey and from the earlier Shafter et al. survey shows that the specific frequency of novae closely follows the integrated background light of the galaxy.
1 Introduction
Novae occur in semi-detached binary systems in which a white dwarf (WD) primary accretes material from a Roche-lobe filling late-type companion (see Warner 1995 for a review). For sufficiently low mass accretion rates, the accreted matter builds up on the surface of the WD under degenerate conditions. When the Fermi temperature is reached at the base of the accreted layer, a thermonuclear runaway (TNR) ensues, blowing off the outer layers of the star, and resulting in an outburst of 10–20 magnitudes. In the resulting explosion, novae reach peak luminosities of up to , making them visible in external galaxies up to and beyond the Virgo cluster. The high luminosity, coupled with a well-known relationship between a nova’s maximum magnitude and its rate of decline, the MMRD relation (Zwicky 1936, Mclaughlin 1945, Downes & Duerbeck 2000), has enabled novae to be useful as an extragalactic distance indicator (e.g. Pritchet & van den Bergh 1987, Della Valle & Gilmozzi 2002). However, difficulties in calibrating the MMRD relationship, as well as uncertainties about the uniformity of the progenitor populations in different galaxy types have hindered the use of novae as reliable distance indicators (Ferrarese et al. 2003). Recent studies have focused mainly on the value of using novae to probe extragalactic stellar populations.
Galactic nova studies have suggested that there are actually two distinct classes of classical novae, a disk population and a bulge population (e.g., Duerbeck 1990, Della Valle et al. 1992; Della Valle & Livio 1998). As shown by Della Valle et al. (1992), “fast” novae111Fast novae can be loosley defined as those novae which decline at least two magnitudes within 12 days (i.e. days). tend to be associated with a disk population, having an average scale height above the Galactic plane generally less that that of slower novae. At about the same time Williams (1992) pointed out that novae could also be segregated into two classes based upon their spectroscopic characteristics. Novae whose spectra display prominent Fe II lines (the Fe II novae) tend to evolve more slowly, have lower expansion velocities, and have a lower level of ionization compared with novae that exhibit strong lines of He and N (the He/N novae). In addition, these He/N novae often display very strong neon lines, which suggests that the seat of the eruption is a relatively massive ONe white dwarf. Such novae do not appear to produce the copious carbon-rich dust that is often formed in nova ejecta arising from the lower mass CO white dwarfs (Gehrz et al. 1998). Additional support for the two-population scenario was provided by Della Valle & Livio (1998), who looked into the spatial distribution of a sample of 27 Galactic novae with known spectral class and reliable distance estimates. They noted that Galactic novae that could be classified as He/N were more concentrated to the Galactic plane, and tended to be faster and more luminous compared with their Fe II counterparts.
Despite the progress made in understanding nova populations with Galactic data, observations of novae in nearby galaxies offer several advantages over Galactic studies. For a given galaxy, the nova sample is essentially equidistant, with constant (and usually minimal) foreground reddening, making it easier to study relative nova luminosities and fade rates. For spatially-resolved spiral systems it is often possible to segregate novae from different spatial positions within a galaxy (e.g. between the bulges and disks of spirals), revealing possible differences between novae from differing stellar populations. Perhaps most importantly, extragalactic nova observations make it possible to study novae from isolated stellar populations directly by comparing their properties in galaxies along the Hubble sequence from ellipticals to irregulars.
A number of studies have looked at the question of whether the luminosity-specific nova rate (LSNR) of a galaxy varies with Hubble type. In these studies, the nova rate of a galaxy is normalized to its infrared luminosity (usually -band), which acts as a proxy for stellar mass. In the first such study, Ciardullo et al. (1990b) compiled a list of galaxies with measured nova rates and concluded that the LSNR was essentially independent of Hubble type. Shortly thereafter, Della Valle et al. (1994) re-analyzed much of the same data (using different estimates for completeness and for the normalization of the nova rate by galaxy luminosity) and came to a different conclusion. Namely, that the LSNRs of the late-type, low-mass galaxies in the local group (SMC, LMC, and M33) were significantly higher than those of the other, earlier-type galaxies, such as the Virgo ellipticals.
In an important paper, Yungelson et al. (1997) published the results of population synthesis models demonstrating that the LSNR in a galaxy should be strongly dependent on the galaxy’s star formation history. There are two reasons for this dependence. The first is that the mean mass of the accreting white dwarfs in newly-formed nova binaries declines with increasing time elapsed since the formation of the zero-age main sequence system (Tutukov & Yungelson 1995). Since the frequency of nova eruptions increases with increasing white dwarf mass (Ritter et al. 1991; Livio 1992), galaxies experiencing recent ( yr) star formation, such as late-type spirals, should be more prolific nova producers compared with galaxies that formed the bulk of their stars in a burst of star formation early in their history (i.e. ellipticals). Secondly, the color of a galaxy is dependent on its star formation history. The higher the recent star formation rate, the “bluer” the galaxy (Bruzual & Charlot 2003). Thus, for a given nova rate per unit mass, late-type galaxies will have a higher -band luminosity-specific nova rate when compared with early-type galaxies.
In addition to the dependence on Hubble type, Yungelson et al. (1997) pointed out that galaxy mass was a key factor affecting the LSNR. In particular, they pointed to work by Gavazzi & Scodeggio (1996) who have argued that giant late-type spiral galaxies () have an exponentially decaying star formation rate ( yr), while dwarf late-type galaxies () have a more nearly constant star formation rate characterized by yr. Thus low-mass spirals and irregular galaxies have had more active star formation in the recent past compared with the more massive spiral systems.
Overall, the models of Yungelson et al. (1997) seem to support the conclusions of Della Valle et al. (1994) who found the highest LSNRs in the low-mass, late-type galaxies such as the LMC, SMC and M33. The one galaxy type missing from the analysis were the massive, late-type spirals, for which no nova rates had yet been measured. In an attempt to remedy this deficiency, Shafter et al. (2000) undertook nova surveys in the massive late-type galaxies M51 and M101, with the giant elliptical M87 included for comparison as a massive early-type galaxy. Ultimately, the Shafter et al. (2000) study and a similar study targeting M33 by Williams & Shafter (2004) failed to confirm any significant correlation between LSNR and Hubble type.
In recent years, the results of the Shafter et al. (2000) have been called into question by the work of Shara and collaborators. In an analysis of archival HST images of M87, Shara & Zurek (2002) reported a (preliminary) nova rate significantly higher than that found by Shafter et al. in their ground-based study. This result prompted Neill & Shara (2004) to contemplate the possibility that many ground-based, multi-epoch nova surveys with sparse temporal coverage may have systematically underestimated nova rates because the correction for the effective survey times is often large and uncertain.
Given the importance of establishing reliable nova rates for galaxies spanning a wide range of Hubble types, and for the massive late-type spiral galaxies in particular, we have undertaken a new survey for novae in M101 using the 90Prime camera on the Bok 2.3-m reflector. As a relatively nearby ( [Freedman et al. 2001]), nearly face-on, late-type spiral, M101 provides an ideal candidate for studying the nova rate and the distribution of nova progenitor populations. This survey improves on the one conducted by Shafter et al. (2000) both by monitoring the galaxy more frequently, and by improving the corrections for spatial and temporal completeness. In this paper, we report the results of this new survey.
2 Observations & Data Reduction
Observations of M101 were obtained over 10 epochs from May 2005 to May 2007 using the Steward Observatory 2.3 m Bok Telescope. All observations were made with the 90Prime camera (Williams et al. 2004). The camera consists of an array of 4 4K 4K CCDs mounted at prime focus, yielding a field of view of 1 square degree (30 per chip). The large field of view of the 90Prime camera allowed us to cover nearly the full disk of M101 on a single chip.
Following our earlier work (Shafter et al. 2000), imaging was done through a narrow-band H filter with a central bandpass of 6580 Å and a FWHM of 80 Å. Conducting nova surveys in H offers several advantages over broad-band continuum observations. Shortly after eruption, novae develop strong, broad (1000 km s-1) H emission lines that typically require a month or more to decline by more than 2 mag (Ciardullo et al. 1990a), making observations in H ideal for surveys with limited temporal sampling. H radiation is also less affected by internal extinction than B light, which is important in dusty spiral galaxies such as M101. Thus, H observations allow novae to be identified even against a bright galactic background, particularly near the nucleus.
At the distance of M101, a total of hours of observations per epoch were required to detect a significant fraction of the nova eruptions. Individual exposures of typically 900 seconds were taken, typically on a single night, and later median-combined in order to suppress cosmic ray artifacts and avoid CCD saturation. Each epoch also contained a set of bias frames, dark frames, and sky flats for all 4 CCD chips that were used in the image reduction process. After de-biasing and flat-fielding the individual images, a world coordinate system (WCS) for each image was assigned using the MSCTPEAK routine in IRAF222IRAF (Image Reduction and Analysis Facility) is distributed by the National Optical Astronomy Observatories, which are operated by AURA, Inc., under cooperative agreement with the National Science Foundation using coordinates from the U.S. Naval Observatory A2 catalog. With coordinates accurately assigned, images from a given epoch were then aligned using several stars common to each image. In 3 epochs, M101 was centered on a single chip (chip 1) in all exposures. This allowed the images to be aligned using the IMALIGN routine in IRAF. The other 7 epochs followed a procedure of alternating the center of M101 between 3 chips (chip 3 was excluded due to a large area of bad pixels). In these cases it was necessary to align the images using SREGISTER due to the slight amount of rotation from one chip to the next. After alignment, the images were median-stacked to suppress transient features. The resulting master image represented between 2.6 and 4.5 hours of coverage per epoch. Table 1 contains a summary of the observations.
2.1 Nova Detections
To identify novae, two master combined images from epochs at least one year apart were aligned and then blinked by eye. Novae were identified by their variability. To qualify as a nova, an object had to appear in at least one epoch and be absent from previous and/or subsequent epochs (greater than 3-4 months before or after the date of the image in which the nova was first seen). This method enabled novae to be detected to within 3′ of the nucleus and yielded a total of 6 novae. Due to the brightness of the background in the nucleus region, it was necessary to first subtract the background level before searching for novae in the inner regions. An estimate of the background level was obtained with the MEDIAN routine in IRAF. In this routine, each pixel of the image was replaced by the median of the pixel values in an pixel box centered on the pixel in question. The resulting median image was then subtracted from the original, allowing novae to be detected to within 10′′ of the nucleus. Six additional novae were identified by directly blinking the median subtracted images.
As a check on the direct blinking method, master images were aligned and then the point spread functions were matched with the PSFMATCH routine. Each image was divided into 16 pixel sub-images prior to the alignment. The matched images were divided by each other and novae were identified as residual sources on the differenced frame. This method resulted in the discovery of one new nova, and allowed us to confirm novae found via directly blinking the images. A total of 13 novae were discovered in the 10 epochs spanned by our survey.
2.2 Nova Photometry
Photometric measurements were made of both the novae and secondary standard stars using two different methods. In the first case, raw magnitudes were extracted directly using the PSF routines in the IRAF package DAOPHOT. As a check on the PSF measurements, simple-aperture photometry was performed with PHOT. Due to the high level of galactic background light around the novae and the standard stars, we first extracted pixel subimages centered around each target. After excluding a 10 pixel radius aperture around the target, we fit a two-dimensional surface to the background with the IMSURFIT routine. This fitted surface was subtracted from the image, leaving a flattened image on which to perform the aperture photometry. Using apertures of the order of the seeing FWHM, we derived instrumental magnitudes for the novae discovered in this survey, and for the secondary H standard stars given Shafter et al. (2000), which were originally calibrated from the spectrophotometric standard stars of Stone (1977) and Oke (1974). The magnitudes resulting from both the PHOT and PSF methods were usually consistent to within 0.1 mag and in these cases the mean of the two measurements was adopted. When the magnitudes differed by more than 0.1 mag, the discrepancy was attributed to the difficulty in fitting the level of the background light and we adopted the PSF magnitude. Following Shafter & Irby (2001) and Williams & Shafter (2004) we have assumed a 100% filling fraction over the bandpass of the H filter. Although this introduces a small error in the calibration in cases where a nova’s H emission underfills the bandpass, it has the benefit of allowing a direct comparison of our magnitudes with those of previous studies.
The discovery dates, positions, and H magnitudes of the 13 novae discovered in our survey are presented in Table 2. Two of the novae, CSM2005-1 and CSM2006-6, were detected in subsequent epochs. However, since the times of maximum light for these novae cannot be constrained, no useful light curve information can be gleaned from these data.
3 The Nova Rate
Following Shafter et al. (2000) and Williams & Shafter (2004), we have estimated the nova rate in M101 using two approaches: through a Monte Carlo simulation, and through a mean nova lifetime method. In both cases, a computation of the nova rate requires that we accurately estimate the completeness of our survey. Following the procedure of Williams & Shafter (2004), the completeness was established with artificial star tests using the ADDSTAR routine in IRAF. For a typical survey image, ADDSTAR generated artificial novae based on the PSF model that was generated for the image during the photometry performed earlier. Artificial novae for 8 equally-spaced magnitude bins, from = 19.5 to = 23.0, were generated. For each magnitude bin, 100 artificial novae were distributed throughout the image with a spatial distribution that followed the -band light as determined from the Two Micron All Sky Survey (2MASS) data (Jarrett et al. 2003). We then searched for these “novae” using the same methods employed to find the actual novae. This process was repeated three times, with similar results, and the mean fraction of novae recovered in each bin allowed us to construct the completeness function, , shown in Figure 1. The fraction of novae recovered starts to drop steeply beyond a magnitude of , where we estimate the survey is % complete.
3.1 The Monte Carlo Method
In the Monte Carlo method, we compare the actual number of novae observed in our survey () with estimates of the number of novae we expect to observe as a function of the intrinsic nova rate, , in M101. Initially, a set of model H light curves are constructed by selecting peak magnitudes and decay rates at random from a sample of novae observed in earlier surveys of M31 (Shafter & Irby 2001) and M81 (Neill & Shara 2004). For a range of plausible values of , an observed nova luminosity function, , is then computed based on the dates of our survey (see Table 1), and the distance of M101, which we take to be (Freedman et al. 2001). This luminosity function is then convolved with the completeness function in order to predict the number of novae expected in our survey:
| (1) |
The Monte Carlo routine is repeated times and the number of times that matches the actual number of novae observed, , is recorded. When normalized, the number of matches as a function of produces a probability distribution function for the nova rate in M101. The peak of the distribution corresponds to the most probable nova rate, yr-1 in the surveyed region as shown in Figure 2. The error estimates were determined from the probability distribution where the computed nova rate lies between 9.6 and 13.0 novae per year with 50% probability.
3.2 The Mean Nova Lifetime Method
As a check on the Monte Carlo results, a rough estimate of the nova rate can also be obtained using the mean nova lifetime method (Ciardullo et al. 1990a), which is based on the method used by Zwicky (1942) to determine extragalactic supernova rates. The nova rate in the surveyed region of the galaxy can be expressed as
| (2) |
where is the number of novae observed brighter than a specified cut-off magnitude , and is a quantity known as the “effective survey time”. For a multi-epoch survey, the effective survey time depends on the sampling frequency of the survey and on the mean nova lifetime, , which is length of time a typical nova remains brighter than . We have
| (3) |
where is the time of the th observation. A simple relationship between and was calibrated by Shafter et al. (2000) based on observations of novae in the bulge of M31, and is adopted here:
| (4) |
Before we can compute a nova rate, we must specify a suitable cut-off magnitude for our survey. As mentioned earlier, the survey completeness drops off precipitously beyond an apparent magnitude of . Thus, for our purposes we will adopt a value of corresponding to . Using a distance modulus of = 29.13 0.11 for M101 (Freedman et al. 2001), and estimated foreground extinction of mag at H (Schlegel et al. 1998), we find . Equations 3 and 4 (coupled with the survey times listed in Table 1) then yield days, and = days for the mean nova lifetime and the effective survey time, respectively. Given that eight of the 13 novae detected were brighter than our adopted cut-off magnitude of , where we are % complete, equation 2 yields a nova rate of . Despite the simplicity of the mean nova lifetime approach, which does not properly take the incompleteness of the survey into account through , this result is in surprisingly good agreement with the results of the Monte Carlo calculation.
3.3 The Global Nova Rate
The Monte Carlo and mean nova lifetime nova rates reflect the nova rates in the surveyed region of M101, and must be corrected for any fraction of M101 that falls outside the coverage of our survey. Fortunately, the large field of view provided by the 90Prime camera has enabled us to cover essentially all of M101. Using -band photometry derived from 2MASS data (Jarrett et al. 2003), we estimate that our effective survey area includes 95% of the total infrared luminosity of M101. Thus, our estimate of the global nova rate in M101 based on the Monte Carlo calculation is yr-1, which, given the uncertainties inherent in our calculations, is in remarkable agreement with the results of Shafter et al. (2000) who estimated a rate of yr-1 based on their more limited survey. We note that our nova rate estimates should more properly be considered as lower limits on the true nova rate in M101 since we have not made corrections for the effects of extinction internal to M101, which varies significantly with spatial position.
3.4 The Luminosity-Specific Nova Rate
In order to compare the nova rates in different galaxies, the luminosity-specific nova rate (LSNR) is used to approximate a normalization by stellar mass. The infrared luminosity is used as a proxy for mass because it is a better tracer of low-mass stars than visible light. Thus, extragalactic nova studies typically normalize the global nova rate to the total -band luminosity of the galaxy (Ferrarese et al. 2003; Williams & Shafter 2004). We parameterize our LSNR, , as the number of novae per year per in the -band.
The LSNR was determined using two different estimates for the -band luminosity: from the integrated magnitude and color (as in Shafter et al. 2000), and from the value determined by the 2MASS Large Galaxy Atlas (Jarrett et al. 2003). Though the 2MASS data provides directly measured magnitudes for all galaxies with determined nova rates, there are systematic discrepancies between the magnitudes from 2MASS (K2MASS) and those from colors (Kcolor) (Ferrarese et al. 2003; Williams & Shafter 2004). Williams & Shafter attribute the discrepancy to difficulties in measuring the background levels in galaxies that cover a large area on the sky. Following these authors, we consider the LSNR derived from galaxy colors to be more reliable than the LSNR from 2MASS.
For our nova rate of yr-1 and the magnitude of 5.02 0.14 we find novae per year per , while the value of yields novae per year per . Both of these estimates are consistent with the value of novae per year per given in Williams & Shafter (2004), and based on the Shafter et al. (2000) study.
4 The Spatial Distribution of M101 Novae
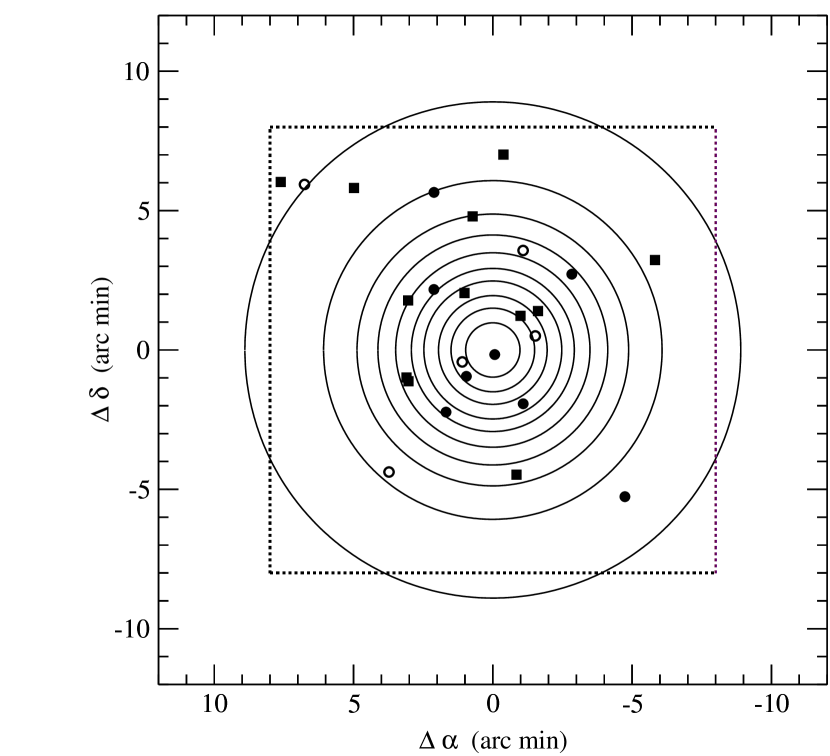
It is possible that the spatial distribution of novae within a galaxy may yield information about the evolution of binary systems in that galaxy. For example, some studies of novae in elliptical galaxies have found that novae are more heavily concentrated in the central regions (e.g., Madrid et al. 2007). The spatial distribution of the 13 novae discovered in the present study are plotted over mean -band isophotes of M101 derived from 2MASS data in Figure 3. Each isophote represents a 10% change in the total light of the galaxy. Novae brighter than the adopted limiting magnitude are represented by closed circles and those that were fainter than the limit are open circles. The novae found in the M101 study of Shafter et al. (2000) are also included and are represented as squares. It is interesting to note that although the previous study had a field-of-view of only (smaller than the estimated angular diameter of M101), none of the novae detected in the present survey with its larger coverage () fell outside the limits of our earlier survey.
Figure 4 shows the cumulative distribution of all novae from the current study and from Shafter et al. (2000) that were brighter than the limiting magnitude of their respective surveys compared to the normalized background light of the galaxy. A Kolmogorov-Smirnoff (KS) test indicates that the nova distribution does not differ significantly from that of the background light (KS=0.94). This result, as well as similar results for other spiral systems such as M31 (Shafter & Irby 2001), M33 (Williams & Shafter 2004), and M81 (Neill & Shara 2004), differs from the results found in M87 (Madrid et al. 2007) and M49 (Ferrarese et al. 2003) where the novae appear concentrated towards the centers of the galaxies, and indicates that nova progenitors may be more uniformly distributed in spiral galaxies than in ellipticals.
5 Discussion
5.1 The Nova Rate in M101
In the Shafter et al. (2000) study a nova rate of yr-1, corresponding to a LSNR of novae per year per was determined based on one epoch of observation in each of four consecutive years between 1994 and 1997. The nova rate was computed using the mean nova lifetime method, and a simplified Monte Carlo routine. Both assumed a sharp cut-off in nova detectability at a limiting magnitude of . Given that the frequency of observation was just one epoch per year, the effective survey time, was determined solely by the (inherently uncertain) value of the mean nova lifetime, , causing systematic errors in the mean nova lifetime relation to propagate directly into the computed nova rate. Errors in the mean nova lifetime relation arise from the fact that it was derived from a limited sample of M31 novae with measured H light curves from the studies of Ciardullo et al. (1990a) and Shafter & Irby (2001). Without including well-sampled H light curves from late-type galaxies we cannot state with certainty that this relationship holds for M101 novae. The Monte Carlo nova rate estimate was also affected by these uncertainties as this method also used light curve data from M31 novae.
The present study has attempted to improve on the earlier survey in a number of ways. We began by increasing the sampling frequency to include multiple epochs per year, in an attempt to minimize the dependence of the final nova rate on uncertainties in the mean nova lifetime relation. In the present survey we obtained ten epochs in a three year period, compared with the previous study, which obtained only one epoch per year for four years. Secondly, instead of adopting a specific limiting magnitude for the Monte Carlo nova rate calculation, we estimated the nova completeness as a function of magnitude, , using artificial star simulations. Finally, we further improved the Monte Carlo simulation by including H light curves of novae in M81 that have become available from the study of Neill & Shara (2004). Despite all of these improvements, and despite the uncertainties inherent in the use of multi-epoch surveys, a comparison of our results with those of Shafter et al. (2000) indicates that the derived nova rate for M101 (11.7 yr-1) is a robust one, in good agreement with the rate of 12 yr-1 found in the previous study.
Despite the agreement between the two surveys, a nagging concern is that our temporal coverage, while improved over the original Shafter et al. (2000) survey, may still result in an underestimate of the nova rate. The only H survey with nearly continuous temporal coverage over an extended period of time has been the month long survey of M81 reported in Neill & Shara (2004). This survey resulted in a LSNR nearly double that reported a decade earlier by Moses & Shafter (1993), exacerbating the concern that surveys with sporadic temporal coverage may be systematically underestimating nova rates. It is worth pointing out, however, that much of the boost in the LSNR was not the result of an increase in the nova rate, per se, but because Neill & Shara (2004) adopted a different (and lower) band luminosity for M81 based on the 2MASS survey (Jarrett et al. 2003). As discussed in Williams & Shafter (2004) there is evidence that the 2MASS survey may have systematically underestimated the integrated -band luminosities for nearby galaxies with relatively large angular diameters, such as M81. If we compare the nova rates from the two surveys, we find that Neill & Shara’s value of yr-1 is only % higher than a preliminary estimate of yr-1 reported by Moses & Shafter (1993). Thus, although surveys with continuous coverage may result in a modest increase in the nova rate for some galaxies, they are unlikely to fundamentally alter the conclusion that the LSNRs are not strongly dependent on Hubble type.
Perhaps a more significant concern is whether the properties of the H light curves from M31 and M81 used in the Monte Carlo simulation are representative of those in other galaxies such as M101 with differing Hubble types. In this regard, it would still be very useful to undertake continuous H surveys not only in M101, but in ellipticals such as M87 as well, in order to obtain H light curves from novae arising from different stellar populations.
5.2 The LSNR and Hubble Type: Latest Thoughts
Williams and Shafter (2004) recently summarized the available data for extragalactic nova rates, and found little support for the notion that the LSNR correlates strongly with Hubble type (see their figure 6). The results for M101 presented here, which are in excellent agreement with the nova rate for this galaxy found previously, obviously do not alter this conclusion. While it appears likely that the Large and Small Magellanic clouds have LSNRs times larger than other galaxies, in agreement with the predictions of Yungelson et al. (1997), the LSNRs in the Virgo ellipticals remain highly uncertain.
Arguably, the most uncertain nova rate for an individual galaxy concerns the nova rate in M87. Shafter et al. (2000) estimated a rate of based on ground-based observations that were blind to novae within a radius of 25′′ of the nucleus. To determine a global nova rate for the galaxy, these authors assumed that the cumulative nova distribution followed the integrated light of the galaxy and then extrapolated from the novae found in the galaxy’s outer regions. Recent HST observations by Madrid et al. (2007) strongly suggests that this assumption may not be valid. These authors found a total of 13 nova candidates during a HST STIS survey that spanned three epochs over 51 days. The survey covered a region centered on the nucleus of M87. The novae were highly concentrated toward the center of the field, with 11 of the 13 novae lying within of the nucleus. After correcting for the survey time, they found a nova rate in the surveyed region of 64 yr-1. This rate is amazingly high, considering that the surveyed region covered only 6% of the galaxy’s -band luminosity. Extrapolation to the entire galaxy would suggest a nova rate of more than 1000 yr-1! Given that it is extremely unlikely that the ground-based surveys could have missed such a large nova population, it seems likely that the nova distribution in M87 is significantly more centrally condensed compared with the integrated background light. If so, the M87 nova rate estimated from the ground by Shafter et al. (2000) would clearly underestimate the true nova rate.
Further evidence for a high M87 nova rate can be found in the preliminary results reported by Shara & Zurek (2002). These authors analyzed 10 epochs of archival WFPC2 images and claim to have detected over 400 novae within a radius of of M87’s nucleus. Perhaps surprisingly, unlike Madrid et al. (2007), Shara & Zurek found that the spatial distribution of their nova candidates followed the background light reasonably well. Although at the time of publication, these authors had not yet fully assessed the completeness of their survey, they argued for a lower limit on the global nova rate of 300 yr-1.
The only other Virgo elliptical for which a nova rate is available based on HST observations is M49 (Ferrarese et al. 2003). Despite the fact that M49 is slightly more luminous than M87 (M49 is the brightest galaxy in the Virgo cluster), Ferrarese et al. determined a nova rate of only 100 yr-1. Although this discrepancy seems hard to understand, given that both galaxies have similar luminosities and Hubble types, there is one significant way in which these two galaxies differ: the specific frequency of globular clusters in M87 is 3 times higher than that in M49 (Kissler-Patig 1997, Rhode & Zepf 2001). The presently uncertain ratio of nova rates and its similarity to the ratio of globular cluster frequencies between these galaxies raises the interesting possibility that a significant fraction of the nova binaries in elliptical galaxies may be spawned in globular clusters, as was originally proposed by Ciardullo et al. (1987) to explain the high bulge rate in M31.
6 Conclusions
An H survey for novae in M101 was carried out in 10 epochs over a period of 3 yr, with a total of 13 novae identified. After correcting for the effective survey time, we arrive at a global nova rate of yr-1, which corresponds to a luminosity-specific nova rate of novae per year per when the luminosity is derived from Btot and the color, and novae per year per when the magnitude is taken from the 2MASS measurements (Jarrett et al. 2003). Both values are consistent, within the stated uncertainties, with the previously published value of novae per year per given in Williams & Shafter (2004). As in previous determinations of the nova rates in spiral galaxies, a major source of uncertainty in the derived rates is introduced by our inability to properly account for the effects of extinction internal to M101. In this regard our estimates for the global nova rate and the LSNR in M101 could more conservatively be considered as lower limits to their true values.
Future observations should be focused on addressing three remaining sources of uncertainty in computing the LSNR. As described earlier, more frequent temporal sampling would be useful, not only to minimize uncertainty in computing the effective survey time, but also in establishing a larger sample of template light curves to be used in the Monte Carlo simulations. The availability of light curves from novae arising from galaxies with a wide range of Hubble types will establish whether the properties of the light curves are sensitive to stellar population. In this regard, we expect that synoptic survey telescopes such as the PanStarrs and the LSST will revolutionize the study of novae in extragalactic systems. Finally, there remains the possibility that a significant fraction of the novae, particularly in late-type galaxies such as M101, may be missed because of extinction within the galaxies themselves. Perhaps future observations with wide-field infrared imagers can help alleviate this concern.
References
- Bruzual & Charlot (2003) Bruzual, G., & Charlot, S. 2003, MNRAS, 344, 1000
- Ciardullo et al. (1987) Ciardullo, R., Ford, H. C., Neill, J. D., Jacoby, G. H., & Shafter, A. W. 1987, ApJ, 318, 520
- Ciardullo et al. (1990b) Ciardullo, R., Ford, H. C., Williams, R. E., Tamblyn, P., & Jacoby, G. H. 1990b, AJ, 99, 1079
- Ciardullo et al. (1990a) Ciardullo, R., Shafter, A. W., Ford, H. C., Neill, J. D., Shara, M. M. & Tomaney, A. B. 1990a, ApJ, 356, 472
- Della Valle et al. (1992) Della Valle, M., Bianchini, A., Livio, M., & Orio, M. 1992, A&A, 266, 232
- Della Valle & Gilmozzi (2002) Della Valle, M., & Gilmozzi, R. 2002, Science, 296, 1275
- Della Valle & Livio (1998) Della Valle, M., & Livio, M. 1998, ApJ, 506, 818
- Della Valle et al. (1994) Della Valle, M., Rosino, L., Bianchini, A., & Livio, M. 1994, A&A, 287, 403
- Downes & Duerbeck (2000) Downes, R. A., & Duerbeck, H. W. 2000, AJ, 120, 2007
- Duerbeck (1990) Duerbeck, H. W. 1990, in Physics of Classical Novae, ed. A. Cassatella & R. Viotti (New York: Springer), 96
- Ferrarese et al. (2003) Ferrarese, L., Cote, P., & Jordan, A. 2003, ApJ, 599, 1302
- Freedman et al. (2001) Freedman et al. 2001, ApJ, 553, 47
- Gavazzi & Scodeggio (1996) Gavazzi, G., & Scodeggio, M. 1996, A&A, 312, L29
- Gehrz et al. (1998) Gehrz, R. D., Truran, J. W., Williams, R. E., & Starrfield, S. 1998, PASP, 110, 3
- Jarrett et al. (2003) Jarrett, T. H., Chester, T., Cutri, R., Schneider, S. E., & Huchra, J. P. 2003, AJ, 125, 525
- Kissler-Patig (1997) Kissler-Patig, M. 1997, A&A, 319, 83
- Livio (1992) Livio, M. 1992, ApJ, 393, 516
- Madrid et al. (2007) Madrid, J. P., Sparks, W. B., Ferguson, H. C., Livio, M., & Macchetto, D. 2007, ApJ, 654, L41
- Mclaughlin (1945) Mclaughlin, D. B. 1945, PASP, 57, 69
- Moses & Shafter (1993) Moses, R. N., & Shafter, A. W. 1993, BAAS, 25, 1248
- Neill & Shara (2004) Neill, J. D., & Shara, M. M. 2004, AJ, 127, 816
- Oke (1974) Oke, J. B. 1974, ApJS, 27, 21
- Pritchet & van den Bergh (1987) Pritchet, C. J., & van den Bergh, S. 1987, ApJ, 318, 507
- Ritter et al. (1991) Ritter, H., Politano, M., Livio, M., & Webbink, R. F. 1991, ApJ, 376, 177
- Rhode & Zepf (2001) Rhode, K. L., & Zepf, S. E. 2001, AJ, 121, 210
- Schlegel et al. (1998) Schlegel, D. J., Finkbeiner, D. P., & Davis, M. 1998, ApJ, 500, 525
- Shafter, Ciardullo, & Pritchet (2000) Shafter, A. W., Ciardullo, R., & Pritchet, C. J. 2000, ApJ,530, 193
- Shafter & Irby (2001) Shafter, A. W. & Irby, B. K. 2001, ApJ, 563, 749
- Shara & Zurek (2002) Shara, M. M. & Zurek, D. R. 2002, in AIP Conf. Proc. 637, Classical Nova Explosions, ed. M. Hernanz & J. Jose (Melville: AIP), 457
- Stone (1977) Stone, R. P. S. 1977, ApJ, 218, 767
- Tutukov & Yungelson (1995) Tutukov, A. & Yungelson, L. 1995, in Cataclysmic Variables, ed. A. Bianchini, M. Della Valle, & M. Orio (Dordrecht: Kluwer), 495
- Warner (1995) Warner, B. 1995, Cataclysmic Variable Stars (Cambridge: Cambridge University Press).
- Williams (1992) Williams, R. E. 1992, AJ, 104, 725
- Williams & Shafter (2004) Williams, S. J. & Shafter, A. W. 2004, ApJ, 612, 867
- Williams et al. (2004) Williams, G. G., Olszewski, E., Lesser, M. P., & Burge, J. H. 2004, Proc. SPIE, 5492, 787
- Yungelson, Livio, & Tutukov (1997) Yungelson, L, Livio, M., & Tutukov, A. 1997, ApJ, 481, 127
- Zwicky (1936) Zwicky, F. 1936, PASP, 48, 191
- Zwicky (1942) Zwicky, F. 1942, ApJ, 96, 28
| Julian Date | Number of | Total Integration Time | Mean Seeing | |
|---|---|---|---|---|
| UT Date | (2,450,000+) | Exposures | (hours) | (arcsec) |
| 2005 May 02… | 3493 | 7 | 1.75 | 1.5 |
| 2005 May 03… | 3494 | 9 | 2.25 | 2.0 |
| 2005 May 31… | 3522 | 4 | 1.33 | 1.4 |
| 2005 June 01… | 3523 | 8 | 2.67 | 1.5 |
| 2006 Feb 07… | 3774 | 11 | 2.75 | 2.0 |
| 2006 Feb 21… | 3788 | 7 | 1.75 | 1.3 |
| 2006 Feb 22… | 3789 | 5 | 1.25 | 2.0 |
| 2006 Apr 19… | 3845 | 12 | 3.0 | 1.4 |
| 2006 Apr 20… | 3846 | 4 | 1.0 | 1.4 |
| 2006 May 24… | 3880 | 18 | 4.5 | 1.8 |
| 2006 Jun 17… | 3904 | 10 | 2.5 | 1.2 |
| 2006 Jun 18… | 3905 | 4 | 1.0 | 1.2 |
| 2006 Dec 13… | 4083 | 4 | 0.67 | 1.5 |
| 2007 Jan 28… | 4129 | 13 | 3.25 | 1.2 |
| 2007 Mar 11… | 4171 | 14 | 3.5 | 2.5 |
| 2007 Mar 12… | 4172 | 4 | 1.0 | 2.0 |
| 2007 May 22… | 4244 | 9 | 2.25 | 1.5 |
| 2007 May 23… | 4245 | 9 | 2.25 | 1.0 |
Note. — All exposures were taken through an H filter.
| JD Discovery | |||||
|---|---|---|---|---|---|
| Nova | (2,450,000+) | (J2000.0) | (J2000.0) | (arcmin) | (mag) |
| CSM2005 - 1… | 3493 | 14 03 27 | 54 26 32 | 6.04 | 20.7 |
| 3522 | … | … | … | 21.6 | |
| CSM2005 - 2… | 3522 | 14 03 27 | 54 23 03 | 3.03 | 21.5 |
| CSM2006 - 1… | 3788 | 14 03 02 | 54 21 23 | 1.60 | 21.8 |
| CSM2006 - 2… | 3845 | 14 03 20 | 54 20 27 | 1.17 | 22.1 |
| CSM2006 - 3… | 3880 | 14 03 24 | 54 18 39 | 2.78 | 21.0 |
| CSM2006 - 4… | 3880 | 14 03 59 | 54 26 49 | 8.98 | 22.7 |
| CSM2006 - 5… | 3904 | 14 02 40 | 54 15 37 | 7.08 | 21.5 |
| CSM2006 - 6… | 4083 | 14 02 53 | 54 23 36 | 3.92 | 19.8 |
| 4129 | … | … | … | 21.4 | |
| CSM2007 - 1… | 4129 | 14 03 38 | 54 16 30 | 5.73 | 22.0 |
| CSM2007 - 2… | 4171 | 14 03 05 | 54 18 57 | 2.22 | 19.8 |
| CSM2007 - 3… | 4171 | 14 03 12 | 54 20 43 | 0.17 | 20.2 |
| CSM2007 - 4… | 4171 | 14 03 19 | 54 19 56 | 1.33 | 19.9 |
| CSM2007 - 5… | 4244 | 14 03 05 | 54 24 27 | 3.70 | 22.6 |
Note. — Units of right ascension are hours, minutes, and seconds, and units of declination are degrees, arcminutes, and arcseconds. is the distance of the nova from the center of M101. We estimate the positions to be accurate to 1 arcsec in each coordinate.