Examination of the measurement possibility of the decay using WASA-at-COSY apparatuss
INSTITUTE OF PHYSICS
FACULTY OF PHYSICS, ASTRONOMY
AND APPLIED COMPUTER SCIENCE
JAGIELLONIAN UNIVERSITY
Feasibility study
of the decay
using WASA-at-COSY apparatus
Marcin Zieliński
Master Thesis
prepared in the Nuclear Physics Division
of the Jagiellonian University
supervised by
Prof. dr hab. Paweł Moskal
![[Uncaptioned image]](/html/0807.0576/assets/x1.png)
Abstract
One of the objectives of the vast physics programme of the recently comissioned WASA-at-COSY facility is the study of fundamental symmetries via the measurements of the and mesons decays. Especially interesting are isospin violating hadronic precesses of these mesons into 3 systems driven by the term of QCD Lagrangian which depends on the mass difference of the and quarks.
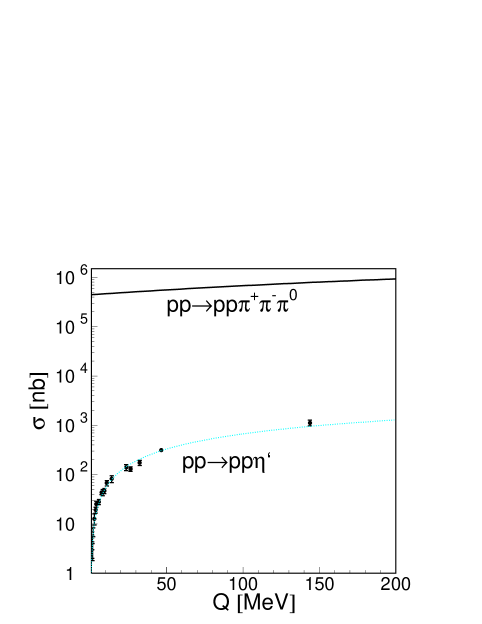
When an or an meson is created in the hadronic reaction signals from such decays may be significantly obscured by the prompt production of mesons. In this thesis we present the estimation of the upper limit of the background due to prompt pion production for the and decays. Using the data from proton-proton collisions measured by the COSY-11 group we have extracted differential cross sections for the multimeson production with the invariant mass corresponding to the mass of the meson. Based on these results and on parametrizations of the total cross sections for the meson as well as parametrization of the upper limit for the prompt production in the collisions of protons we discuss in details the feasibility of a measurement of the meson decay into channels with the WASA-at-COSY facility. Based on the chiral unitary approach the value of the branching ratio BR() was recently predicted to be about 1%. We show that the WASA-at-COSY has a potential to verify this result empirically.
Furthermore, we discuss the possible usage of the time signals and of the energy loss measurement in the forward part of the WASA-at-COSY detector for the determination of the energy of the forward scattered charged particles. We briefly describe the detectors to be used for this purpose and introduce the computational algorithm which was developed to be applied with this technique.
| ”There is no expedient | ”Nie ma takiego fortelu, |
| to which a man will not go | do ktrego nie odwoaby si czowiek, |
| to avoid the labor of thinking.” | aby unikn pracy zwanej myleniem.” |
Thomas Alva Edison (1847 – 1931)
Chapter 0 Introduction
The Standard Model is nowadays a well known and established theory describing the particles and theirs strong, electromagnetic and weak interactions. Therefore, tests of the applicability of this model are very important and are carried out in many particle physics laboratories. In particular particle physicists endeavour to discover phenomena which the Standard Model does not describe. One of such laboratory is WASA-at-COSY [1] where we investigate the limits of applicability of the Standard Model by studying production and decays of pseudoscalar mesons like and . The examination of these meson production and their decays give us a chance to probe fundamental symmetries like C (charge conjugation), P (parity), T (time reversal) and their combinations and to determine the parameters of the Standard Model like for example the quark masses.
The masses of the light quarks (up -, down - , strange - ) are known only approximately due to the fact that quarks are confined inside hadrons and cannot be observed directly as physical particles. But there are several indirect possibilities of establishing these masses by measuring the mass differences and mass ratios. The mass difference of light quarks may be derived from the partial widths of the decay of the and mesons into and theirs total widths. The possibility of determining of the difference between the mass of the light quarks motivates us for studing these decays.
Detailed studies of decay was conducted by the WASA/CELSIUS collaboration [2], but so far the decay has never been observed. In both of these processes the isospin conservation is violated [3]. But despite this fact in case of the meson the branching ratio for the decay is in the order of 50%. However, for the meson the situation is quite different the branching ratio for the is at the permil level and for the system so far only an upper limit of 5% was established [4].
For the decay of both and mesons there exists a physical background from the direct production of three pions via the reaction channel. In case of the meson the signal to background ratio is large, amounting to about 10 for tagging by means of the missing mass technique with a resolution of a few MeV, and permits a clear identification of the decay. However, this ratio is expected to be worse by more than three orders of magnitude for the meson making the investigations much more challenging experimentally, especially since the hadronic production cross section is by about a factor of thirty smaller for the meson in comparison to the () meson at the same excess energy.
The main aim of this thesis is the determination of the optimum beam momentum for the measurement of the branching ratio for the decay channel via the reaction chain. The measurement is planned to be carried out in the near future and its result will be used for the derivation of the light quarks mass difference (). The experiment will take place at the Research Centre Jülich in Germany and will be conducted by the WASA-at-COSY collaboration. The identification of the reaction is based on selecting events where the system was produced. For this subsample of data the fractions corresponding to the direct production and to the decay of the meson will be extracted based on the missing mass of the two outgoing protons registered in the Forward Detector of the WASA-at-COSY system.
To calculate the number of expected events we have parametrized the total cross section for the meson production and have etablished a parametrization for an upper limit of the background production. Further on we have parametrized a missing mass resolution taking into account effects which are related with the energy resolution of the forward detector and the beam and target spread. In the case of the meson the missing mass resolution is at present not satisfactory for studies of rare decays due to the high energies of the protons. Therefore, we have proposed the usage of the time-of-flight method (TOF) for the identification of charged particles emitted in forward direction based on time signals from the scintillator detectors.
In the next chapter of this work we will outline difficulties of the mass determination for light quarks. We will quote the idea of an indirect determination of quark masses proposed by D. Gross , B. Treiman and F. Wilczek [5], and by H. Leutwyler [6].
The measurment and identification method of the decay as well as the WASA-at-COSY detector setup will be presented in Chapter 3.
The first section of Chapter 4 describes how the total cross section for the production of the meson depends on the excess energy near the kinematical threshold. Further on in this chapter the method of estimating an upper limit of the background under the peak in the missing mass distribution will be given [7]. Next, applying the parametrization of the energy resolution of the detector, the accuracy of the branching ratio determination as a function of excess energy and time will be shown. For the calculation we consider a range of values for the upper limit of 5% down to a value lower by one order of magniude (0.5%).
In chapter 5 we will propose a method of particle energy reconstruction by measuring the time in the Forward Detector. For the purpose of this thesis we will consider only thin scintillators, but in the future the reconstruction will be based on time signals form all detectors. First we will show results of simulations for an energy resolution based on TOF measurements and describe how passive material of the detector influences the precision of the TOF determination. As a result of the simulations the missing mass distributions calculated based on the TOF measurment will be shown. In the last section of this chapter we will describe the computational algorithm which was developed to reconstruct the energy of particles based on the time signals from scintillators and energy losses in the five independent layers of the range hodoscope.
Chapter 6 summarises the whole thesis and brings the conclusions and remarks regarding the beam momentum and the duration of the planned measurement of the decay.
The work is supplemented with Appendics where section 6 introduces basic informations about the meson and the SU(3) symmetry. Appendix 7 describes the missing mass technique used for tagging the meson production. Section 8 provides an analytical calculation of the fractional momentum resolution as a function of the fractional time resolution. In appendix 9 the parametrization of the total cross section for the production will be shown. Section 10 introduces the parametrization of the Final State Interaction (FSI) and production dynamic of the multipion system. The next section presents simulations of the production in proton-proton collisions using models described in section 10. The last appendix shows schemes of programs used for the simulations.
Chapter 1 Relation between the partial width
and the and quark mass
The determination of the light quark masses is one of the important goals of hadron physics experiments, and we intend to contribute to their estimations by determining the quark mass difference which induces an isospin breaking. Studing the isospin-violating decays and was pointed out as an accurate way of extracting the quark mass difference [5, 6].
The quark masses are one of the Standard Model parameters and their values depend on how they are defined. The field theory which describes the strong interaction between gluons and quarks is the Quantum Chromodynamics (QCD). A general QCD Lagrangian for flavors reads:
| (1) |
where denotes the quark masses, indicates the gauge convariant derivative and represents the gluon field strength.
In the low energy regime where the strong coupling constant is large, the perturbative approach of QCD cannot be applied in the same way as for high energies. Thus other methods must be applied in low energy hadron physics. One of these approaches is an effective field theory of QCD at low energies - the Chiral Perturbation Theory (ChPT). It is based on the observation that, in the low energy region, the relevant and effective degress of freedom of strong interactions are hadrons composed of confined quarks and gluons. This leads to the effective Lagrangian which is formulated in terms of the effective degrees of freedom:
| (2) |
We can use this effective Lagrangian instead of the formula (1). The term is the part of flavor symmetry of QCD and contains a contribution:
| (3) |
responsible for the isospin changing in QCD (). One can identify the degrees of freedom as eight Goldstone bosons which are , and mesons from the pseudoscalar meson nonet. This effective Lagrangian breakes down spontaneously the chiral symmetry to . It is believed that this violation of the chiral symmetry constitutes the source of the mass generation in QCD. The standard ChPT provides an accurate description of the strong and electroweak interactions of the pseudoscalar mesons at low energies.
The and mesons are members of the pseudoscalar nonet, and play an important role in the understanding of the low energy QCD. Due to the mixing of the and fields the treatment in the standard ChPT is complicated. The meson is related with the axial U(1) anomaly. This anomaly in QCD prevents the meson from being a Goldston boson which is manifested in its large mass ( MeV), a mass which is much larger than the masses of other members of pseudoscalar nonet (see. App. 6). Hence the meson is not included explicitly in the conventional SU(3) ChPT, albeit its effects are hidden in coupling constants. A recent extension of ChPT methods has provided tools which enable to include in a consistent way and perform reliable calculations. One of these tools is a chiral unitary approach, which is based on the chiral perturbation theory and the unitarization using the Bethe-Salpeter equation.
Concernig hadronic decays of the and mesons into three pion systems, we can certify that 3 can be in isospin 0 state only if a two pion subsystem is in I = 1 state. In case of the system the two pion can have I2π = 0, 1, 2 but coupling with the remaining pion to I3π = 0 is only possible if I2π = 1. However, the dose not exist (a corresponding Clebsch-Gordan coefficient is equal to zero [8]) and as a conseqence the decay has to violate isospin.
In the case of the decay taking into account the Clebsch-Gordan coefficients [8] one can write [9]:
| (4) |
where:
Thus the full wave function for the 3 system reads:
| (5) |
This wave function is antisymmetric against any exchange of pions: , and . In particular, by applying charge conjugation we have:
| (6) |
This is in contradiction with C = +1 for . Therefore the decay should violate C or I.
On the other hand there exist a operator which is constructed from the parity and isospin operators in the following way:
| (7) |
The eigenvalue of this operator is given by , thus for pions and for the mesons. Therefore the decay does not conserve .
Historically these decays were considered as electromagnetic processes with partial widths smaller than the second order electromagnetic decay . But it appears that the electromagnetic contribution is small [10, 11] and instead the process is expected to be dominated by the isospin-violating term in the strong interaction. Due to this fact we can neglect the electromagnetic terms, and thus the decay amplitudes of the decay becomes directly proportional to the quark mass difference () [6].
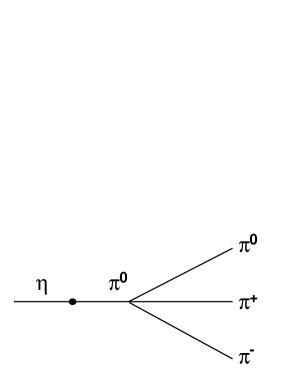
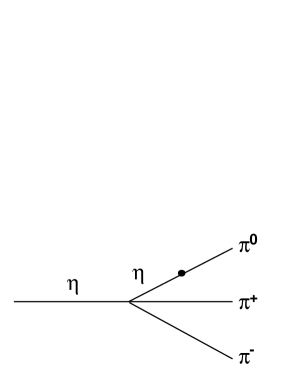

The lowest order contribution to the decay mechanism is given by the Current Algebra (CA). Figure 1 shows graphs consisting of a combination of the mixing (a,b) and crossed graph (c) of the elementary low energy QCD processes - scattering of two pseudoscalar mesons. The partial width of the decay calculated using Current Algebra is 66 MeV [12], which is much below the experimental value of 29416 MeV [8]. Gasser and Leutwyler had corrected this value to 160 eV [13] using the second order in the low energy expansion of the effective QCD Lagrangian. This change implies the importance of the interaction in the final state and involving higher loop calculations should improve this value since they give a better description of the final state interaction. An other approach which includes a pion-pion interaction up to higher orders uses the dispersion relation, which connects the imaginary part of the decay amplitude with the amplitude itself. There are two estimations based on this method [14, 15] but using different formalisms. They lead consistently to an enhancement of the decay rate by about 14%.
It was suggested by H. Leutwyler that the decay width of the is sensitive to the mass difference of the light quarks following the relation [6]:
| (8) |
More explicitly the decay width can be written in a convenient form as:
| (9) |
where the dependence of the and quarks mass difference is contained in the term:
| (10) |
and is given by a relation:
| (11) |
and correspond to and calculated in the Dashen limit [16] where the quark masses are constrained by the assumption that the electromagnetic mass difference for kaons and pions are equal. Using the leading order expression of masses of the pseudoscalar mesons and applying the Dashem theorem, it was numerically calculated that . The decay width is very sensitive to the exact value of and thus provides the precise constraints for the light quark mass ratios. Q determines the major axis of the ellipse of the light quark mass ratios which is given by the formula:
| (12) |
The ellipse is shown in Fig. 2.
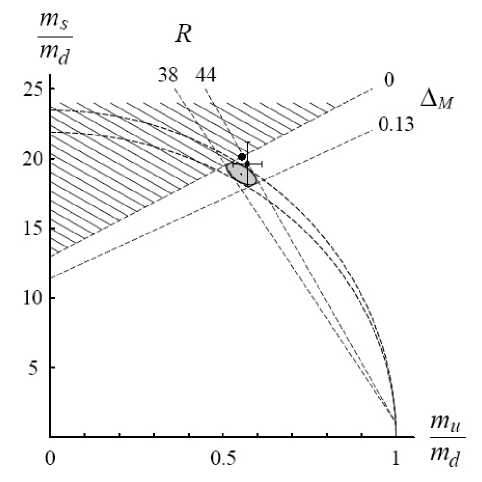
For the determination of Q we can use together with the experimantal value of . Recently Q value of 22.8 was derived by means of the dispersion relation approach from preliminary KLOE data on the decay [17]. In Fig. 2, the quark mass ratio is indicated by the shaded uncertainity ellipse. The upper and lower sides of the ellipse is bound by two dashed lines corresponding to Q=22.7 0.8. From the left it touches the hatched region, excluded by the bound , calculated in the leading term in the expansion of powers and extended to first non-leading order. Other bounds are given by the limits of the branchning ratios . The dot corresponds to Weinberg’s value, and the cross represents the estimations described in the reference [18]. The Weinberg ratio corresponds to , and is located at the boundary of this region. In particular this implies and excludes a massless quark.
The factor can be calculated in the chiral limit where the mass of quarks tends toward zero . Estimations of the decay width by the Chiral Perturbation Theory are based on the leading term of the expansion in the quark masses and the precise calculations of in the isospin limit. In case of this method the normalization for the decay width must be obtained from other experminents with the electroproduction of the meson.
Gross, Treiman and Wilczek [5] have proposed another method of establishing the light quark mass difference by finding the ratio of partial widths for the isospin violating decay to the isospin conserving process of :
| (13) |
where the factor 16.8 denotes the ratio of phase-space volumes. Formula (13) was claimed to be true under two assumptions: that the amplitudes for both decays are constant over the phase space, and the amplitudes are related via [5]:
| (14) |
where indicates the mixing angle:
| (15) |
The second assumption directly implies that the decay proceeds entirely through the channel followed by mixing.
From equation (13) one can see that the measurement of the ratio does not require the information from other experiments for normalization of the partial decay width. Additionally with the simultaneous measurement of these decays, due to the similar final state, many systematical uncertainties will cancel.
But recently Borasoy et al. [19] claimed that the light quark masses can not be extracted from the ratio (13). They studied the two assumptions which were mentioned above using the U(3) chiral unitary framework which is in good agreement with data as regarding widths and spectral shapes. They showed that results from the chiral unitary approach are in disagreement with these two assumptions. Concluding that on the theoretical side a still more sophisticated treatment including the final state interaction is required for univocal statements about the quark masses [20].
In our experiment we intend to establish the ratio hoping that the near future progress on the theory side will permit us to determine univocally from this ratio the light quark mass difference . Further more, in combination with experiments determining values of quark mass ratios and , it would be possible to obtain the absolut values of the and quark masses.
Chapter 2 Measurement method of the
The partial width may be determined from the branching ratio of the decay and the total width of the meson. In the WASA-at-COSY experiment the meson will be created in two proton collisions via the reaction. The measurement have to be performed at best possible conditions, because the decay channel is very rare. So far the decay was never observed and only an upper limit of 5% for the branching ratio has been established [4]. Recent theoretical calculations, based on a chiral unitary approach, predict the branching ratio of about 1% [19].
1 Branching ratio
The branching ratio is a quantity which informs about the probability of the particle decay into a specific channel. It is defined as:
| (1) |
where and denote the partial and total (natural) width of the particle, respectively. Index indicates a decay channel. From (1) we can see that the determination of partial widths will rely on the precise determination of branching ratio and of the total width.
For the decay the branching ratio can be explicitly expressed as:
| (2) |
where is the searched observable. The is known from the Particle Data Group (PDG) estimations to be MeV/c2 [8]111 The COSY-11 collaboration is working on a more precise estimation of this value with a dedicated measurement of the mass distributions by using the missing mass techniques applied to the reaction very close to the kinematical threshold [21]., and BR() still remains to be established experimentally. With the WASA-at-COSY facility we plan to determine this branching ratio as the ratio of the number of events where decays into the system () to the number of all produced mesons ():
| (3) |
For this purpose the mesons will be produced in collisions of the proton beam with the hydrogen pellet target via the reaction. The outgoing protons and the products of the decay of the meson will be detected and identified using the WASA-at-COSY detection system. More details of the measurement techniques will be given in the following sections.
2 Description of the WASA-at-COSY detector facility
The COoler SYnchrotron (COSY) is a storage ring operating at the Research Centre Jülich (Germany) since 1993 [22]. It delivers unpolarized and polarized proton and deuteron [23] beams in the momentum range between 300 and 3700 MeV/c. The first step of the particle acceleration takes place in the isochronous cyclotron (JULIC). Next the beam is injected into the 184 m long COSY ring (see Fig. 1) where the particles experience further acceleration and at present may be used for experiments with the WASA [1], ANKE [24] and TOF (external beam) [25] detection setups where the energy of the beam allows for production of all basic pseudoscalar and vector mesons.
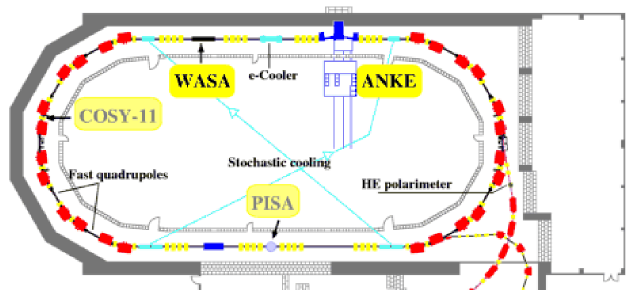
The COSY accelerator is equipped with two types of beam cooling systems: an electron and stochastic cooling used for low and high energies, respectively [28]. Both cooling systems allow to decrease the momentum and geometrical spread of the beam. The whole process for the beam preparation from injection till final state of acceleration takes a few seconds. The ring can be filled with up to particles, and the life time of the circulating beam ranges from minutes to hours depending on the thickness of the used target.
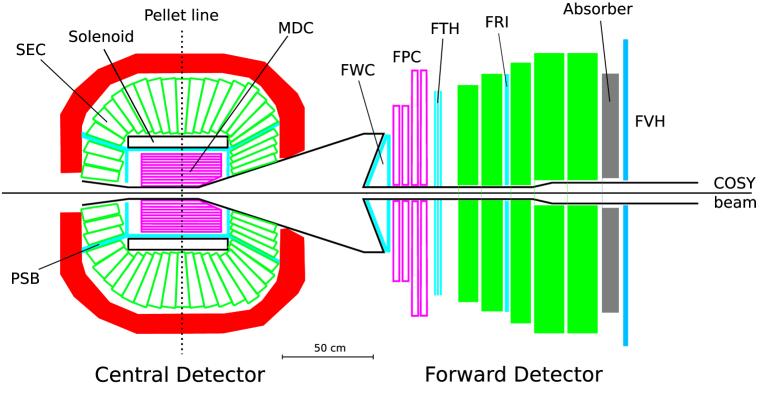
In 2006 the WASA detector [29] has been transferred from the CELSIUS [30] facility in Uppsala to the COSY ring [22] in Jülich where it was successfully installed and brought into operation. The WASA-at-COSY, shown schematically in Fig. 2, is a large acceptance detector which consists of three main parts: the Central Detector (CD), the Forward Detector (FD) and the pellet target system [31, 32, 33].
The Central Detector (CD) [34] is used for detection and identification of charged and neutral particles () which are the decay products of short lived mesons like , and . It covers scattering angles between and . The most outer part of the CD constitutes an electromagnetic calorimeter (SEC) built out of 1012 CsI scintillating crystals positioned around the interaction point [35]. The crystals are ordered in 24 rings between the iron yoke and super-conducting solenoid which provides an axial magnetic field enabling the determination of the momenta of charged particles by measuring their tracks with the Mini Drift Chamber (MDC) [36]. The MDC is mounted around the beam pipe inside of the solenoid. It is a cylinder which consists of 17 layers of straw tubes. Each straw is made out of thin mylar foil tube, with a gold plated sensing wire in its center. The drift chamber is surrounded with the Plastic Scintillator Barrel (PSB) [36] used for trigger purposes and for the determination of the energy loss for charged particles. PSB together with SEC and MDC permits the identification of charged particles by means of the energy loss method ().
The forward part of the WASA detector is built out of thirteen scintillating layers and four layers of straw drift chambers. The forward detector was designed for the detection and identification of protons, deutrons and He nuclei. The detector closest to the scattering chamber - Forward Window Counter (FWC) - covers the conical exit window of the axially symmetric scattering chamber towards the Forward Detector assembly [37]. Presently it is used for trigger purposes, but in the future it will also serve as a start detector for the time-of-flight determination.
For the track reconstruction the Forward Proportional Chamber (FPC) [38] is used. It provides information about particle scattering angles with a precision better than 0.2o [39]. The FPC planes are rotated by with respect to each other. Directly behind the straw detector the three layer Forward Trigger Hodoscope (FTH) [40, 41] is placed. It consists out of 96 individual plastic scintillator elements arranged in three layers: two layers with modules in the form of Archimedean spiral and one layer with cake-piece shaped modules. The FTH provides information about charged particle multiplicities in the FD used for the first level trigger, as well as in the offline track reconstruction [42]. Future trigger developments aim at a complete real time scattering angle reconstruction of individual tracks. This information, combined with the information of deposited energy in successive detector layers, will allow to determine the missing mass of forward going particles on the trigger level, and thus will provide a very efficient meson tagging [42]. The FTH detector can also be used to deliver the time information and it is thus helpful for the application of the TOF technique.
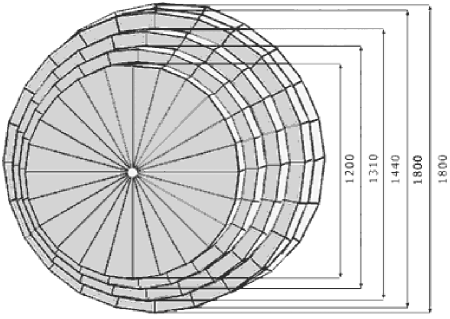
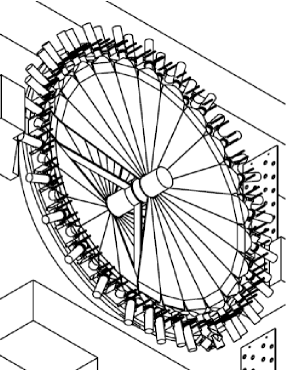
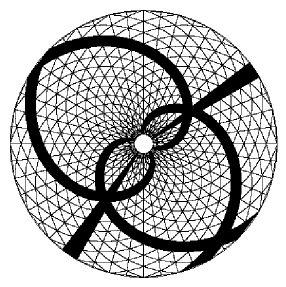
The next five thick planes are called Forword Range Hodoscope (FRH) and are made out of cake-piece shaped plastic scintillator modules (see Fig. 3). This detector enables identification of charged particles from the absolute value and the pattern of energy deposited in different layers.
Among the second and third layer of the FRH the Forward Range Interleaving hodoscope (FRI) [44] is mounted. It is composed of two interleaving planes of 32 plastic scintillators bars aligned horizontally and vertically. The main function of the FRI is the measurement of the hit position of the charged particles improving the resolution for the vertex reconstruction. In addition, the FRI delivers also time information which can be used in the future application of the time-of-flight method.
The Forward Veto Hodoscope (FVH) [45] is the last detection layer. It consists of 12 horizontally placed plastic scintillator modules equipped with the photomultiplayers on both sides. The FVH gives the position of particle hits, reconstructed from time signals determined on two side of the module. It is important to note that this detector can also be used to deliver time information () for the TOF technique. It is also worth mentioning that in the near future it is planned to extend the FVH by a second layer of vertically arranged scintillators [46].
Finally, depending on the studied reaction, a passive absorber (FRA) made of iron can be positioned in front of the FVH, enabling to disantangle between slow and fast particles. The thickness of the material can be choosen from 5 mm up to 100 mm.
From the beginning of its operation at CELSIUS and COSY the WASA detector is equipped with a pellet target system [31, 32, 33], providing a stream of frozen hydrogen droplets with a diameter of about 35 m. Pellets are passing to the interaction region through a thin 2 m long pipe. Usage of this type of target enables to achieve densities of up to 1015 atoms/cm2 resulting in luminosities of up to 1032cm-2s-1 when combined with the COSY beam of 1011 particles stored in the ring.
3 Identification of the reaction chain
The proposed experiment aiming at the determination of the branching ratio for the decay will be based on the production of the meson in proton-proton collisions and registration of its decay products. The complete reaction chain which needs to be identified (production and decay) reads:
The measurement relay on the registration of all particles in the final state and on the determination of their four-momenta:
In order to measure the energy of the two forward scattered protons the FRH1-5 planes in the Forward Detector are used which provide information of the energy losses. To determine the direction of these two protons we use the straw chambers of the FPC and the FRI detector. Charged pions scattered under angles larger then 18o will be registered in the Central Detector. The MDC will provide information about the direction and the SEC will allow to measure the energy losses. In the case when the charged pion will be scattered forward (angular range of 2.5o - 18o) it will be detected by the Forward Detector in the same way as the protons. The two gamma quanta originating from the decay will be recorded in the SEC from which we will receive the information about their energy and direction.
4 Invariant and missing mass techniques
At the first stage of the data analysis we have to select from the full data sample only these events where were produced and in the second step using a missing mass technique we will determine fractions of selected events corresponding to the direct production and to the decays of meson.
In order to identify signals from the mesons, we will reconstruct the invariant mass of two gamma quanta:
| (4) |
which should be equal to the mass of the neutral pion within the expected resolution. Next we identify the charged pions on the basis of the energy measured in the SEC () and their momenta () derived from the curvature of the tracks reconstructed from signals measured with the MDC. In the case of the the energy and momenta should fulfill (within the expected resolution) the relation:
| (5) |
where denotes the mass of a charged pion.
Further on, from measuring the energy loss in the five scintillator layers of the FD and tracks in the FPC (in the future also from the time-of-flight) we reconstruct the four-momentum vector of the forward emitted protons [47]. Next in order to check whether the identified pions originate from the decay of the meson, we calculate a missing mass of the reaction according to the equation (see Appendix 7):
| (6) |
where corresponds to the mass of an unobserved particle, denote the energy and momentum of the beam respectively, and represent energies and momenta of two registered protons.
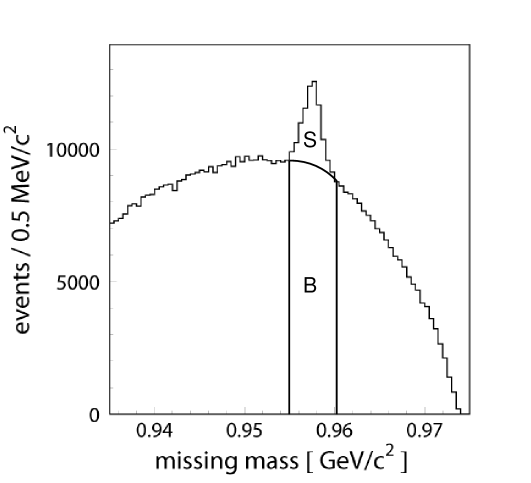
At present the experiment is still in preparation therefore as an example of the reconstructed missing mass distribution in Fig. 4 we show data derived from the COSY-11 measurement carried out at an excess energy of Q=15.5 MeV above the threshold for the meson production [48]. The number of events which correspond to the production of the meson is marked by the letter S, and the field of the slice under the peak correspond to the number of the background events marked by B. The background originates from the direct two, three and more pions production. It maybe treated as the upper limit for the expected background of the reaction. In the WASA-at-COSY experiment we expect a similar spectrum for the missing mass of the events. However, the signal to background ratio could be different due to the different mass resolution of the WASA-at-COSY detector. Additionally it will vary with the excess energy222Excess energy Q is a kinetic energy available in the reaction exit channel in the center-of-mass system.. Thereforee, in order to find an optimum beam momentum for the BR() determination the energy dependence (i) of the signal (), (ii) of the background (), (iii) of the missing mass resolution and (iv) of the detection efficiency has to be established. The upper limit of number of background events may be obtained from results achieved by the COSY-11 experiment (where one spectrum is shown in Fig. 4). A detailed description of the derivation of the dependence of S(Q) and B(Q) will be given in the next chapter.
Chapter 3 Conditions for the determination of the BR()
via the reaction chain
The number for all produced mesons (see eq. 3) can be determined from the known total cross section for the reaction [49, 50, 51, 52, 53, 54] and the luminosity which will be established by the measurement of the reaction with the well known cross section e.g. from elastic scattering of protons () [55].
When we assume that the relative statistical error of can be neglected due to large number of measured or events the formula for the relative error of the branching ratio is reduced to:
| (1) |
where denotes the statistical uncertainty of the signal. Assuming that the shape of the background is known the statistical error of the signal can be approximated as:
| (2) |
where indicates the number of all background events under the signal. Equation 2 was obtained under the assumption that the statistical errors propagate according to the formula [56]:
| (3) |
where the variables are independent and denotes their uncertainty. Thus the relative accuracy of the branching ratio can be expressed as:
| (4) |
The number of events where decayed into three pions which we expect to register with the WASA-at-COSY facility, can be expressed by the formula:
| (5) |
where is the luminosity which is expected to be around 1032 cm-2s-1, denotes the total cross section for the meson production which depends on the excess energy Q, is the supposed branching ratio for that decay, indicates the measurement time and representes the acceptance of the WASA-at-COSY detector for the measured reaction.
In the following section we will estimate the uncertainty of the branching ratio determination as a function of the excess energy and measurement time taking into account the energy resolution of the forward part of the WASA detector. To this end, in the following we will parametrize the energy dependence of the total cross section for the meson and for the multimeson production. Presented estimations of the multimeson production will allow to estimate an upper limit of the background for the decay. This is because it will be based on the missing mass distributions which includes also other pion channels like e.g. , , .
1 Parametrization of the total cross section for the meson production
In order to estimate the expected production rate of the meson given by formula (5) it is mandatory to know the total cross section for the production of this meson. From measurements of the COSY-11, DISTO and SPESIII [50, 51, 52, 53, 54] collaborations we have several experimental data points for the excess energy range from 1.3 MeV up to 150 MeV. The data are shown in Fig. 1, where it is clearly seen that near the threshold production of the meson depends strongly on the excess energy and hence this dependence must be taken into account.

Generally the production cross section can be described as an integral of the square of the production amplitude M over the phase space volume Vps using formula:
| (6) |
where F denotes the flux factor of the colliding particles. This energy dependence of the cross section can be written in a closed analitical form using the Fäldt and Wilkin model [57, 58] which takes into account the proton-proton Final State Interaction (FSI):
| (7) |
where and denotes the normalization constant, stands for the binding energy [57, 58], and the is the triangle function [59], defined as:
| (8) |
The free parameters and have to be established by fitting the function (7) to the experimental data. The estimation of these parameters and the fit was done in reference [60], and the obtained values amount to [48]:
Knowing the parametrization from (7) and having the values of the parameters we can compute the cross section for the meson production for excess energies near threshold. The result of the fit together with the experimental data is shown in Fig. 1.
2 Differential cross section for multimeson production
For the estimation of the background from the direct production in the missing mass spectrum of the ) reaction, expected to be observed by the WASA-at-COSY detector, we need to calculate the and the missing mass resolution ( of the WASA detector setup.
To our knowledge there are no data available on the invariant mass distributions or even on the total cross section for the production in the proton-proton reaction near the kinematical threshold of the meson production111 The total cross section of the reaction has been established experimentally only at three proton beam energis [61, 62, 63] (see App. 9).. Therefore, in order to estimate at least an upper limit of the differential cross section for the production we have taken the missing mass spectra of the reaction determined by the COSY-11 collaboration for several beam energies near threshold for the meson production [49, 50, 51, 52] (see e.g. Fig. 4). The differential cross section for the background was calculated according to the formula:
| (9) |
which was obtained by dividing NS(Q) and NB(Q) as given below.
The number of all measured events can be expressed as:
| (10) |
and the number of the measured background events can be approximated by:
| (11) |
where denotes the acceptance of the COSY-11 detector, which in a very good approximation depends only on the mass of the produced system and on the excess energy Q [64], indicates the luminosity, is the time of the measurement and denotes the range of the missing mass values around the signal which is approximated by:
| (12) |
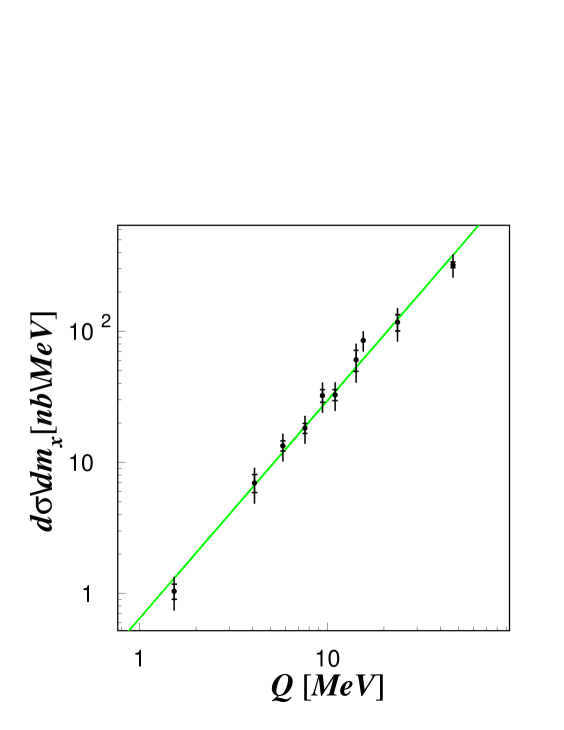
Figure 2 and Tab. 1 show values of the extracted from the experimental data [50, 51, 52] by means of formula 9.
| Q | |||
|---|---|---|---|
| 1.53 | 1.04 | 0.14 | 0.16 |
| 4.10 | 7.0 | 1.1 | 1.1 |
| 5.80 | 13.4 | 1.2 | 2.0 |
| 7.60 | 18.2 | 1.6 | 2.8 |
| 9.42 | 32.3 | 3.6 | 4.9 |
| 10.98 | 32.7 | 3.2 | 4.9 |
| 14.21 | 60 | 11 | 9.0 |
| 15.50 | 85 | 2.4 | 13 |
| 23.64 | 117 | 17 | 17 |
| 46.60 | 322 | 16 | 48 |
A good description of the data was obtained by the function of the form:
| (13) |
where and are free parameters which, for Q expressed in units of MeV, were estimated to be nb/MeV and [7, 73]. Therefore, conservatively the signal to background ratio for the WASA-at-COSY detector can be calculated using formula 9 by replacing by the WASA missing mass resolution, and by replacing the cross section by the product .
In order to understand the production mechanism of the system more precise studies are needed, because till now it did not receive a proper attention neither experimentally nor theoretically [7]. Therefore, we have conducted investigations by simulating the distributions for several production mechanisms and compared the results to the values of extracted from the experimental data. A more detailed description of these studies is presented in appendix 11.
3 Energy resolution of the Forward Detector
The last parameter needed to be calculated for the estimation of the background expected to be observed with WASA-at-COSY is the missing mass resolution which depends on the energy resolution of the Forward Detector.
The Forward Detector was previously used for studies of the protons from the reaction. It consists of plastic scintillator layers which measure the energy losses, and on their basis the kinetic energy of the particles can be reconstructed. The thickness of the detector was optimized for a measurement of protons with kinetic energies in the range from 100 to 550 MeV.

In order to study the production and decays of the meson an upgrade of the Forward Range Hodoscope was necessary, due to the higher background to signal ratio and higher energies of outgoing protons from the reaction (kinetic energy ranges from 300 to 800 MeV). The extension was done by removing one 11 cm thick layer and instead adding two new layers of 15 cm thickness each built out of cake-piece shaped plastic scintillators with a photomultiplier tube attached at the end [43]. At present the total thickness of FRH detector amounts to 63 cm, which enables to stop protons with kinetic energies up to 360 MeV. Thanks to the new layers the accuracy of the determination of proton energies was improved by about 25%. Fig. 3 shows the relative
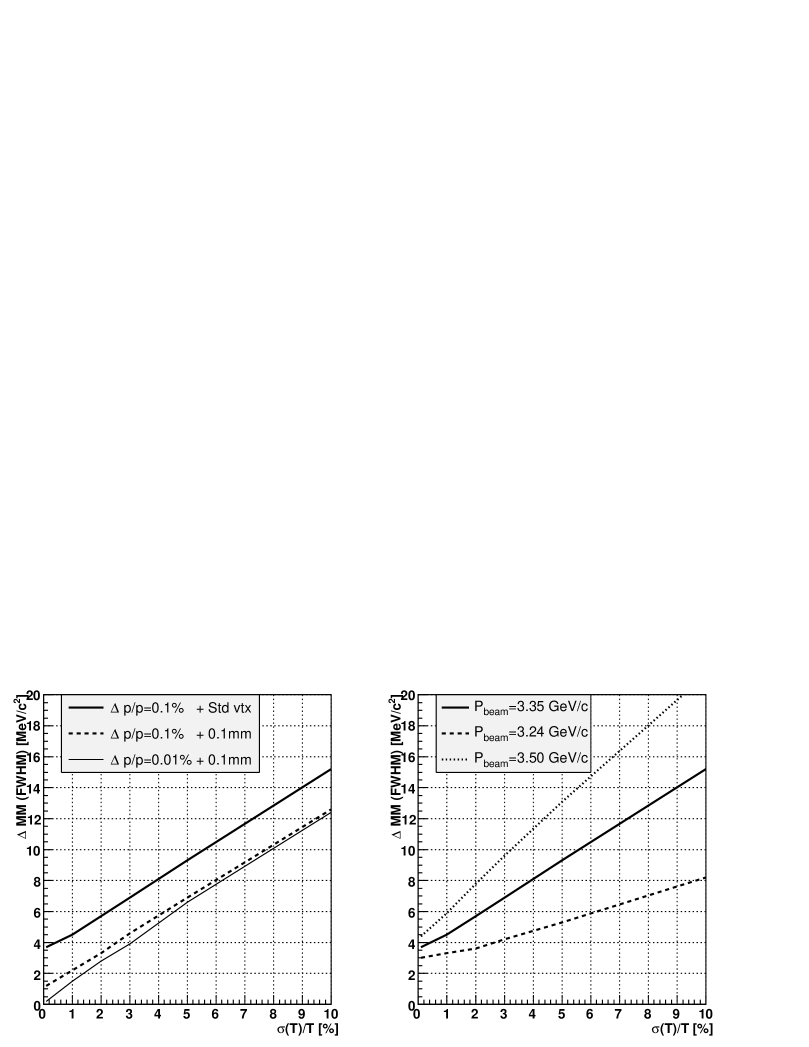
energy resolution of protons for different number of FRH planes. The accuracy of the energy reconstruction is a crucial point in the analysis. The systematical and statistical errors in the evaluations of branching ratios for the studied decay channels will strongly depend on the precision of the missing mass reconstruction, which in turn will depend on the precision of the reconstruction of the momenta of the forward emitted protons. The effective energy resolution of the newly assembled Forward Range Hodoscope is estimated to be about 3% for protons from the reaction, at a beam momentum of 3.35 GeV/c.
In order to investigate the missing mass resolution for the reaction we assumed that the COSY beam momentum spread is , perpendicular beam profiles: horizontaly =2 mm, vertical =5 mm [67] and the pellets are passing through the interaction point distributed homogeneously in a cylinder with a diameter of 2.5 mm. The result is presented in Fig. 4, where the width of the missing mass peak is plotted as a function of the relative resolution of the kinetic energy. It is seen that even in the case of a perfect energy resolution of the FRH the missing mass resolution amounts to about 4 MeV/c2. If we further assume a perfect interaction point (vertex) determination the contribution from the beam momentum spread is seen to be at the order of 1 MeV/c2. In the right panel of Fig. 4 the dependencies were plotted for three different beam energies: 3.24, 3.35 and 3.5 GeV/c from the near threshold production region. The broadening of the signal with increasing beam momentum is a kinematical effect due to the error propagation discussed in detail e.g. in reference [68].


Taking into account all effects which we mentioned above, the missing mass resolution can be parametrized as a function of excess energy and the kinetic energy resolution of forward detector by the following formula [69]:
| (14) |
This relation will be useful in the next section where the accuracy of the branching ratio determination as a function of excess energy will be calculated.
Additionally we have included the acceptance of the WASA-at-COSY apparatus for detecting the and channels. We have taken into account the geometrical acceptance of the central and the forward detector which for detecting the protons and pions covers the following ranges of the polar angle: , and . Furthermore the Final State Interaction (FSI) between outgoing protons was included using the square of the on-shell proton-proton scattering amplitude calculated according to the Cini-Fubini-Stanghellini formula including the Wong-Noyes Coulumb corrections [70, 71, 72] (for details see appendix 10). Fig. 5 indicates the excess energy dependence of the acceptance assuming that the phase space is homogeneously populated (solid line) and including the FSI between protons (dashed line).
4 Accuracy of the branching ratio determination
The direct three pion production and the decay will be disentangled by using the missing mass of the two outgoing protons measured in the forward detector. It is worth noting that in order to distinguish (on the base of a statistically significant sample of events) the direct and resonant multi-pion production it is mandatory first to select a sample of events with the studied final state channel (e.g. ) and then only for this selected sample to construct a distribution of the missing mass to the proton-proton system.
To estimate the accuracy of the BR() determination we have parametrized the total cross section for the meson production (eq. 7) and have etablished a parametrization for an upper limit of the background production (eq. 13). Further on, the missing mass resolution taking into account effects which are related to the energy resolution of the forward detector and
the beam and target spread (eq. 14) has been parametrized.
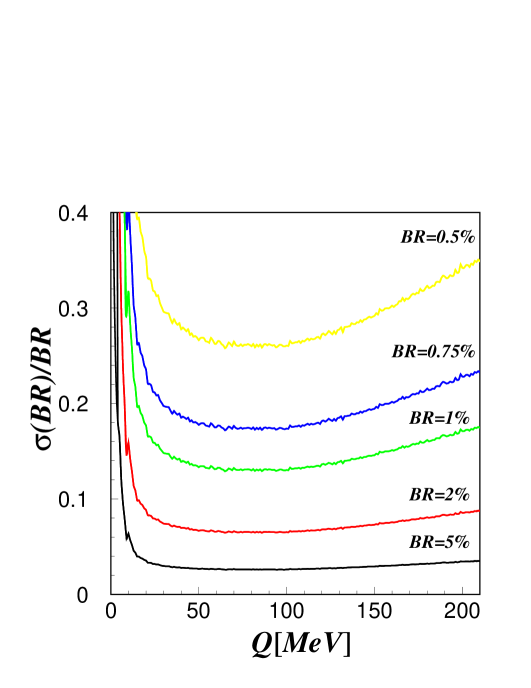
Applying these parametrizations and assuming five values of the BR(): 5%, 2%, 1%, 0.75% and 0.5% we have made calculations for the relative accuracy of the branching ratio determination. For the calculations we considered the range of values from the established upper limit of 5% down to 0.5%. Assuming for example that the measurement will last one week with a luminosity of L=1032cm-2s-1, we obtained the result shown in Fig. 6 where the relative error of the branching ratio is plotted as a function of the excess energy Q. We can see that the relative statistical error scales nearly with the value of the assumed branching ratio, and that the optimum accuracy is achieved for excess energies between 60 and 90 MeV independently of the BR magnitude. Relation (4) implies that the relative statistical error of the branching ratio determination will improve with time as , as it is shown in Fig. 7 (left) for a beam momentum of = 3.45 GeV/c corresponding to an excess energy of Q = 75 MeV. The plot shows that if the branching ratio was equal to 0.5% a relative accuracy of 10% would require two months of data taking [65].
Additionaly, for the case if the BR() is to small to be observed we have estimated the upper limit at a confidence level of 90% as a function of measurement time. The estimated upper limit of the branching ratio as a function of measurement time is shown in Fig. 7 (right).


We can see that e.g. a sensitivity of 0.001 can be reached after few weeks of data taking with the WASA-at-COSY detector. As it was pointed out the theoretical calculation based on the chiral unitary approach predicts the branching ratio af about 1% [19]. From the right panel of Fig. 7 we may infer that this prediction can be falsified or confirmed within a few days of beam time using the WASA-at-COSY detection setup.
It is worth to mention that an additional source of background, not discussed here, comes form other decays of the meson involving similar particles: and . This background cannot be suppressed using the missing mass method, yet it can be identified using reconstructed invariant masses of the decay products.
Chapter 4 The Time-of-Flight method
In order to study rare decays of the and mesons produced in the reaction using the WASA-at-COSY detection setup, one has to determine the four-momentum vectors of the decay products and of the forward scattered protons. At present the protons four-momentum vectors are derived only taking into account the energy loss measured in the Forward Detector. In this chapter we will present a possible future improvement of the momentum reconstruction using the time information from the scintillators of the Forward Detector [74, 75]. We will also describe the alghorithm which can be implemented to reconstruct the momentum of particles crossing the Forward Detector using time information obtained from the crossed detection layers.
1 Proposal of using the Forward Detector for a TOF method
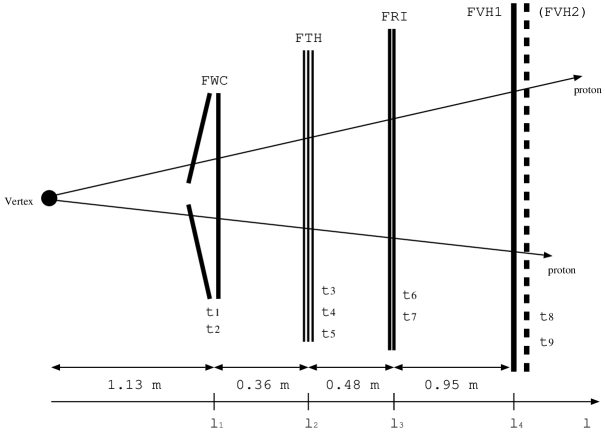
In order to measure time-of-flight (TOF) of charged particles emitted in forward direction we can use all scintillator detectors which are placed in the forward part of the WASA setup. But for the purpose of this thesis we will consider only the thin plastic scintillator detectors: Forward Window Counter, FWC (23 mm), Forward Trigger Hodoscope, FTH (35 mm), Forward Range Intermediate Hodoscope, FRI (25 mm), and the Forward Veto Hodoscope, FVH (20 mm). The five layer Forward Range Hodoscope can also be used to determine time, but it is made of scintillators which thickness ranges from 11 to 15 cm, and more precise studies of the light signal generation and propagation would be necessary for the usage of the time information.
Using only thin detectors, enables us to measure time in eight points on a distance of about 2.0 meters. But in practice one can combine the individual times measured in layers of each detector to obtain one time value per detector. Additionally the information about the trajectory of particles is needed to recontruct the time in the FWC, FTH and FRI counters, due to one side readout of the scintillating modules (only one photomultiplier). The direction of particles will be obtained from measuring tracks in the straw chambers (FPC). The FPC chambers are placed between the first two scintillator detectors - FWC and FTH. The material which they are made of is very thin, therefore we can neglect the particle energy losses in these layers.
The five layers of the Forward Range Hodoscope, FRH, are placed between FTH and FVH. Their total thickness amounts to 63 cm, therefore particles which travels through the FRH will be significantly slowed down. However, the deposited energy in the FRH layers is measured with good accuracy in the order of few per cent, and by combining the TOF information and the deposited energy one can reconstruct the initial velocity of the particle at the interaction point. Additionally the time signals will be measured by the FRI detector which is placed between the second and third layer of the range hodoscope.
Generally, taking into account the time information from thin scintillators and the energy loss from thick scintillators we can write that all information which will be measured is collected in eight independent values of time and five energy losses:
| (1) |
Using Monte-Carlo methods we can simulate the same quantities as from the experiment:
| (2) |
Therefore, in order to reconstruct the correct particle energy (which the particle had at the interaction point), we have to assume different true particle energies, and compare the Monte-Carlo predicted times and energy losses for each assumption with the measured qunatities until we find the optimum (most probable) value for the kinetic energy of the particle. A figure of merit in comparing this two samples could be a criterion. A more detailed description of the algorithm is given in section 6.
2 Description of the detectors used for the time measurement
In this section we will briefly describe the detectors relevant for the time measurement. The first detector which delivers time information on the way of the forward scattered particles is the Forward Window Counter (FWC) [37]. The light collection in the detector is optimized to keep the detection efficiency as homogeneous as possible over the full hodoscope area. The detector is 48-fold segmented and is composed of two layers á 24 elements made out of 3 mm plastic scintillator. The first layer is of conical shape whereas the elements of the second layer are assembled in a plane. The elements of the second plane are rotated by one half of a module (7.5o) with respect to the first layer. This geometry provides a complete coverage of the forward area without holes. In addition the 48-fold granularity coincides with the 48-fold granularity of the FTH.
We expect to achieve a time resolution for each layer in the order of (FWC) 200 ps. A schematic view of FWC is shown in the left panel of Fig. 2.
The next detector yielding time information on the way of the forward flying particles is the Forward Trigger Hodoscope (FTH). It consists of three scintillating layers which were renewed in the last year [42, 77]. Setup has a highly homogeneous detection efficiency and shows a fairly uniform behavior [42]. In case of using the FTH detector to measure time it is expected to achieve a resolution of about (FTH) 200 ps for each layer. The front view of the FTH detector is shown in the right panel of Fig. 2.
FRI is a thin scintillator hodoscope, designed to provide fast spatial and time information from inbetween the FRH. It consists of two layers of horizontal and vertical scintillator bars of 5 mm thickness each, and a maximum length of 1405 mm. Each bar is read out on one side via small and fast photomultiplier with light guides of fishtail type. The expected time resolution of the FRI is about (FTH) 300 ps. Schematic view of the FRI is shown on left panel of Fig. 3.
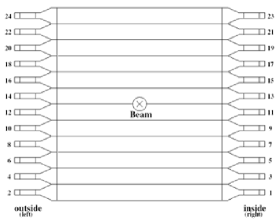
The last thin detector in the pathway of a forward scattered particle is the Forward Veto Hodoscope (FVH). The FVH is a veto detector build out of 12 horizontal scintillator bars which are read out on both sides (right panel of Fig. 3). The accuracy of a time measurement amounts to about 150 ps. In future it is planned to build a second veto detector with 20 modules placed vertically and readout by photomultipliyers on both sides. This detector will be optimized for the TOF measurment, and it will be placed about 80 cm down stream with respect to the first FVH [46].

By combining the time-of-flight method and presently used energy loss technique we expect to increase the momentum determination by a factor of about 1.5 and increase correspondingly the accuracy of particle identification. In order to estimate an expected improvement we have conducted Monte Carlo simulations of the reaction in the range of few tens of MeV above the threshold where the velocity of outgoing protons is around . The determination of the kinetic energy of protons from energy loss will at best be possible with a fractional resolution of =3%, which is equivalent to a relative momentum resolution of (see App. C):
| (3) |
The determination of the time-of-flight in vacuum would lead to a fractional resolution of the momentum reconstruction expressed by the following formula:
| (4) |
Thus, from the above anticipated resolution of about 150 ps for FWC and FVH counters even with this two detectors, one could obtain a fractional momentum resolution of = 3%. But this is only a conservative limit of the expected improvement since the particles will be slowed down in the FRH and the time will be measured by more detectors.
3 Fractional energy resolution from the TOF measurement
To check the posibility of energy reconstruction from the time-of-flight method we have performed studies of fractional energy resolution as a function of the kinetic energy and kinetic energy as a function of time-of-flight between start and stop detectors. We have simulated homogeneously in the phase space the reaction using the GENBOD [78] procedure with a nominal beam momentum of GeV/c without taking into account any beam spread.

To calculuate the kinetic energy as a function of the time-of-flight we used only two detectors here: the FWC as start counter and the FVH as stop counter, which are about 2 m apart (see Fig 1). The energy loss in the detector material of FD was calculated using the Bethe-Bloch formula [79], which for plastic scintillators and protons in the kinetic energy range from 200 to 830 can be approximated by [8]:
| (5) |
where the factor was calculated [69] from the experimental data [80].
The time-of-flight between the start and stop detectors was calculated iteratively using numerical Monte-Carlo techniques. Technically for each proton flying through the detector the time-of-flight was derived by summing very small time intervals for passing a distance on which the changes of the ionization power () can be neglected:
| (6) |
The plot in Fig. 4 shows the time-of-flight calculated as a function of the proton kinetic energy. We can see that with decreasing energy the time-of-flight between the start and stop couters increases. And for particles which have an energy smaller then 360 MeV the time-of-flight cannot be established because they do not reach the stop counter.
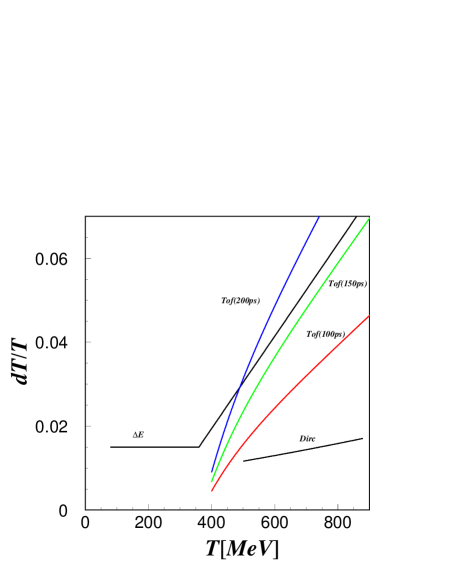
Another possible improvement of the energy measurement of the forward emitted particles assumes the installation of a DIRC detector which would enable to determine the velocity of protons [81, 82]. Therefore, in the following we will compare the missing mass resolution obtained using the energy loss method with the resolution expected when using the time-of-flight method and also with the resolution achievable when using a DIRC counter.
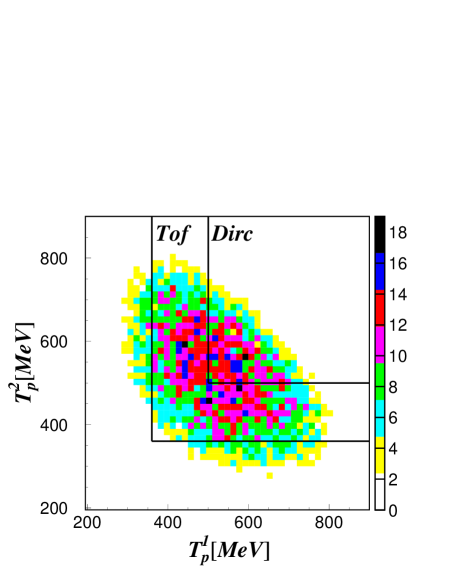
For the comparison we expressed the properties of time-of-flight technique, DIRC and energy loss method in terms of fractional kinetic energy resolution. The result is shown in the left panel of Fig. 5, it indicates that both DIRC and time-of-flight can yield better resolution than that obtained from energy loss only. However, for the estimation of the missing mass resolution it must be taken into account that the TOF method can be used for protons which passed the whole detector with an energy T 360 MeV, whereas the DIRC can deliver signals only for protons above the Cerenkov threshold which corresponds to 500 MeV [81]. This implies that only a fraction of protons (see right panel of Fig. 5) can be reconstructed by means of these two methods. The right panel of Fig. 5 illustrates that the energy of both protons can be reconstructed for only about 20% of events using the DIRC detector, and for about 70% of events using time-of-flight method. In other cases the energy of either one or both protons must be determineted using energy loss technique.
4 Accuracy of the missing mass reconstruction
For a rough estimation of a missing mass accuracy we have assumed that we will measure the time only with the FWC and FVH but to account for the fact that in reality we will use much more detectors we assumed the precision of ps. Further more we have included the geometrical acceptance of the WASA Forward Detector for particles emitted in the forward direction, which is: . The simulation did not include contributions due to a finite interaction region and the momentum spread of the COSY beam, since we focused on the comparison of the resolution resulting from the reconstruction of the proton four-momenta by the discussed methods.
In order to calculate the missing mass distributions we have simulated proton four-momenta using an event generator based on GENBOD [78], which produces particle four-momenta in the CM-frame homogeneously distriuted in phase space. These particle four-momenta were then boosted into the lab-system by means of a Lorentz transformation. To reproduce the missing mass as measured in the experiment we then smeared the kinetic energy of the simulated protons applying the known energy resolutions for each of the studies reconstruction methods. Next using the calculated four-momenta of protons the mass of an unobserved particle was calculated according to the equation:
| (7) |
In Fig. 6 the missing mass distributions for each method are shown. The left plot shows the result obtained using energy loss technique, middle plot corresponds to the DIRC technique and right to the time-of-flight method.
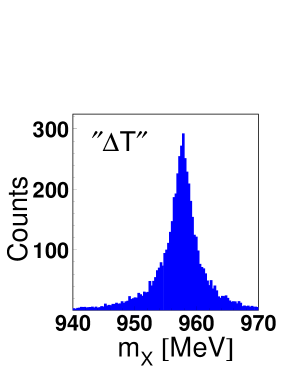
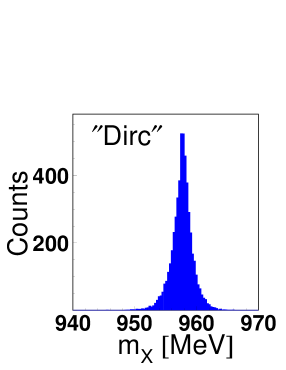
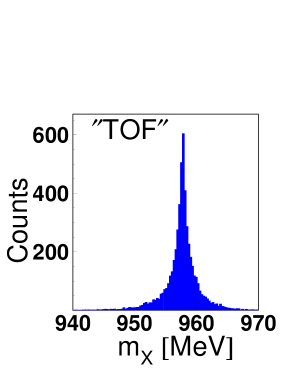
The simulations for the time-of-flight method and DIRC detector shows that the resolution of the missing mass reconstruction can be significantly improved in comparison to the results obtained when using only energy loss information.
5 Influence of the passive material on a precision of the energy determination
New layers of the Forward Range Hodoscope (FRH 4 and 5) are placed in thin 8 mm plexi glass shield, to keep all scintillators modules in the correct position and to protect them against any mechanical damage. This material is not used in the measurement and we do not have information about the energy loss in this layers. We expect that in the 32 mm (4 8mm) of the dead material the average energy loss will be about 10 MeV, and that the spread of this energy loss will be in order of 1 MeV or less. In order to estimate the scale of the effect we have conducted a simulations of a kinetic energy dependence of protons flying trought the Forward Detector as a function of the time-of-flight. In calculations we assumed a four different values for the error in calculating energy losses in the passive material: = 1 MeV, 2 MeV, 4 MeV, 10 MeV. The proton energy as a function of the time-of-flight for the assumed error is plotted in Fig. 7, where it is compared to the nominal dependence. We expect an error to be less then 1 MeV, however for the better visualization of the effect a much larger range was studied.
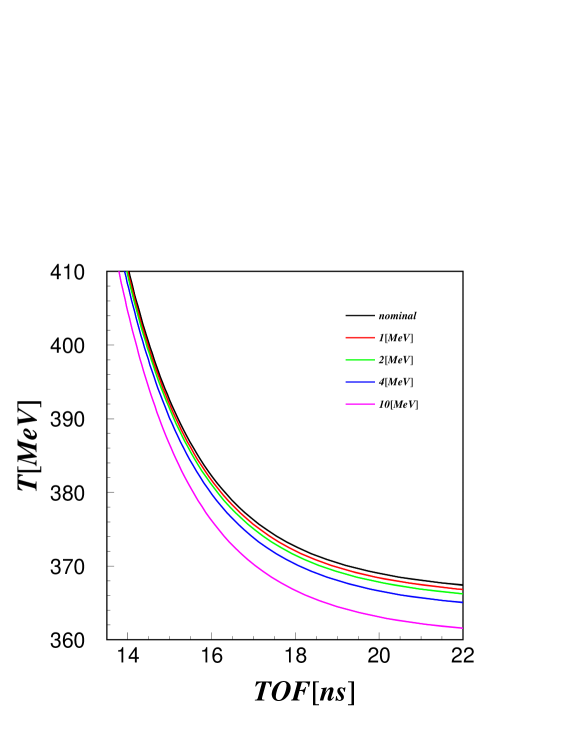
One can see from Fig. 7 that the inaccuracy of the energy loss determination of about 1 MeV will cause the error of kinetic energy determination in the order of fraction of MeV. Therefore we can neglect this influence of the passive material on energy reconstruction.
6 Computational algorithm for the reconstruction of particle momenta based on time signals in the Forward Detector
In this section we will present the scheme of the algorithm developed for the reconstruction of particle energy which is based on time and energy losses measured in the Forward Detector. For the sake of simplicity further on we will consider only average times measured in each detector, and we will assume for simplicity that energy loss occurs in one solid block of scintillating material between the FTH and FRI and another block between FRI and FVH detectors, as shown in Fig. 8. The simplification is made having in mind that in general every detection plane can be treated as a separate detection unit, and that the derived equations can be easily generalized for more detection planes.
In such case each event is characterized by a set of two values of energy loss measured in the FRH scintillation layers, namely:
| (8) |
and time information from four thin scintillators (FWC, FTH, FRI, FVH):
| (9) |

The measured times can be expressed as a function of three parameters:
| (10) |
where denotes the particle energy after i-th detector, denotes the length of the particle trajectory between the two detectors, and indicates the energy loss between (i-1)-th and i-th time counter.
Therefore we can calculate for each event a time using following equations:
| (11) |
| (12) |
| (13) |
| (14) |
where denotes the initial velocity of the particle.
Having measured we can calculate the time in which particles pass a thick detector numerically. E.g. for the the formula reads:
| (15) |
In order to reconstruct the true particle energy which it had at the interaction point we compare simulated times with the measured times . For the comparison we can construct the according to the method of least squares:
| (16) |
where, indicates the resolution of the time mesurement in the i-th counter. One can, treat as a free parameter, and determine the value of the particle energy when reaches a minimum. To optimize the algorithm we may in practice scan the value of in the range of uncertainty around the value established based on the energy loss method only, and using one of the minimalizing methods as e.g. the bisection method.
The proposed method of particle identification using time signals, can be generalized for usage with real number of scintillator layers of the WASA-at-COSY detection setup.
Chapter 5 Summary and conclusions
This thesis aimed at the estimation of the feasibility to study the branching ratio for the decay with the WASA-at-COSY detector. By measuring this isospin violating decay it is possible to derive the mass difference between the and quarks. This in combination with the ratios of the light quarks masses, can be used to derive the absolute value of quark masses, which cannot be observed directly.
In order to established the optimum beam momentum for conducting the experiments with WASA-at-COSY setup we performed Monte-Carlo simulations taking into account the energy dependence of the signal and the background as well as the missing mass resolution and the detection efficiency. For the calculations we considered a range of values from the established upper limit of 5% down to a value by one order of magnitude lower (0.5%). As a result we found that the best accuracy for the measurement of the BR() with the WASA-at-COSY detector is achieved when the meson is produced with an excess energy in the range between 60 and 90 MeV corresponding to beam momenta ranging from 3.4 - 3.55 GeV/c.
Further on we investigated the branching ratio uncertainty as a function of measurement time for one value of excess energy (Q = 75 MeV). As a result we can conclude that if the BR() was equal to 1% as predicted based on the chiral unitary approuch [19] we would need five weeks of beamtime with a luminosity of 1032 cm-2 s-1 in order to determine the branching ratio with an accuracy of 5%. We have established also the sensitivity for the estimation of the upper limit of the BR() in the case of no signal. We found that an upper limit on the branching ratio of 0.001 can be set on a confidence level of 90% after one month of beam time.
Because there are no available data on the production in collisions of protons near the kinematical threshold for the meson production, we have used the COSY-11 data on the reaction and established an upper limit for the background, expected to be observed with WASA-at-COSY detector. Using the missing mass spectra for the reaction for several excess energies, the differential cross sections for the multimeson production was calculated. For further usage the excitation function was parametrized as a . By that means we can compute the values of the expected background as a function of the excess energy near the meson threshold.
In the second part of the thesis we have proposed a possible improvement of the energy reconstruction of forward scattered protons using the time measured in the scintillator counters of the forward part of the WASA-at-COSY detector.
The missing mass resolution based on a time-of-flight measurement was investigated and it was presented that it is similar to the resolution achievable with the energy loss method. Thus, combining this two independent techniques we expect to improve the missing mass resolution by about a factor of 1.5. We also have presented the basic concept of an algorithm which will enable to determine the energy of particles based on the time-of-flight technique. In the near future we plan to implement the established algorithm in the WASA analysis software.
Chapter 6 as a member of the SU(3) pseudoscalar meson nonet
According to the quark model each (pseudoscalar) meson is a state of a quark and antiquark system. The three lightes quarks , and , give nine possible combinations. In terms of the SU(3) symmetry we can write this as:
| (1) |
which includes an octet and a singlet. All possible meson states can be presented as a multiplet on a plot where the horizontal axis denotes the third component of the isospin - and on the vertical axis the strangness - S is shown. Figure 1 presents a multiplet of the pseudoscalar mesons.
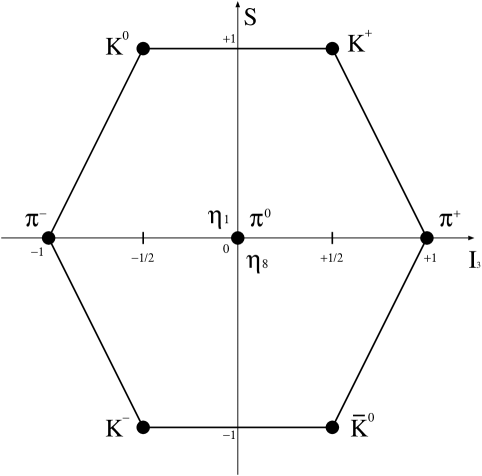
In this picture we have pions: , kaons: , and , and and .
The and meson are not pure states of the SU(3) pseudoscalar nonet but a combination of a singlet and octet . The quark model give as wave functions for the pure states:
| (2) |
| (3) |
and from them the wave functions for physicaly observed states are constructed as:
| (4) |
| (5) |
where [83] denotes the mixing angle which was established experimentally. Using equation (4), (5) and the value of the mixing angle we obtain [84]:
| (6) |
| (7) |
Both wave functions above are very similar and therefore the mass of these two mesons should in practice be also similar. However, the empirical mass of the meson is about two times larger than the mass of the meson.
Chapter 7 The missing mass technique
The missing mass technique is used to identify the particles which cannot be registered by the detectors due to short life time. We study the production of the meson via the reaction where X denotes the unobserved particle. If we determine the four-momenta of all protons before and after the collision, the four-momentum conservation gives the relation:
| (1) |
where corresponds to the four-momentum of the unobserved particle.
The mass can be calculated from (1) as:
| (2) |
with we can write:
| (3) |
Using the formula above we can calculate the mass of the unobserved particle assuming that we can determine the four-momenta for all other particles participating in the reaction.
In the laboratory where the proton beam collides with the hadrogen target the momentum of target is and energy is equal to the mass. Therefore in the laboratory system relation (3) can be written as:
| (4) |
Chapter 8 Relation between the fractional momentum resolution
and the fractional time-of-flight accuracy
To calculate the fractional momentum resolution related to the time-of-flight fractional resolution we use the formula for the momentum:
| (1) |
where denots the relativistic Lorentz factor
| (2) |
and indicates the velocity of the particle:
| (3) |
with being the distance for the time-of-flight measurement. Inserting the (2) and (3) to (1) we get:
| (4) |
The standard deviation of the momentum distribution as a function of time resolution can be obtained by differentiating equation (4):
| (5) |
Applaying the relations , and in eq. (5) we obtain a relation between the fractional momentum resolution and the fractional time-of-flight accuracy:
| (6) |
Further on, we will derive the relation between the fractional momentum resolution and the fractional energy resolution. By differentiating we obtain:
| (7) |
and thus we can write:
| (8) |
From formula (8) we can also estimate the relation of the fractional momentum resolution as a function of the fractional kinetic energy resolution. The total energy is given by and by differentiating we can write: , due to constant mass. Therefore we have:
| (9) |
By further transformations we obtain:
| (10) |
| (11) |
Finally the fractional momentum resolution as a function of fractional kinetic energy resolution reads:
| (12) |
Chapter 9 Parametrization of the total cross section
The production process of three pions is not well known. Only a few experimental data points exist for the total cross section and the dynamics of the process is still not well understood [7]. Therefore, for the estimation of the excitation function we have used a parametrization proposed by J. Bystricky [85] which is based on the expansion of the total cross section in a base of the generalized Laguerre polynomials.
One can expressed the total cross section using the effective amplitude:
| (1) |
where the amplitude can be expanded into series of orthonormal functions :
| (2) |
with
| (3) |

where denote the generealized Laguerre polynomials:
| (4) |
We put
| (5) |
where is the beam kinetic energy at the reaction threshold, and is a constant, determining the scale of .
One can see that the parametrization of the total cross section is in good agreement with the available experimental ponits for the three pion production. Considering now the production of the , mesons we can see that in the case of the meson the total cross section for the direct production of three pions increases by a factor of about 700 when going form to production threshold.
The direct three pion production will constitute the major ingredient of the background. We have plotted the total cross section of the three pion production using the introduced parametrization and compared it to the experimental points with a parametrization of the total cross section for the meson production. One can see that the cross section for the background production is three orders of magnitude larger then the cross section for the prodcution of the investigated meson, making the study of the decay experimentally challenging.
Chapter 10 Parametrization of the proton-proton Final State Interaction
This appendix was prepared on the basis of references [86]. The final state interaction between two protons in the exit channel of the reaction is a well known fact, and had achieved a good theoretical description. In order to include this interaction in our calculations we had considered three possible models of the pp-FSI enhancement factors described in [86].
The first model uses the square of the on-shell proton-proton scattering amplitude, which for the relative angular momentum reads [87]:
| (1) |
where indicates the momentum of both proton in the center of mass system of the colliding particles, denotes the phase shift, is the Coulomb penetration factor which includes the Coulomb interaction between two protons. This factor can be defined as [88, 89]:
| (2) |
where indicates the relativistic Coulomb parameter, with being the fine structure constant and the proton velocity in the rest system of other proton.
The phase shift is calculated using the Cini-Fubini-Stanghellini formula, including the Wong-Noyes Coulomb corrections [71]:
| (3) |
where [88]:
| (4) |
fm denotes the scattering length and fm is the effective range. The parameters fm3 and fm2 are related to the shape of the nuclear potential, and were calculated from the pion-nucleon coupling constant [70]. Finally, the square of the proton-proton scattering amplitude can be expressed as:
| (5) |
As a second possibility, for the pp-FSI parametrization we have approximated the enhancement factor by the inverse of the squared Jost function [90]:
| (6) |
where for a short ranged interaction, by applaying the effective range expansion to order we have:
| (7) |
with
| (8) |
Equation 7 is true in presence of the long-ranged Coulumb force.
To include the possible dynamics of the three pion production along with the theoretical prediction, we had assumed that the production can proceed via the excitation of and resonances according o the reaction chain:
where decays into and into . A corresponding Feynman diagram could then have a form as shown in figure 1.
The mechanism had been applied by using the relativistic Breite-Wigner form for the probability of the accuring of the invariant mass:
| (9) |
where the and denote the width and mass of the resonance, respectively, and the indicates the invariant mass of the proton-pion subsystem. An analogous formula was used for the and resonance.
Chapter 11 Dynamics of the production in proton-proton interaction
With a 4 facilities such as WASA, aiming at measurements of decays of and produced in interactions, the understanding of the reaction dynamics becomes very important as they constitute a severe background for studies of and decays into three pions. However, for more than fourty years there were only three experimental data points available for the cross section of and reactions, all coming from bubble chamber experiments [61, 63, 62]. Only recently the data base has been extended by measurements of the and reactions cross sections near the threshold by the CELSIUS/WASA collaboration [2]. For the remaining reactions there are no data in that energy region. As a consequanece the understanding of the mechanism of the production is by far not satisfactory [7]. Therefore, in order to gain more information of the dynamics of this process we have compared the empirical energy dependence with results of simulations conducted under various assumptions as regarding the interaction among the final state particles. The direct production should proceed by an excitation of one or two baryon resonances followed by the subsequent decays [91]. Therefore we have tested two possibilities assuming for the primary production a pure phase space distribution and as a second possibility we considered the resonant production via the reaction chain. The result of the simulations are confronted with the data in figure 1.
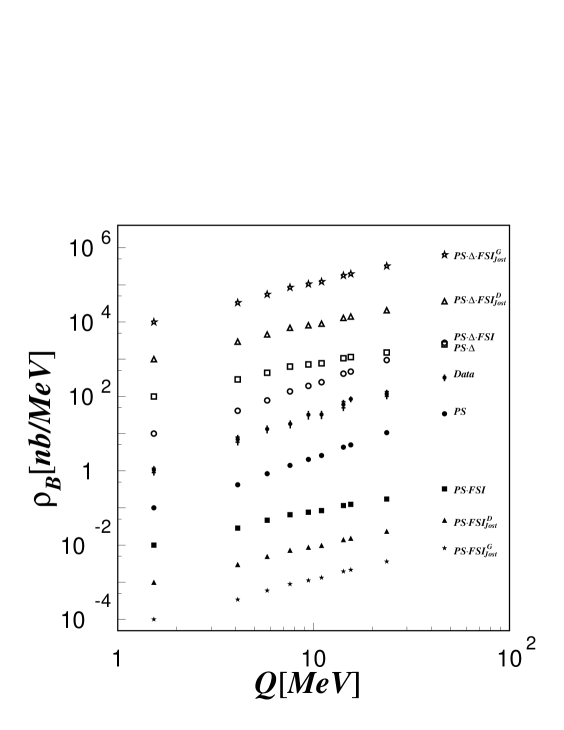
(i) Phase Space - empty stars
(ii) Phase Space - empty triangles
(iii) Phase Space - empty squares
(iv) Phase Space - empty circles
(v) Phase Space - data points
(vi) Phase Space - full circles
(vii) Phase Space - full squares
(viii) Phase Space - full triangles
(ix) Phase Space - full stars
Assuming the Watson-Migdal ansatz, we factorize the proton-proton FSI and the production amplitude. We have considered three possible parametrizations of the pp-FSI enhancement factors which are described in detail in reference [86] and in the appendix 10 of this thesis. As a first possibility for the proton-proton enhancement factor we use the square of the on-shell proton-proton scattering amplitude calculated according to the Cini-Fubini-Stanghellini formula including the Wong-Noyes Coulomb corrections [70, 71, 72]. As a second possibility, we approximated the enhancement factor by the inverse of the squared Jost function (JostD) derived by Druzhinin et al [90], and finally we used also the inverse of the squared Jost function (JostG), calculated according to the formulae of Goldberger and Watson [92]. Figure 1 indicates that the excess energy dependence of can be reproduced equally well assuming that the phase space is homegeneously populated or assuming that the reaction proceeds via resonances: . However, it is evident from the figure that inclusion of the FSI inhancement factors as derived for the three body final state worsens significantly the consistency with the data.
Chapter 12 Description of computer programs used for simulations
Simulations were performed using the FORTRAN and C language programs with additional libraries from the CERNLIB package. Here only a brief description of the programs is shown without details.
All programs were using GENBOD phase space generator subroutines [78], which on basis of the total energy in the center of mass of two colliding particles and the masses of the outgoing particles, returns the four-momenta of all particles in the exit channel. Each generated event is weighted with the WT0 parameter which ensures that the particles are homogeneneously distributed in the phase space. The output four-momenta are given in the center of mass system, thus it is needed to transform them to the laboratory reference frame using the Lorentz transformation.
In most cases the input parameters (beam momentum, total energy in the CM frame, number of outgoing particles, mass of particles) for all programs were read from a special input file. This method prevented from compiling the code each time, when the values of parameters changed.
In order to check whether the generated events fulfill the detection conditions we have implemented constrains of geometrical acceptance of the detector setup.
The interaction of protons in the final state (FSI) and the production dynamics was included according to formulae introduced in appendix 10. To take into account these effects we have weighted each generated event by the sqaure of the proton-proton elastic scattering amplitude or a square of the Breit-Wigner amplitude ():
| (1) |
As output of the programs in most cases an .hbook and an ASCI files was produced. The first one contains histograms which can be directly ploted by PAW analyzing program [93] and the second type of file can be used in further analysis, for example as an imput file to another program.
”I never did a day’s work in my life. It was all fun.”
Thomas Alva Edison (1847 – 1931)
Acknowledgment
I would like to take the opportunity to thank everybody who helped me during writting of this thesis.
My first words I would like to direct to Prof. dr hab. Paweł Moskal - a person without whom, this thesis would never be acomplished. He had gave me a great possibility of studing and investigating an interesting world of hadron and meson physics together with the COSY-11 and WASA-at-COSY groups. I would like to thank you Pawe for guiding and encouraging me in daily work, for an infinite patience in correcting subsequent versions of this thesis. I am also indebt for hours of very interesting discussions, not only on physics. And I wish to thank you for the hospitality during my stays in Jülich and for many excursions.
I am greatly indebted to Dr Andrzej Kupść for patience in answering my questions, for many valuable suggestions, for teaching me basics of ROOT, WASA-MC and RootSorter, and for perusal of the early version of this thesis. Also for hospitality during my stays in Uppsala.
I am grateful to Prof. dr hab. Walter Oelert for reading and correcting this thesis, and for support of my stays in Jülich and Uppsala.
I would like to thank Prof. dr hab. Bogusaw Kamys for letting me work in the Nuclear Physisc Division of the Jagiellonian University, financial support of my stays in Jülich and for valuable remarks during our thursday meetings.
Many thanks are due to Prof. dr hab. James Ritman for support of my activities in the Research Center Jülich.
I am also grateful to Prof. dr hab. Lucjan Jarczyk for many valuable suggestions on meson physics and topics considered in this thesis.
I would like to thank Dr Dieter Grzonka for proofreading of this thesis and for valuable suggestions.
I wish to thank to Dr Christian Pauly for reading a part of the manuscript, for corrections and pertinent suggestions.
I would like to thank Dr Magnus Wolke for making it possible to carry out this work within the WASA-at-COSY Collaboration.
Many thanks are due to Master of Science Jarosław J. Zdebik for his support during the last two years, a lot of discussions, coffees, and for nice atmosphere during the daily work. He has always been there when I needed him.
I am greatly indebt to Master of Science Joanna Przerwa and Master of Science Paweł Klaja for their hospitality and care during my stays in Jülich, for many coffees, tasty cakes and interesting discussions.
I would like also to thank Wojciech Krzyżyk for reading a part of the manuscript and looking into it with an eye of ”non-physicist”, for great support and many discussions.
I do wish to thank: Master of Science Dagmara Rozpędzik, Master of Science Barbara Rejdych, Master of Science Małgorzata Hodana, Dr Rafał Czyżykiewicz, Master of Science Eryk Czerwiński, Ewelina Czaicka, Jakub Bożek, and Michał Silarski for a nice atmosphere during the daily work in Cracow and Jülich.
On the personal side, I would like also to thank cordially my parents and sister, they had always been entirely supportive during my studies.
Last but not least, I would like to thank cordially Katarzyna Słoka for care and big support during last years.
References
- [1] H.-H. Adam et al., Proposal for the Wide Angle Shower Apparatus (WASA) at COSY-Juelich - WASA-at-COSY, 2004, e-Print: nucl-ex/0411038.
- [2] C. Pauly et al., Phys. Lett. B 649 (2007) 122, e-Print: nucl-ex/0602006.
- [3] A. Kupść, AIP Conf. Proc. 950 (2007) 165, e-Print: arXiv:0709.0603 [nucl-ex].
- [4] A. Rittenberg, Properties of the eta prime meson, LBNL (1969), UCRL-18863, http://repositories.cdlib.org/lbnl/UCRL-18863.
- [5] D. Gross, S. B. Treiman, F. Wilczek, Phys. Rev. D 19 (1979) 2188.
- [6] H. Leutwyler, Phys. Lett. B 378 (1996) 313.
- [7] A. Kupść, P. Moskal, M. Zieliński, MENU 2007, e-Conf. Proc. arXiv:0803.2673 [nucl-ex] (2008).
- [8] Particle Data Group, W. M. Yao, et al., J. Phys. G 33, (2006) 1.
- [9] A. Kupść, Uppsala University, Sweden, private communication (2007).
- [10] D. Sutherland, Phys. Lett. 23 (1966) 284.
- [11] J. Bell, D. Sutherland, Nucl. Phys. B 4 (1968) 315.
- [12] W. A. Bardeen et. al., Phys. Rev. Lett. 18 (1967) 1170.
- [13] J. Gasser, H. Leutwyler, Nucl. Phys. B 250 (1985) 539.
- [14] J. Kambor, et al., Nucl. Phys. B 465 (1996) 215.
- [15] A. Anisovich and H. Lutewyler, Phys. Lett. B 375 (1996) 335.
- [16] R. Dashen, Phys. Rev. 183 (1969) 1245.
- [17] B. Martemyanov and V. Sopov, Phys. Rev D 71 (2005) 017501.
- [18] J. Gasser, H. Leutwyler, Rev. Sec. of Phys. Lett. 87 (1982) 77.
- [19] B. Borasoy et al., Phys. Lett. B 643 (2006) 41.
- [20] B. Borasoy et al., AIP Conf. Proc. 950 (2007) 180.
-
[21]
E. Czerwiński and P. Moskal, AIP Conf. Proc. 950 (2007) 89;
E. Czerwiński, P. Moskal, D. Grzonka, A. Budzanowski, R. Czyżykiewicz, D. Gil, M. Janusz, L. Jarczyk, B. Kamys, A. Khoukaz, P. Klaja, W. Oelert, C. Piskor-Ignatowicz, J. Przerwa, B. Rejdych, J. Ritman, T. Sefzick, M. Siemaszko, M. Silarski, J. Smyrski, A. Täschner, M. Wolke, P. Wüstner, M. Zieliński, W. Zipper, Proc. of the XII Hadron, Frascati Physics Series, Volume XLVI (2008). - [22] R. Maier, Nucl. Instr. & Meth. A 390 (1997) 1.
- [23] D. Prasuhn, et al., Nucl. Inst. & Meth. A 441 (2000) 167.
- [24] S. Barsov et al., Nucl. Inst. & Meth. A 462 (2001) 364.
- [25] A. Böhm et al., Nucl. Inst. & Meth. A 443 (2000) 238.
- [26] S. Brauksiepe et al., Nucl. Inst. & Meth. A 376 (1996) 397.
- [27] R. Barna, K. Pysz et al., Nucl. Instr. & Meth. A 519, (2004) 610.
-
[28]
H. Stockhorst,
Proc. of the Symposium on Threshold Meson Production in pp and pd
Interaction, Institute of Physics, Jagellonian University,
Cracow, 20 – 24 June 2001;
H. Stockhorst et. al., AIP Conf. Proc. 950 (2007) 239. - [29] Chr. Bargholtz et al., e-Print: arXiv:0803.2657 [nucl-ex] (2008).
- [30] R. Bilger et al., Nucl. Phys. A 626, (1997) 93c.
- [31] B. Trostell, Nucl. Instr. & Meth. A 362 (1995) 41.
- [32] C. Ekström et al., Nucl. Instr. & Meth. A 371 (1996) 572.
- [33] A. Winnemoeller et al., FZJ IKP Ann. Rep. 2007, Jülich, Germany, Jül-4262 (2008).
- [34] U. Schuberth, Ph. D. Thesis, Uppsala University, Uppsala (1995).
-
[35]
B. R. Jany, Diploma Thesis, Jagiellonian University, Cracow (2006),
e-Print: physics/0606110. -
[36]
M. Jacewicz, Ph. D. Thesis, Uppsala University, Uppsala (2004);
P. Podkopa, FZJ IKP Ann. Rep. 2007, Jülich, Germany, Jül-4262 (2008). - [37] A. Pricking et al., FZJ IKP Ann. Rep. 2007, Jülich, Germany, Jül-4262 (2008).
- [38] J. Dyring, Ph. D. Thesis, Uppsala University, Uppsala (1997).
- [39] M. Janusz et al., FZJ IKP Ann. Rep. 2007, Jülich, Germany, Jül-4262 (2008).
- [40] M. Dahmen et al., Nucl. Inst. Meth. Phys. Res. A 348 (1994) 97.
- [41] M. Waters, Ph. D. Thesis, Forschungszentrum Jülich (1994).
- [42] C. Pauly, FZJ IKP Ann. Rep. 2007, Jülich, Germany, Jül-4262 (2008).
- [43] H. Calén, E. Czerwiński, D. Duniec, K. Fransson, A. Heczko, P. Klaja, A. Kupść, A. Malarz, W. Migdał, P. Moskal, A. Nawrot, N. Paul, C. Pauly, J. Przerwa, A. Pricking, M. Zieliński, FZJ IKP Ann. Rep. 2006, Jülich, Germany, Jül-4243 (2007) 35.
- [44] C. Pauly et al., Nucl. Instrum. Meth. Phys. Res. A 547 (2005) 294.
- [45] W. Brodowski, Ph. D. Thesis, Tübingen University (1995).
- [46] M. Bashkanov, Tübingen University, Germany, private communication (2008).
- [47] J. Złomańczuk, WASA internal Note (2006).
- [48] P. Moskal et al., Int. J. Mod. Phys. 22 (2007) 305.
- [49] P. Moskal, e-Print: hep-ph/0408162.
- [50] A. Khoukaz et al., Eur. Phys. J. A 20 (2004) 344.
- [51] P. Moskal et al., Phys. Rev. Lett. 80 (1998) 3202.
- [52] P. Moskal et al., Phys. Lett. B 474 (2000) 416.
- [53] F. Hibou et al., Phys. Lett. B 438 (1998) 41.
- [54] F. Balestra et al., Phys. Lett. B 491 (2000) 29.
- [55] D. Albers et al., Phys. Rev. Lett. 78 (1997) 1652.
-
[56]
W. T. Eadie, et al., Statistical methods in experimental physics, North-Holland Publishing Company,
London (1971);
B. Kamys, Lecture form statistical methods in physics, (2005)
http://users.uj.edu.pl/ufkamys/BK/bb_zakladki.pdf - [57] G. Fäldt and C. Wilkin, Phys. Lett. B 382 (1996) 209.
- [58] G. Fäldt and C. Wilkin, Phys. Rev. C 56 (1997) 2067.
- [59] E. Byckling, K. Kajantie, ”Particle Kinematics”, John Wiley & Sons, New York (1973).
-
[60]
E. Czerwiński, Diploma Thesis, Jagiellonian University, Cracow (2006)
http://ikpe1101.ikp.kfa-juelich.de/cosy-11/pub/thesis_DP_
Czerwinski/dipl.erykczerwinski.pdf. - [61] E. Pickup et al., Phys. Rev. 125 (1962) 2091.
- [62] E. L. Hart et al., Phys. Rev. 126 (1962) 747.
- [63] A. M. Eisner et al., Phys. Rev. 138 (1965) B670.
- [64] P. Moskal et al., J. Phys. G 32 (2006) 629.
- [65] M. Zieliński, P. Moskal, A. Kupść, FZJ IKP Ann. Rep. 2007, Jülich, Germany, Jül-4262 (2008).
- [66] H. Calén, Uppsala University, Sweden, private communication (2008).
- [67] P. Moskal at al., Nucl. Instr. & Meth. A 466 (2001) 448.
- [68] J. Smyrski at al., Phys. Lett. B 474 (2000) 182.
- [69] P. Moskal, Jagiellonian University, Poland, private communication (2007).
- [70] J. P. Naisse, Nucl. Phys. A 278 (1977) 506.
- [71] H. P. Noyes, H. M. Lipinski, Phys. Rev. C 4 (1971) 995.
- [72] H. P. Noyes, Ann. Rev. Nucl. Sci. 22 (1972) 465.
- [73] M. Zieliński, A. Kupść, P. Moskal, FZJ IKP Ann. Rep. 2007, Jülich, Germany, Jül-4262 (2008).
- [74] P. Moskal, A. Kupść, J. Złomańczuk, WASA-at-COSY Note: 060123PM (2006).
- [75] M. Zieliński, A. Kupść, P. Moskal, FZJ IKP Ann. Rep. 2006, Jülich, Germany, Jül-4243 (2008) 34.
- [76] A. Pricking, Tübingen University, Germany, private communication (2008).
-
[77]
C. F. Redmer, Diploma Thesis, FZ Jülich and the Ruhr-Universitt Bochum, (2006)
http://wasasrv.ikp.kfa-juelich.de/WasaWiki/images/2/2f/Diplomarbeit_CFRedmer.pdf. - [78] F. James, Monte Carlo phase space, CERN 68-15 (1968).
- [79] W. R. Leo, Techniques for nuclear and particle physics experiments, Springer-Verlag (1987) 24.
- [80] J. F. Janni, Atomic data and nuclear data tables 27 (1982) 147.
- [81] P. Vlasov et al., FZJ IKP Ann. Rep. 2006, Jülich, Germany, Jül-4243 (2007).
- [82] A. Teufel et al., FZJ IKP Ann. Rep. 2007, Jülich, Germany, Jül-4262 (2008).
- [83] A. Bramon et al., Eur. Phys. J. C 7 (1999) 271.
- [84] P. Moskal, Ph.D. Thesis, Jagiellonian Univeristy, Cracow (1998).
- [85] J. Bystricky et al., J. Physique 48 (1987) 1901 - 1924.
- [86] P. Moskal et al., Phys. Lett. B 482 (2000) 356.
- [87] D. Y. Wong, H. P. Noyes, Phys. Rev. 126 (1962) 1866.
- [88] J. D. Jackson, J. M. Blatt, Rev. of. Mod. Phys. 22 (1950) 77.
- [89] H. A. Bethe, Phys. Rev. 76 (1949) 38.
- [90] B. L. Druzhinin, A. E. Kudryavtsev, V. E. Tarasov, Z. Phys. A 359 (1997) 205.
- [91] R. M. Sternheimer, S. Lindenbaum, Phys. Rev. 123 (1961) 333
- [92] M. L. Goldberger, K. M. Watson, Collision Theory, Wiley, New York (1964).
- [93] http://paw.web.cern.ch/paw/