11email: ginevra.trinchieri@brera.inaf.it 22institutetext: INAF-Osservatorio Astronomico di Padova, Vicolo dell’Osservatorio 5, I-35122, Padova, Italy
22email: roberto.rampazzo@oapd.inaf.it, antonietta.marino@oapd.inaf.it 33institutetext: Dipartimento di Astronomia Università di Padova, Vicolo dell’Osservatorio 2, 35122 Padova, Italy
33email: cesare.chiosi@unipd.it; rosaria.tantalo@unipd.it 44institutetext: Institute for Astronomy (IfA), University of Vienna, Türkenschanzstrasse 17, A-1180 Vienna, Austria
44email: gruetzbauch@astro.univie.ac.at
XMM–Newton X-ray and Optical Monitor far UV observations of
NGC 7070A and ESO 2400100 shell galaxies††thanks: Based on XMM–Newton
observations
Abstract
Context. Shell galaxies are considered the debris of recent accretion/merging episodes. Their high frequency in low density environments suggests that such episodes could drive the secular evolution for at least some fraction of the early-type galaxy population.
Aims. We present XMM-Newton X-ray observations of two shell galaxies, NGC 7070A and ESO 2400100, and far UV observations obtained with the Optical Monitor for these and for an additional shell galaxy, NGC 474, for which we also have near and far UV data from GALEX. We aim at gaining insight on the overall evolution traced by their star formation history and by their hot gas content.
Methods. The X-ray and the far UV data are used to derive their X-ray spatial and spectral characteristics and their UV luminosity profiles. We use models developed ad hoc to investigate the age of the last episode of star formation from the (UV - optical) colors and line strength indices.
Results. The X-ray spatial and spectral analysis show significant differences in the two objects. A low luminosity nuclear source is the dominant component in NGC 7070A (log LX=41.7 erg s-1 in the 2-10 keV band). In ESO 2400100, the X-ray emission is due to a low temperature plasma with a contribution from the collective emission of individual sources. In the Optical Monitor image ESO 2400100 shows a double nucleus, one bluer than the other. This probably results from a very recent star formation event in the northern nuclear region. The extension of the UV emission is consistent with the optical extent for all galaxies, at different degrees of significance in different filters. The presence of the double nucleus, corroborated by the (UV - optical) colors and line strength indices analysis, suggests that ESO 2400100 is accreting a faint companion. We explore the evolution of the X-ray luminosity during accretion processes with time. We discuss the link between the presence of gas and age, since gas is detected either before coalescence or several Gyr () after.
Key Words.:
X-ray: galaxies – Ultraviolet: galaxies – Galaxies: elliptical, lenticular, CD – Galaxies: individual: NGC 474, NGC 7070A, ESO 2400100 – Galaxies: evolution1 Introduction
In CDM cosmology, galaxies are assembled hierarchically over an extended period by mergers of smaller systems. In this framework, early-type galaxies showing fine structure occupy a special position since they are a testimony of the effects of past merging/accretion events, and as such they fill the gap between on-going mergers and the relaxed elliptical galaxy population.
Among examples of fine structure, shells are faint, sharp-edged stellar features (Malin & Carter, 1983) that characterize a significant fraction ( 16.5%) of the field early–type galaxy population (Malin & Carter, 1983; Schweizer, 1992; Reduzzi et al., 1996; Colbert et al., 2001).
Different scenarios for the origin of shells emerge from the rich harvest of simulations performed since their discovery in the early 80’s, mostly involving galaxy-galaxy interactions. These range from merging/accretion between galaxies of different morphological type or masses (mass ratios typically 1/10 - 1/100, Quinn, 1984; Dupraz & Combes, 1986; Henquist & Quinn, 1987a, b) to significantly weaker interaction events (Thomson & Wright, 1990; Thomson, 1991). A few models that invoke gas ejection due to the central AGN or the power of supernovae (Fabian et al., 1980; Williams & Christiansen, 1985) do not associate the shell formation with environment. Most models can reproduce qualitatively basic characteristics such as spatial distribution, frequency and shape of observed shell systems (see e.g. Wilkinson et al., 2000; Pierfederici & Rampazzo, 2004; Sikkema et al., 2007, and references therein). In the accretion models, the more credited scenario for their formation, shells are density waves formed by infall of stars from a companion. A major merger may also produce shells (Barnes, 1992; Hernquist & Spergel, 1992; Hernquist & Mihos, 1995). The fact that shells are frequently found in the field, rather then in the cluster environment, finds a direct explanation in the week interaction hypothesis, since the galaxy-galaxy “harassment” within the cluster tends to destroy shells, while poorer environments are much better suited, because the group velocity dispersion is of the order of the internal velocity of the member galaxies (see e.g. Aarseth & Fall, 1980; Barnes, 1985; Merritt, 1985). The class of the so-called “internal models” for shell formation suggests that star formation within a giant shell is the result of shocked interstellar gas. In such a case shells are expected to be bluer than the parent galaxy, up to 0.5 mag in U-B and B-V (see e.g. Fabian et al., 1980). In a few cases this has been observed, (see e.g. Sikkema et al., 2007, and reference therein) but attributed to multiple accretion events of galaxies of different intrinsic color.
In the framework of a hierarchical cosmology, all galaxies, including early-type galaxies, are expected to contain multi-epoch stellar populations. Shell galaxies, among the early-type class of galaxies, are the ideal candidate to contain also a young stellar population since some simulations indicate a shell dynamical age of 0.5–2 Gyr (Henquist & Quinn, 1987a; Nulsen, 1989). The star formation history of shell early-type galaxies has been analyzed by Longhetti et al. (2000) using line–strength indices. They show that shell-galaxies encompass the whole range of ages inferred from the H vs. MgFe plane, indicating that among them recent and old interaction/acquisition events are equally probable. If shells are formed at the same time at which the “rejuvenating” event took place, shells ought to be long–lasting phenomena. Recently, Rampazzo et al. (2007) combining GALEX far UV data and line–strength indices show that the peculiar position of some shell galaxies in the (FUV-NUV) vs. H plane could be explained in terms of a recent (1-2 Gyr old) rejuvenation episode.
A rejuvenation of stellar population requires the presence of fresh gas during the accretion event. Therefore, a study of the cold, warm and hot gas phases is important in order to consider many of the elements relevant for the evaluation of shell galaxy evolution. Rampazzo et al. (2003) found that the warm ionized (H) gas and stars appear often decoupled suggesting an external acquisition of the gas, as predicted by merging models (Weil & Hernquist, 1993). At the same time, a set of observations showing a clear association between cold (H i/CO) gas and stars challenge present merging models which do not predict it unless cold gas behaves differently from the ionized gas (Schiminovich et al., 1994, 1995; Charmandaris et al., 2000; Balcells et al., 2001).
The bulk of the interstellar medium (ISM) in early-type galaxies emits in X-rays, and only comparatively small quantities are detected in the warm and cold phases of the ISM (Bregman et al., 1992). The hot ISM is believed to build up primarily through stellar mass loss ( 1 M⊙/yr in an old passively evolving elliptical galaxy with M mag) and Type Ia supernova ejecta (0.03 M⊙/yr in a galaxy with M mag; see details in Greggio, 2005). The two processes produce an almost identical mass in metals although the SNIa ejecta are dominated by Fe. Humphrey & Buote (2006), using proper spectral fits to excellent Chandra data, were able to better determine the metal abundances of the X-ray emitting gas for a sample of early-type galaxies. By estimating stellar abundances from optical line strength indices, adopting simple stellar population models, they showed that the hot ISM and the stars have similar abundances.
The link between the stellar and ISM metallicities could be masked/contaminated by the accretion of a gas-rich system. At the same time, the content of hot X-ray emitting gas could be correlated with the “age” of the rejuvenation episode. Early-type galaxies with fine structure (e.g. shells), which are considered bona fide signatures of the “dynamical youth” of the galaxy, tend to be less X-ray luminous than more relaxed, “mature” ellipticals with little evidence of fine structure. These are also characterized by extended, and generally stronger, X-ray emission (Sansom et al., 2000). Simulations suggest that mergers (see e.g. Cox et al., 2006) or interactions (see e.g. D’Ercole et al., 2000) among galaxies produce indeed a wide range of X-ray luminosities. One extreme example in this picture is NGC 474, which shows a well developed shell system and has an X-ray luminosity consistent with the low end of the expected emission from discrete sources (Rampazzo et al., 2006). The X-ray domain may further disclose an otherwise hidden AGN activity, that could also be a result of the merging episodes. Again an extreme example of nuclear activity in a merger remnant can be found in the newly discovered spectacular shell system in the elliptical host of the QSO MC2 1635+119 by Canalizo et al. (2007).
So, whereas accretion/merging events are widely believed to be at the origin of shell galaxies, all the details such as: the age of the event and duration of the shell structure, the global secular evolution of the stellar and gas components of the host galaxy as well as the timing for triggering the AGN, its duty cycle and feedback, are far from being firmly established. In light of the high fraction of shell galaxies in the field, interaction/accretion/merging events seem to have played a significant role in the evolution of the early-type class as a whole. At the same time, there is still the general open question of whether a link exists between shell galaxies and the early phases of merging processes (ULIRGs, AGN, E+A galaxies etc.) on one side and the general class of “normal” early-type galaxies on the other.
In the above framework, we discuss the X-ray (XMM-Newton) observations of two shell galaxies, NGC 7070A and ESO 2400100, taken from the Malin & Carter (1983) compilation. We further present far UV XMM-Newton Optical Monitor (OM) observations of these objects, and we add GALEX far UV observations of NGC 474, for which the results from XMM-Newton X-ray observations have been already presented in Rampazzo et al. (2006). Through far UV photometry we aim at inferring whether these galaxies have ongoing/recent star formation activity and its distribution across the galaxy. We finally aim to correlate the above information with those extracted from their hot gas content and properties in light of our current understanding of these components.
The plan of the paper is the following. Section 2 describes the relevant properties of our sample gathered from the literature. Section 3 presents the X-ray and Far UV observations and data reduction. Results are presented in Section 4 and discussed in Section 5. H0=75 km s-1 is used throughout the paper.
| NGC 474 | NGC 7070A | ESO 2400100 | Ref. | |
|---|---|---|---|---|
| Morphol. Type | (R’)SA(s)0 | (R’)SB(l)0/a | SAB0: pec | [1] |
| Mean Hel. Sys. Vel. [km s-1] | 236616 | 239118 | 318414 | [2] |
| Adopted distance [Mpc] | 32.5 | 31.9 | 42.4 | [3] |
| [gal Mpc-3] | 0.19 | [3] | ||
| Environment | Cetus-Aries | [3] | ||
| cloud | 52-12 | [3] | ||
| Apparent magnitude, | ||||
| colours, indices: | ||||
| BT | 12.360.16 | 13.350.15 | 12.630.24 | [2] |
| KT (2MASS) | 8.5550.039 | 9.1300.026 | 8.6980.028 | [1] |
| 6 cm [mJy] | 1.3 | [5] | ||
| S60μm (IRAS) [Jy] | 0.260.040 | [1] | ||
| S100μm (IRAS) [Jy] | 0.750.077 | [1] | ||
| Mg2 | 0.28/0.21 | [6] | ||
| H | 1.54/2.79 | [6] | ||
| 2.31/2.01 | [6] | |||
| H+K(CaII) | 1.18/1.24 | [6] | ||
| H/FeI | 0.97/0.88 | [6] | ||
| Galaxy structure: | ||||
| Effective Surf. Bright. (B) | 21.990.31 | 22.480.33 | 21.840.33 | [2] |
| Diam. Eff. Apert., Ae [″] | 64.6 | [2] | ||
| Average ellipticity | 0.21 | 0.28 | 0.46 | [2] |
| P.A. [deg] | 75 | 6.5 | 132.5 | [2] |
| Fine structure () | 5.26 | [4] | ||
| Kinematic parameters | ||||
| Vel.disp. stars [km s-1] | 163.95.1 | 101.020.2 | 225/223 | [1,6] |
| App.Max. rotation Vmax star [km s-1] | 306 | 0.00.0 | [2] | |
| App.Max. rotation Vmax gas [km s-1] | 158.49.3 | [2] |
References: [1] NED http://nedwww.ipac.caltech.edu/; [2] HYPERLEDA http://leda.univ-lyon1.fr/; [3] Tully (1988) (H0=75 km s-1 Mpc-1); [4] Sansom et al. (2000); [5] Sadler, Jenkins & Kotanyi (1989); [6] (Longhetti et al., 1999, 2000) data refer respectively to the nuclei embedded in the envelope of ESO 2400100.
2 The sample
In the following paragraphs and in Table 1 we present the main characteristics of the galaxies considered by the present study derived from the recent literature.
NGC 7070A This lenticular galaxy at a heliocentric velocity of 245020 km s-1 has a bright Scd companion, NGC7070, at a projected separation of 21′ (195 kpc) and at least two other smaller spirals near NGC7070 (Oosterloo et al., 2002). Malin & Carter (1983) describe its shells as nearly circular and about complete. The shells are probably the remnants of the same event which formed the strong dust–lane which crosses the entire galaxy. Brosch et al. (1985) attribute the dust–lane to the accretion, about 1 Gyr ago, of a small disk galaxy containing at least 4 107 M⊙ of gas and dust. Sharples et al. (1983) performed an analysis of its kinematics along several axes, including apparent major and minor axes. The stellar component shows no rotation at any position angle (V 30 km s-1). The velocity dispersion is very low, 100 km s-1, and does not change with radius. In view of the above kinematical properties, Sharples et al. (1983) suggest that NGC7070A may be a face-on disc galaxy with a triaxial or prolate bulge and that the dust lane is unlikely to be in an equilibrium configuration. Sharples et al. (1983) measured also the gas kinematics along the dust-lane showing that the rotation curve is approximately that of a solid body. Since there is no evidence of rotation of the stellar component, they conclude that the angular momentum axes of the stars and gas must be very different. Rampazzo et al. (2003) showed indeed that the ionized gas distribution in NGC 7070A is elongated and has an asymmetric structure relative to the stellar body. The nucleus of NGC 7070A is a faint radio emitter at 4.885 GHz (Sadler, Jenkins & Kotanyi, 1989). No H i is detected down to the level of M M☉ (Oosterloo et al., 2002, using the Australia Telescope Compact Array).
ESO 2400100 Longhetti et al. (1998b) found two distinct nuclei separated by and with systemic velocities different by 200 km s-1. Rampazzo et al. (2003) show that the ionized gas and the stars are completely decoupled. Simulation of inter-penetrating encounters by Combes et al. (1995) and references therein show that the U-shape and the correlated inverted U-shape velocity profile along the line connecting the two galaxy nuclei is a bona fide signature of the ongoing interaction. Since the gas 2D morphology, the stellar and the gas kinematics suggest that the two nuclei are still interacting, if the development of the shells is connected with these interactions, their formation process is still on-going.
NGC 474 Rampazzo et al. (2006) have already presented this system in details, along with its X-ray properties. NGC 474, also known as Arp 227, is interacting with NGC 470, a spiral galaxy at 5.4′ to the west. The two galaxies have a small (virtually null) velocity difference. The surface photometry of Shombert & Wallin (1987) indicates that NGC 474 is a S0 galaxy with a smooth and undistorted inner luminosity profile. Turnbull et al. (1999) suggests that the colors of the inner shells follow that of the galaxy while the outer shells appear to be bluer. Similar results are found by Pierfederici & Rampazzo (2004) and Sikkema et al. (2007). Using ACS-HST, these latter authors suggest that the morphology of the shell system is probably due to multiple accretion events. NGC 474 is a very gas-poor system. It has not been detected in H and also the hot gas component is poor: it’s X-ray emission is very low, and its luminosity, L erg s-1, is consistent with the low end of the expected emission from discrete sources (Rampazzo et al., 2006).
Beside the shell structure, spectacular in NGC 474, these systems have other characteristics in common. They are all S0 galaxies located in low density environments. They are all interacting systems, although at different levels of interaction: NGC 7070 and NGC 7070A are well separated and mildly interacting, while the interaction is strong between NGC 470 and NGC 474 as shown by the H i data. Two nuclei are embedded and interacting within a single envelope in ESO 2400100. Current literature supports the accretion hypothesis for all galaxies. There is strong evidence that the current interaction is not responsible for the origin of the shell system in either NGC 474 or NGC 7070A, at variance with ESO 2400100. Pierfederici & Rampazzo (2004) have shown that the radial distribution of the shell surface brightness in NGC 474 is inconsistent with the weak interaction hypothesis. There is also kinematical evidence that the strong dust–lane which crosses the entire body of NGC 7070A, with an orientation intermediate between the optical major and minor axes, is the result of external accretion (Sharples et al., 1983), which could be related with the formation of the shell system. At the same time, our galaxies are not homogeneous in mass111The velocity dispersion, , does not have a one-to-one relationship with the mass of the galaxy. Recent work by Cappellari et al. (2006) has investigated the relation between the galaxy mass-to-light (M/L) ratio and the line-of-sight component of the velocity dispersion with the effective radius. They provide relations (their equations 7 and 10) which allow a transformation from measured velocity dispersion to galaxy mass; (1) where is the galaxy mass in units of and is the velocity dispersion in units of . The errors have been propagated from the parameter values found by Cappellari et al. (2006).: their stellar velocity dispersion is in the range 101 225 km s-1 (see Table 1), corresponding to masses of 0.2 2.4 1011 M⊙.
| Galaxy | EPIC | EPIC | OM | OM | OM | OM | observing | GALEX | observing | |
|---|---|---|---|---|---|---|---|---|---|---|
| PN | MOS | UVM2 | UVW1 | U | B | date | FUV | NUV | date | |
| exp. [ks] | exp. [ks] | exp. [s] | exp. [s] | exp. [s] | exp. [s] | exp. [s] | exp. [s] | |||
| NGC 474 | 4.3 | 11.4 | 5000 | 5000 | 5000 | 2004 -01-24 | 1647 | 1477 | 2003-03-10 | |
| NGC 7070A | 26.3 | 30.8 | 4400 | 4000 | 2004-10-28 | |||||
| ESO 2400100 | 20.0 | 26.3 | 4400 | 4400 | 4400 | 2004-05-11 | ||||
3 Observations and data reduction
3.1 X-ray observations
We obtained ks XMM-Newton observations of NGC 7070A and ESO 2400100 with the EPIC instruments (see Table 2). We applied the standard reduction to the data mainly with SAS version 7.0 (http://xmm.vilspa.esa.es). We have further cleaned the data set for periods of high background, as suggested by the XMM-Newton Science Analysis system:Users’ Guide available on line222http://xmm.vilspa.esa.es/external/xmm_user_support/ documentation/sas_usg/USG. We retained only patterns 0-4 inclusive for EPIC-pn, and 0-12 for EPIC-MOS. For imaging analysis, we have merged the two MOS event lists to improve the statistics. The merged event list will not be used for spectral analysis.
For an accurate determination of the background, and of the total extent of the source, we have followed two parallel procedures: 1) we have produced radial profiles in different energy bands (see later) and examined them to determine whether and when the profile would become constant with radius and b) we compared them with the equivalent photon distributions obtained from the blank sky fields provided at http://xmm.vilspa.esa.es/external/xmm_sw_cal/ background/blank_sky.shtml. These latter have been examined and cleaned of residual high background levels to match the average value of our cleaned fields. Since the size of the sources is small compared to the field of view, a local determination of the background is possible and extrapolation to small radii is not limited by vignetting effects. We therefore resolved to determine the background both for spatial and spectral analysis from regions free of sources as close to the source as possible.
To increase the statistics without having to take into account the different patterns in the CCD-gaps in the two instruments, we have summed all EPIC-MOS data and kept the EPIC-pn data separate. The limited statistics that result from these datasets do not allow us to investigate in detail the X-ray characteristics of the two galaxies. Table 3 summarizes the relevant X-ray measures for both galaxies. To convert the count rates into fluxes and luminosities we have assumed a conversion factor based on the EPIC-pn camera, since neither source is affected by the CCD gaps, and the XSPEC results (see section 4.2).
3.2 Far UV observations
Simultaneous Optical Monitor (OM hereafter, Mason et al., 2001) images were obtained during the X-ray observations performed with the EPIC cameras (see Table 2). The ultraviolet UVW1 and UVM2 filters, which cover the ranges 245-320 nm and 205-245 nm respectively (Mason et al., 2001), and the U (300-390 nm) and B (390-490) bands have been used. The Point Spread Function – FWHM – is 2.3″ in U, 2.0″ in B, 1.7″ UVW1, and 2.0″ in UVM2 sampled with 04760476 pixels. Unwanted ghosts due to scattered light are unfortunately present in the OM images, less prominent when using UV filters with respect to optical filters (see Mason et al., 2001). Accounting for the effects of these features on the surface photometry is not an easy task. We simply mask ghosts when they are away from our targets and do not affect the accuracy of the photometry. In more difficult cases, when they could contaminate our estimates, we attempt to model such features in order to remove them from the image.
In order to complete the UV information for our galaxies we have also retrieved the GALEX data for NGC 474 (the only one observed so far) from the archive. The GALEX mission and instruments are fully described in Martin et al. (2005) and Morrissey et al. (2005, 2007). The spatial resolution of the images is 45 and 60 FWHM in FUV (135 – 175 nm) and NUV (175 – 275 nm) respectively, sampled with 1515 pixels.
The analysis on the surface photometry was carried out on the background subtracted images we obtained from the archive, using the ELLIPSE fitting routine in the STSDAS package of IRAF and the GALFIT package (Peng et al., 2002). The necessary AB photometric zero points were taken from Morrissey et al. (2005) for GALEX and from the XMM Users’ Handbook333http://xmm.vilspa.esa.es/external/xmm_user_support/ documentation/uhb/node75.html for OM observations. AB magnitudes, photometric errors and colors were determined from the original data. Smoothed images are used to better enhance the faint shell structure, mostly for displaying and for assessing the morphology.
ELLIPSE computes a Fourier expansion for each successive isophote (Jedrzejewski, 1987), resulting in the surface brightness profiles in the AB photometric system. GALFIT was used to perform a bulge-disk decomposition – if needed – and to determine the parameters of the Sersic profile (Sersic, 1968) fitted to the bulge of the galaxies. The profile is sensitive to structural differences between different kinds of early-type galaxies and thus provides a better fit to real galaxy profiles.
4 Results
4.1 X-ray morphology
To study the distribution of the X-ray emission associated with these galaxies we have produced smoothed images, for a visual impression of the X-ray morphology, and radial profiles, that measure the extent and possible azimuthal asymmetries.
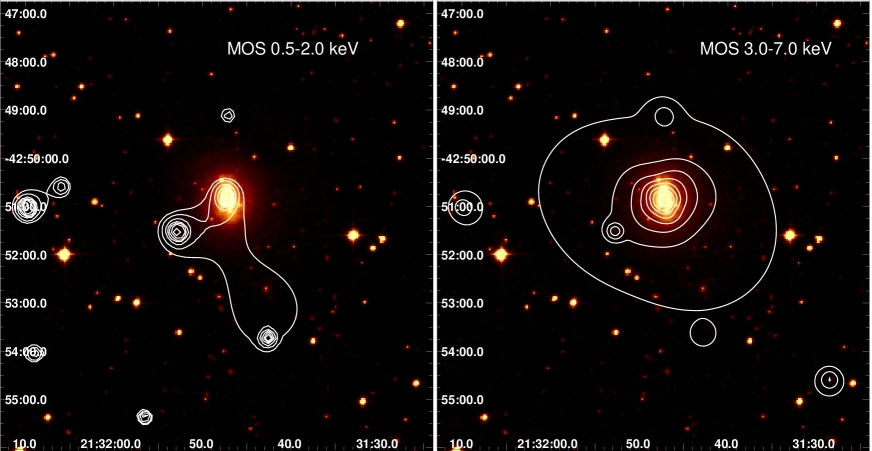
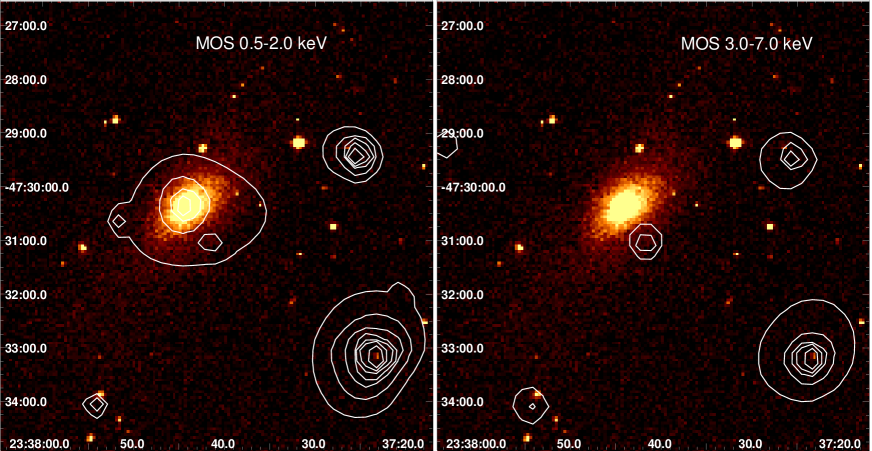
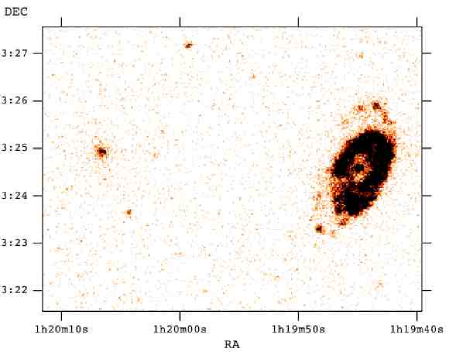
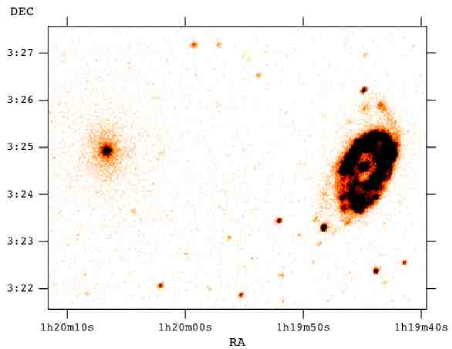
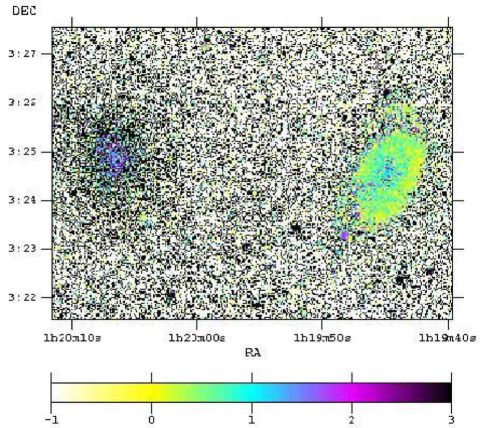
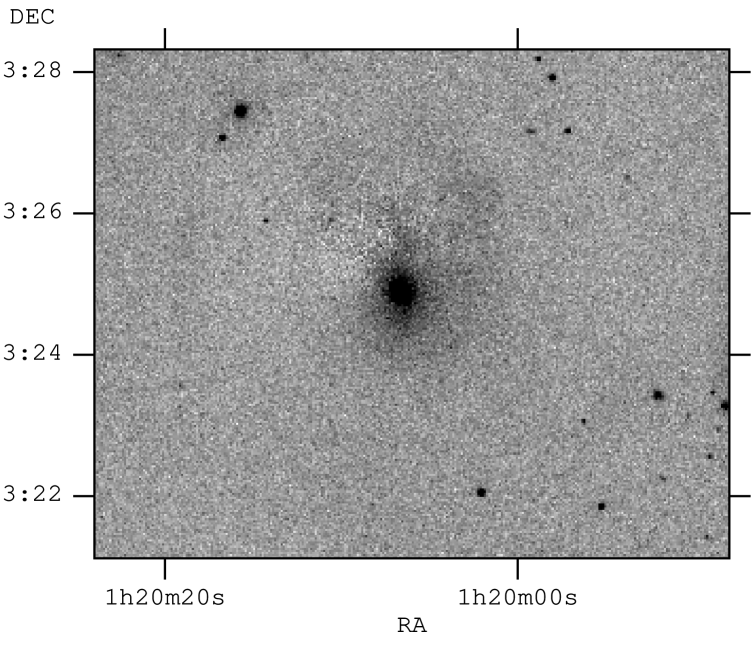
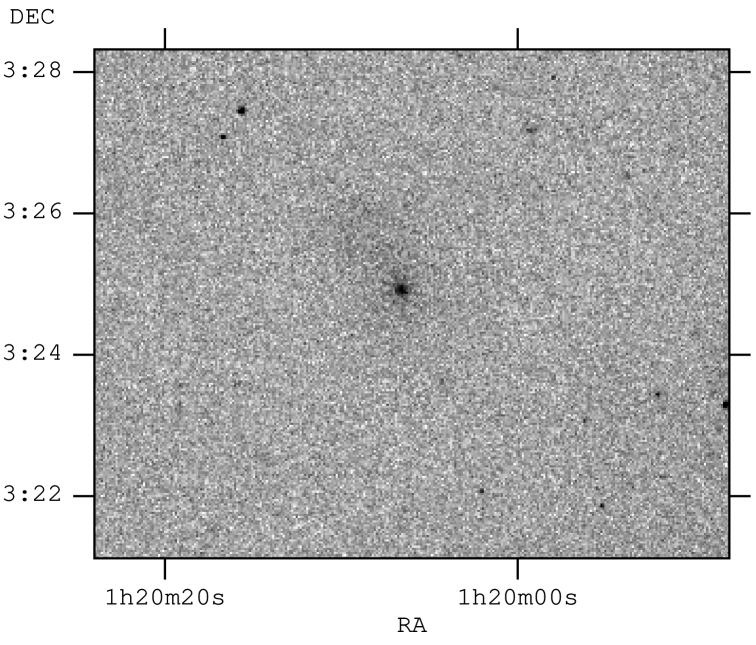
The smoothed X-ray maps of the emission in two broad energy bands are shown in Fig. 1, superposed onto the optical images from the DSS plate. We used the adaptive smoothing algorithm that takes into account the available statistics to determine the size of the kernel to be applied (see Ebeling et al., 2006). Both galaxies are clearly detected, and the emission is centered on the nuclear region. Several unrelated sources are also present in the field, in both observations. Note in particular a relatively bright compact source to the SE of NGC 7070A. It is immediately evident that the emission from these two galaxies has significantly different characteristics, even though caution should be used when interpreting adaptively smoothed images. In NGC 7070A both hard and soft photons are present, but the emission appears to be rather compact (a more quantitative measure is discussed later). In ESO 2400100 the soft band emission is significantly stronger than the hard band one, and appears broader than in NGC 7070A.
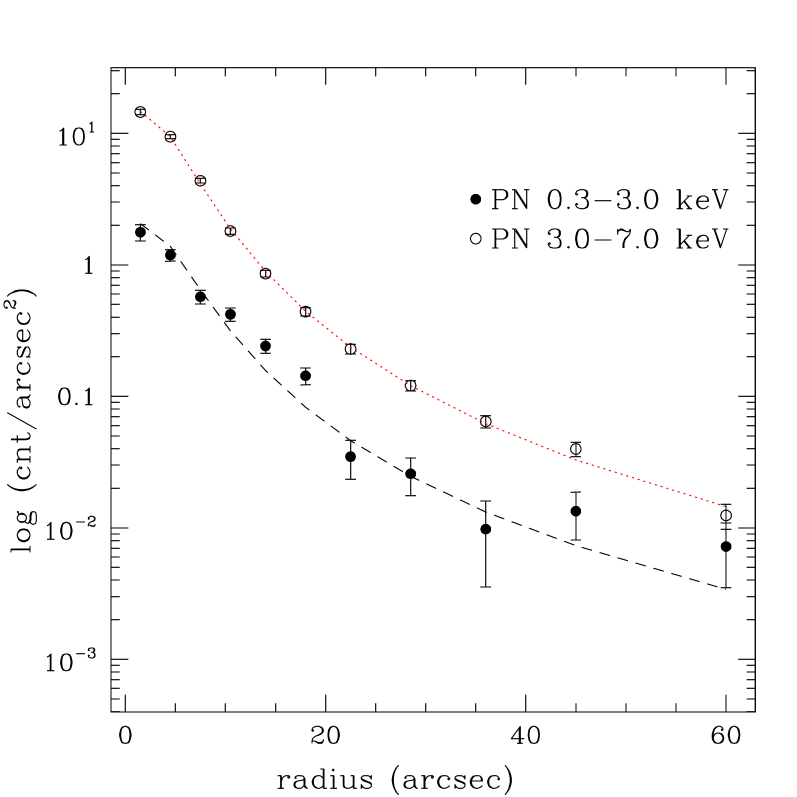
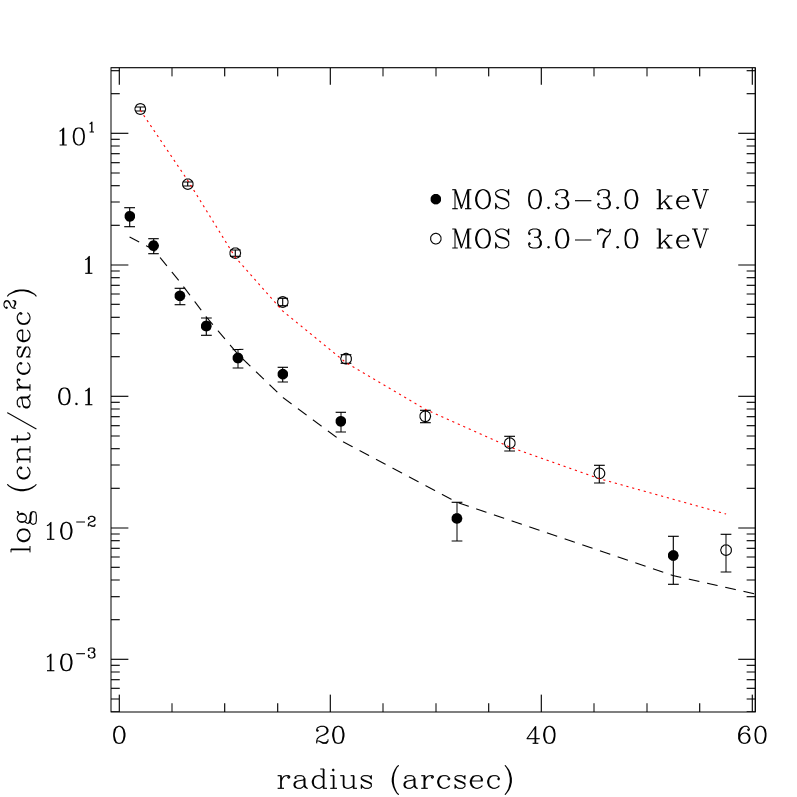
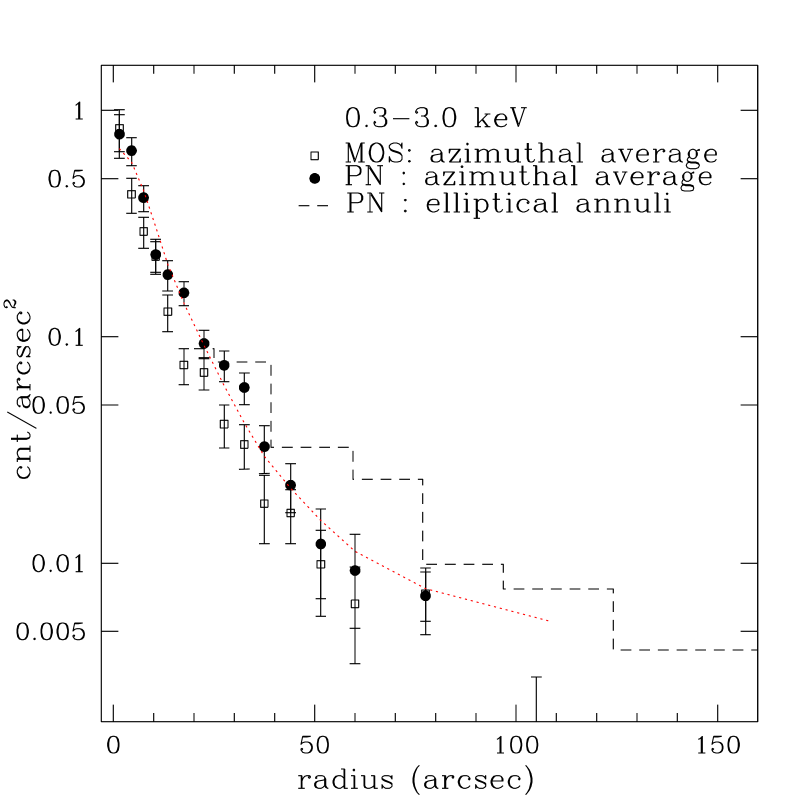
The radial profiles of the emission shown in Fig. 2 and Fig. 3 confirm the visual impression given by the maps (Fig. 1). Figure 2 shows NGC 7070A in the soft and hard broad energy bands. In Fig. 3 for ESO 2400100 only in the soft band is shown. All unrelated/background sources have been excluded from the profiles. The photon distributions in the 0.3-3.0 keV soft band are centered onto the X-ray peak and fitted with a -model of the kind: in both galaxies. However, in NGC 7070A, the best fit model is entirely consistent with the instrument Point Spread Function (PSF), which can be reasonably parameterized with a -model with (EPIC-MOS and respectively) and (see the XMM-SOC-CAL-TN-0029 and XMM-SOC-CAL-TN-0022 documents online at http://xmm.vilspa.esa.es). The fit quality is better in the harder 3.0-7.0 keV energy band, most likely a consequence of the presence of absorption that reduces transmission at softer energies (see later). In ESO 2400100, the -model indicates a core radius of , larger than the PSF. We have then used a -model convolved with the EPIC PSF, and we find a core radius of , corresponding to kpc. No radial profile is given for the hard energy band in ESO 2400100 for lack of emission above keV.
4.2 X-ray spectral properties
In order to obtain the spectral parameters for the two galaxies, we have used regions selected to maximize the signal and avoid the CCD gaps (in the EPIC-pn data). The data have been rebinned in larger energy channels to increase the statistics, and have been background subtracted, with the background data chosen locally in nearby regions where the galaxy’s emission is no longer detectable as suggested by the radial profiles. We have used a thin plasma and a power law models, with low energy absorption to parametrize the spectral shape, assuming the Wilms et al. (2000) abundance tables for the gas metallicities. In all cases the low energy absorption is at least the value corresponding to the line-of-sight Galactic NH (3.1 and 1.7 1020 cm-2, for NGC 7070A and ESO 2400100 respectively, Dickey & Lockman, 1990). Luminosities are corrected for absorption and are quoted in the 0.5-2.0 keV band for the soft plasma component, and in the broad 0.5-10 keV band for the power law component (representing the contribution from either the AGN or the binary sources).
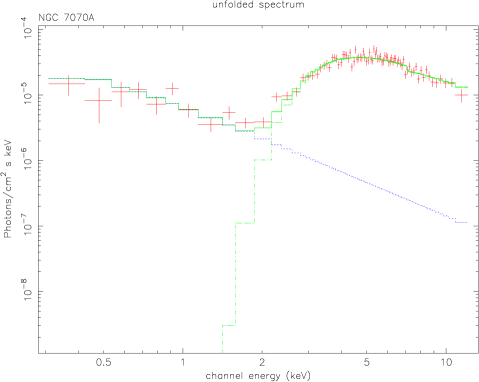
NGC 7070A The full spectral range, from to keV, is covered with adequate signal for analysis. The spectrum is described by a combination of a highly absorbed and a significantly fainter unabsorbed power law, with and N cm-2, corresponding to the typical parametrization of an absorbed AGN (see Fig. 4). The intrinsic luminosity of the source, corrected for absorption, is LX=7 1041 erg s-1 (0.5-10.0 keV), indicative of a moderate AGN. Notice that NGC 7070A was undetected both in H i and in the radio continuum; Oosterloo et al. (2002) provide an upper limit of M M⊙ giving M0.003. While the data do not require a plasma component, we can place an upper limit to a contribution from a hot ISM to L2 1038 erg s-1 (0.5-2.0 keV), for a temperature of 0.3 keV and metal abundance at 30-100% solar.
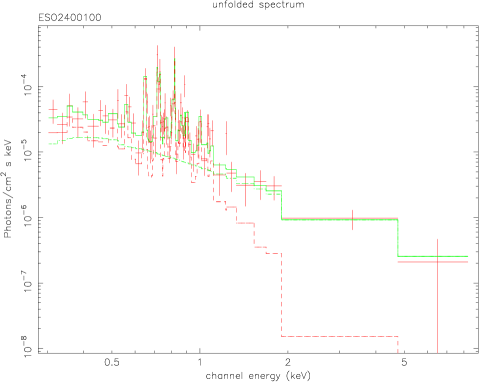
ESO 2400100. The emission can be parameterized by a low temperature plasma (kT 0.3-0.5) with a minor contribution from a power law component with to account for residuals at high energies (Fig. 4). A small amount of absorption of N 4 1020 cm-2, in addition to the line of sight Galactic value, is also suggested by the data, to contain the power law contribution at low energies. The intrinsic luminosity for the gas component is 1039 erg s-1 (0.5-2.0 keV), while the integrated emission from the power law component is 1040 erg s-1 (0.5-10 keV).
| X-ray data | |||
|---|---|---|---|
| NGC 474 | NGC 7070A | ESO 2400100 | |
| PN counts | 75.215 | 253055 | 65040 |
| count rate [cts s-1] | 1.2 10-2 | 9.7 10-2 | 3.3 10-2 |
| log LX-gas (0.5-2 keV) [erg s-1] | – | 39.70 | |
| log LX-pow (0.5-10 keV) [erg s-1] | – | 41.85 | 40.00 |
| log LX-tot (0.3-6 keV) [erg s-1] | 39.60 | [41.70] | 40.11 |
| log LB [erg s-1 L] | 10.27 | 9.86 | 10.39 |
| log LK [erg s-1 L] | 10.97 | 10.72 | 11.14 |
| log LX/LB [erg s-1 L] (0.3-6 keV) | 29.35 | [31.84] | 29.72 |
| Far UV and optical data | |||
| NGC 474 | NGC 7070A | ESO 2400100 | |
| r [arcsec] | 17 | ||
| r [arcsec] | 15 | ||
| r [arcsec] | 74.680.67 | ||
| r [arcsec] | 38.110.85 | 118.132.37 | |
| r [arcsec] | 45.641.34 | 54.531.12 | |
| r [arcsec] | 50.034.94 | 21.634.81 | 9.200.44 |
| [U] | 3.660.04 | 2.100.01 | 4.470.04 |
| [UVW1] | 3.750.06 | 3.390.03 | |
| [UVM2] | 3.180.14 | 0.690.12 | 1.110.05 |
| m | 19.08 0.05 | ||
| m | 16.53 0.01 | ||
| m | 11.46 | 12.290.14 | 11.75 |
| (UVW1-U) | 1.010.09 | 1.130.10 | |
| (UVM2-UVW1) | 2.070.13 | 1.830.31 | |
| (UVM2-U) | 3.070.18 | 3.000.30 | |
| (FUV-NUV) | 2.560.05 | ||
| (UVM2-B) | 4.630.06 |
Notes: A full description of the X-ray data of NGC 474 is provided in Rampazzo et al. (2006). X-ray luminosities for different components, described in section 4.2, are given in the appropriate X-ray bands. The total emission is given in 0.3-6.0 keV band for comparison with Brassington et al. (2007), and will be used in Fig. 11. Note that the value quoted for NGC 7070A refers to the emission of the nuclear source, as measured in section 4.2. In Fig. 11 we use an estimate of the contribution from the galaxy, as we explain in Section 5.2, which gives log LX/LB=29.84. NUV and FUV bands refers to the GALEX observations as described in Section 2; B, U, UVW1, UVM2 bands refers to XMM-OM observations. The photometric data of ESO 2400100 refers to the entire galaxy envelope, i.e. includes the two detected nuclei. AB magnitudes have been corrected for Galactic extinction. We adopt the following formulae for our galaxies (see Brassington et al., 2007): log () =12.192 -0.4 +2log (Tully, 1988) where and are the apparent magnitude and the distance in Mpc; = 11.364 -0.4 + log(1+) - 2log (Seigar, 2005), is the K-band magnitudes taken from the 2MASS survey, is the galaxy redshift, and the distance in Mpc.
The spectral results are in substantial agreement with the picture suggested by the spatial analysis presented above: the nuclear source is the dominant component in NGC 7070A. In ESO 2400100, the emission is indicative of a low temperature plasma with a contribution from the collective emission of individual sources in the galaxy. Given the lack of evidence of a central source from the radial profile, and of an AGN in the optical data, the alternative of a mildly absorbed, low luminosity central source is less likely, although not entirely excluded.
4.3 Far UV morphology and photometry
We performed a morphological study of the galaxy structures both with the OM and GALEX data.
The photometric and structural values derived from the present surface photometry are summarized in Table 3. Notice that the large variation both in the effective radii and Sersic indices measured in the UV and optical bands studied are partly indicative of the different S/N of images in the different bands.
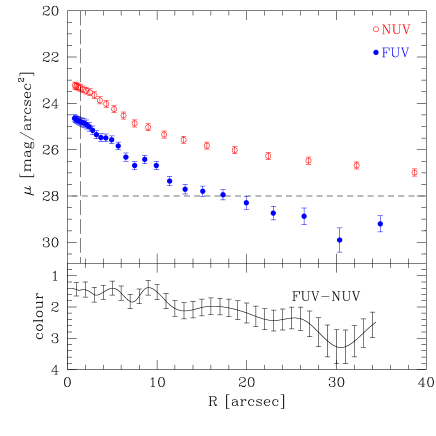
Figure 5 shows the GALEX FUV (top left panel) and NUV (top right panel) images, obtained from the archive. The morphology of the spiral galaxy NGC 470 is similar in the FUV and NUV bands, while only the very inner part of NGC 474 is visible in either of them, consistent with the difference in their respective morphologies. In Figure 5 (bottom left) the GALEX (FUV - NUV) colour map also illustrates the very different results obtained for the two galaxies in the pair, and shows a very young stellar component only in NGC 470. In the bottom right panel we show the NUV and FUV luminosity profiles as well as the color profile of NGC 474. The color profile shows a gradient going from the center, (1.5) to the outskirts of the galaxy (2.5).
Although the effect could be partly due to the lower S/N of the FUV with respect to the NUV image, the FUV emission seems more concentrated in the central part of NGC 474 with respect to the NUV emission. There is no evidence of the complex shell structure detected by Pierfederici & Rampazzo (2004) and Sikkema et al. (2007), which is instead present in the U and UVW1 OM images shown in Figure 6. Ghosts perturb the shape of the shells to the north of the nucleus but there is a one to one correspondence to the shell system evidenced in Fig. 1 of Pierfederici & Rampazzo (2004). Asymmetries in the galaxy nucleus could be attributed to the presence of dust shown also by the HST-ACS image in Sikkema et al. (2007).
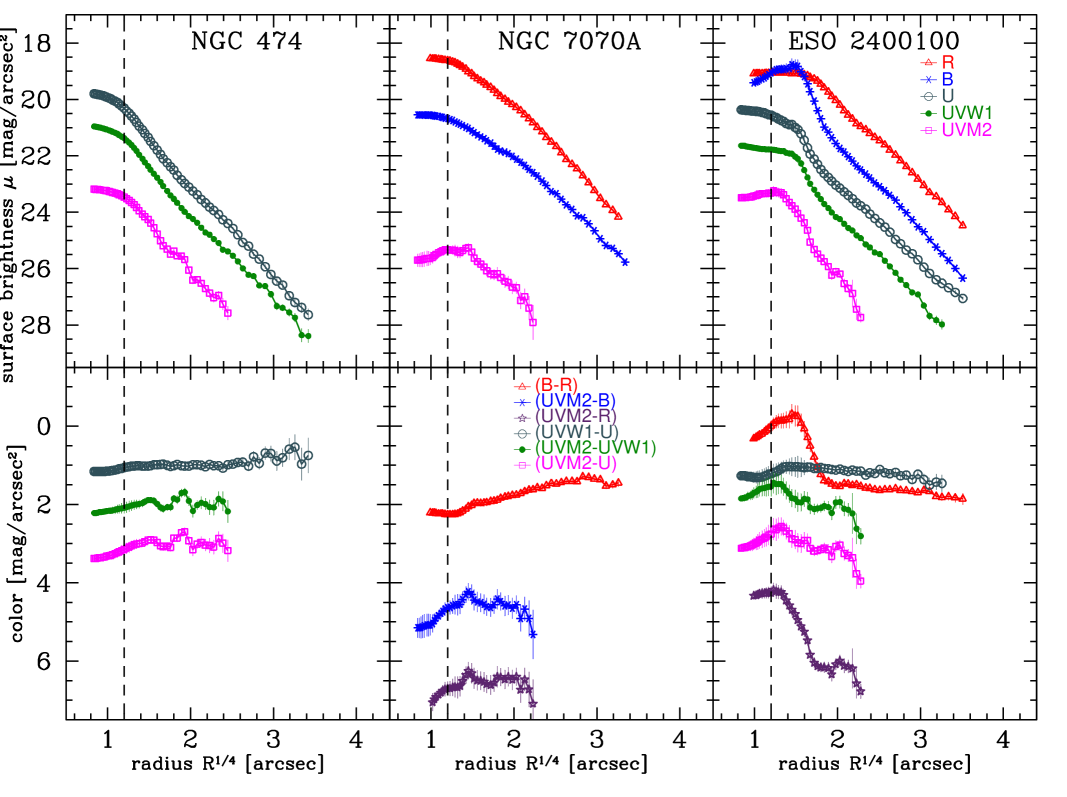
In Figure 7 (left panels) we plot the luminosity and the color profiles of NGC 474. The galaxy is considered a bona fide S0 seen nearly face-on: we measured an average ellipticity of 0.3. The Sersic index is quite stable around the value of 3.5 in the U, UVW1 and UVM2 (see Table 3) while the effective radius re shows a significant variation which is partly due to the presence of ghosts north of the nucleus. We do not detect radial color gradients within the errors in all bands analyzed, at odds with the slightly decreasing GALEX (FUV-NUV) color profile. Our average (UVW1-U), (UVM2-UVW1) and (UVM2-U) color measures listed in Table 3 agree within the errors with the global color of the galaxy provided by the OM source-list catalogue which reports a total galaxy magnitude of 16.14 and 17.21 and 19.30 in the U, UVW1 and UVM2 bands respectively.
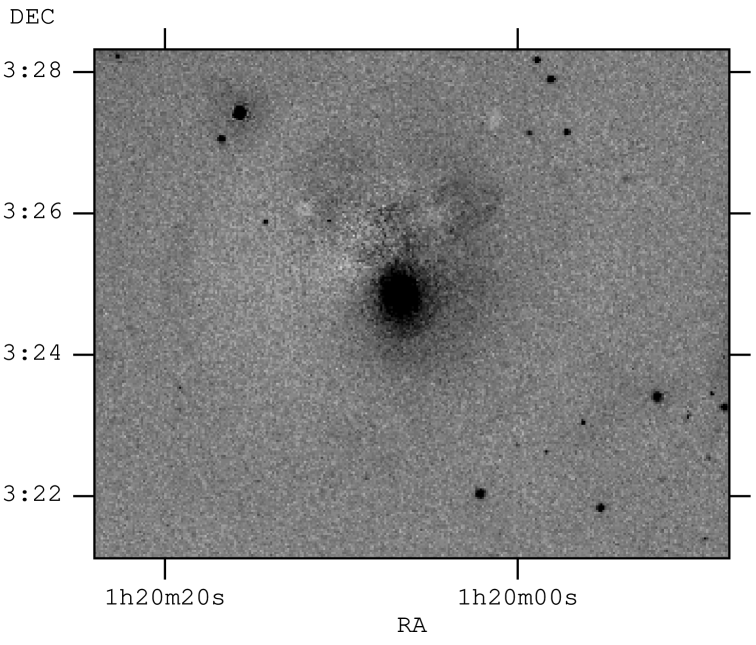
Figure 8 shows the B image of NGC 7070A. The dust lane is clearly visible. Although the exposure time is similar to that of the other galaxies in the sample, the galaxy is barely visible in the UVM2 band (hence we do not show it), an effect probably due to dust absorption, more significant than in the other objects. The luminosity profiles in the B and UVM2 bands are shown in Figure 7 together with the R-band luminosity profile obtained from the ESO-Uppsala data base. The shape of the luminosity profiles indicates the presence of two components, probably a bulge plus a disk, as suggested by the kinematic analysis of Sharples et al. (1983). The (UVM2-B) and (UVM2-R) color profiles are flat. The (UVM2-B) color reported in Table 3 as the average over the profile in Fig 7 agrees within the errors with the global color of the galaxy provided by the OM source-list catalogue, which also gives a total galaxy magnitude of 16.20 and 20.66 in the B and UVM2 bands respectively.
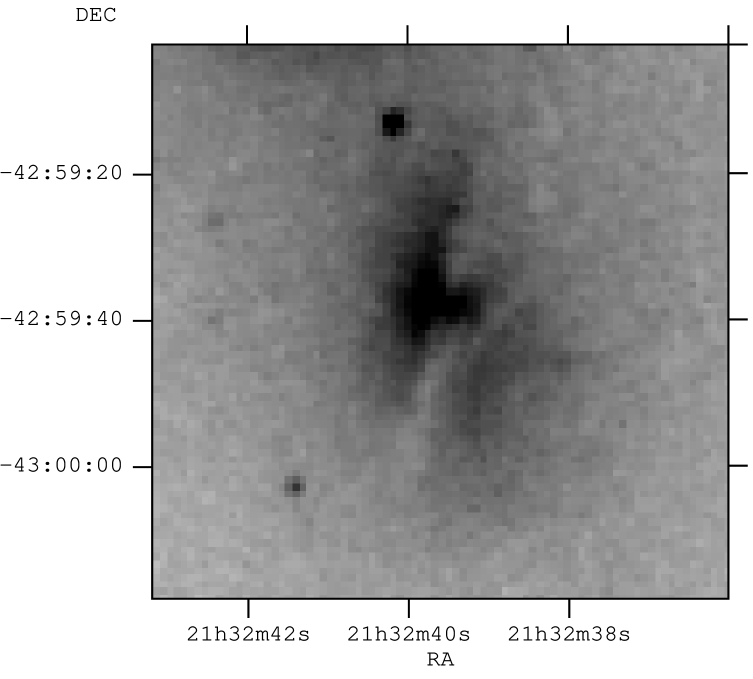
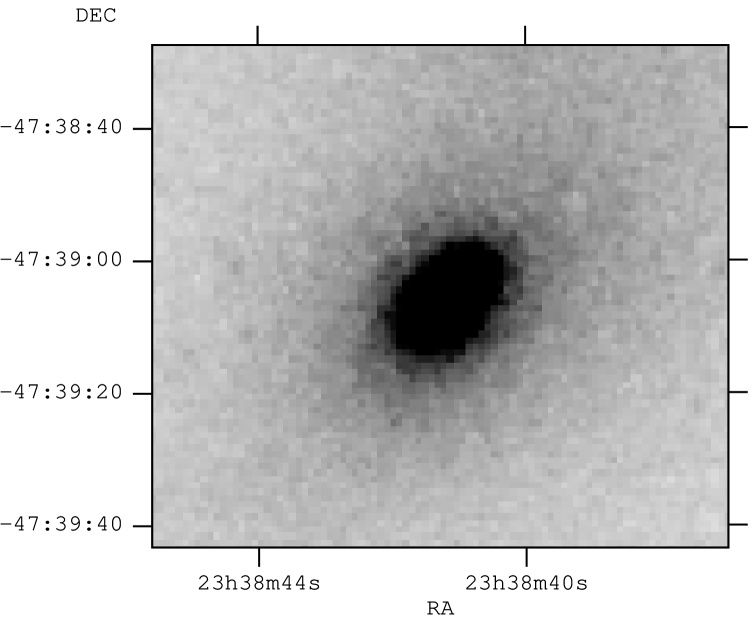
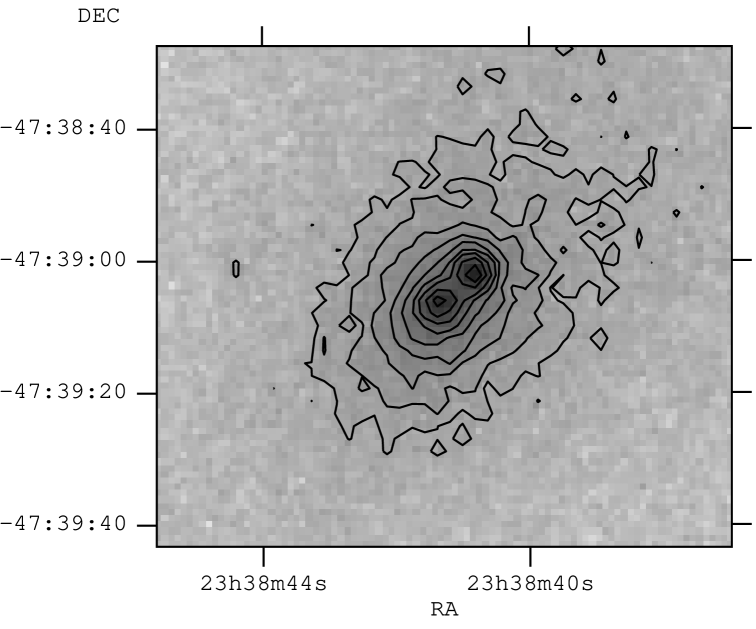
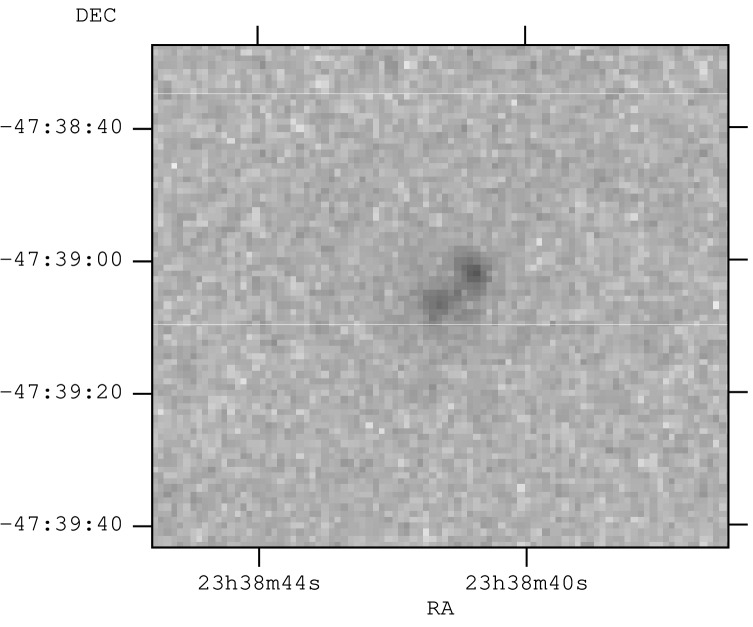
Figure 9 shows the U, UVW1 and UVM2 images of ESO 2400100. The two nuclei, discovered by the kinematical study of Longhetti et al. (1998a), are clearly visible also in the UVW1 and UVM2 bands. Based on kinematical measures and models by Combes et al. (1995), Longhetti et al. (1998a) suggest that they are strongly interacting and not a mere projection effect.
In Fig. 7 we plot the surface photometry in several bands and the color gradients. B and R-bands luminosity profiles obtained from the ESO-Uppsala data base are also shown. The average colors of the galaxy are given Table 3. The present surface photometry considers the galaxy as a single envelope. The geometric center of the galaxy, as determined by the outer isophotes, is located between the two distinct nuclei. This explains why the shape of the light distribution in the B-band profiles shows a significant rise in the center, at about 285, or a substantially flat distributions in the other bands, and a flattening outside when the two distinct components disappear and the galaxy becomes a unique envelope. As already noticed in NGC 7070A above, the luminosity profile also suggests the need for a disk component. Except for (UVW1-U), all color profiles in Figure 7 show a gradient from the center to the outskirts, more evident in (B-R) and (UVM2-R). The OM source-list catalogue provides the following magnitudes for the Northern nucleus: U=16.31, UVW1=17.38, UVM2=19.03. For the Southern one: U=16.35, UVW1=17.37, UVM2=19.15. Therefore we can estimate different UV colors for the two nuclei: (UVW1-U)North = 1.07 and (UVW1-U)South = 1.02; (UVM2-U)North = 2.71 and (UVM2-U)South = 2.79; (UVM2-UVW1)North = 1.64 and (UVM2-UVW1)South = 1.77; these colors are quite similar, also considering the errors reported in Table 3. A very blue value of (B-R) = -0.31 is derived for the Northern nucleus from the ESO-Uppsala data.
5 Discussion
We use the results obtained above to investigate whether the combination of the far UV and optical colors can provide useful constrains on the time at which the accretion/merging phenomenon has occurred. Possible rejuvenation signatures in the stellar population generated during the shell formation have already been traced and the galaxy secular evolution has been dated through GALEX observations by, e.g., Rampazzo et al. (2007).
This information is also relevant for a proper discussion of the X-ray data. For example, the X-ray luminosity is thought to evolve with different phases of the merging processes, from the galaxy-galaxy encounter, the merging itself and the coalescence of the remnant towards a relaxed galaxy (see e.g. Brassington et al., 2007).
5.1 Can we time the accretion event through modelling of GALEX and OM magnitudes and colours ?
Longhetti et al. (2000) studied the H vs. [MgFe] plane with the aim of inferring the age of the stellar population in shell galaxies. In the above plane, shell galaxies occupy the same region of normal early-types, although a number of them have a stronger H. Given the similarity with shell galaxies, for which the signatures of interaction are evident, Longhetti et al. (2000) suggest that the scatter in the H vs. [MgFe] plane could be the result of a secondary episode of star formation after their formation. In fact the shape of the distribution of the line-strength indices in the H vs. [MgFe] plane suggests an effect related to the metal enrichment that always accompany star formation. Longhetti et al. (1999) further suggest that, if the last star forming event is connected to the formation of the shell system as expected from simulations, the shells ought to be a long lasting phenomenon, since star forming events that occurred in the nuclear region of shell galaxies are statistically old (from 0.1 up to several Gyr). A subsequent study by Tantalo & Chiosi (2004b) added an additional parameter to interpret the scatter in the H emission, i.e. the enhancement in elements in the abundance patterns. They argue that part of the scatter in H could reflect the intrinsic variation of enhancement from galaxy to galaxy existing in old populations of stars due to different star formation histories rather than a dispersion in age caused by more recent star forming episodes.
Based on these premises, Rampazzo et al. (2007) investigated whether GALEX data may confirm or disprove the case that shell galaxies hosted a recent star burst event. UV colours are considered to be particularly suited to identify very young stellar populations and their distribution inside interacting galaxies (see e.g. Hibbard et al., 2005). There is, however, an important point to keep in mind dealing with UV colours, i.e. the possibility that high metallicity, old stars (age yr and metallicity ) likely present even in small percentages in early-type galaxies could affect the (FUV-NUV) colours. The evolved stars in metal rich populations (Extremely HB and AGB-manqué) are the proposed source of the UV excess in quiescent early-type galaxies and any modeling of star formation must take this population into consideration (see Bressan et al., 1994, for a detailed discussion of the subject). Fortunately, additional information, such as the presence of dust and gas, the dynamics or the overall spectral energy distribution, can help in a correct interpretation of the results.
The key assumptions in the definition of the stellar models and isochrones, the library of stellar spectra and the AB mag photometric system that are used to calculate theoretical GALEX FUV and NUV magnitudes for a Simple Stellar Population (SSP) are provided in Rampazzo et al. (2007). We use them in modeling the GALEX data set for NGC 474. The same assumptions have been adopted in modelling the B, U, UVW1 and UVM2 filters used for NGC 7070A and ESO 2400100 with the XMM-Newton Optical Monitor. Filter transmission curves, provided by the XMM - Newton Science Center (see also § 3.2), have been elaborated to calculate magnitudes as in the case of the GALEX filters.
The comparison of data with theory is made assuming that the complex stellar mix of a real galaxy can be reduced to a SSP of suitable metallicity and age. However this approximation has different implications when interpreting the two parameters. While the metallicity distribution can be “reasonably” approximated to the mean value, the same does not hold for the age, when it is derived from integrated properties (see e.g. Serra & Trager, 2007). In the discussion below, one has to keep in mind that the age measured from colours (and/or indices) is always biased (dominated) by the last episode of star formation. In other words, it is a mean luminosity weighted age, in which the most recent star forming episode dominates at least during the first 2-3 Gyr from its occurrence. This is simply due to the rather well established law of luminosity fading of stellar populations, which ultimately mirrors the lifetime and evolutionary rate of a star as a function of its mass. In the following we will refer to this age as . It does not necessarily coincide with the real age of a galaxy . In general, if a galaxy underwent an initial star forming episode followed by quiescence, ; if episodes of star formation occurred at a later time, , the difference becoming larger as the activity is closer to us in time. An old galaxy may look young if a secondary star formation activity took place in the ”recent past”.
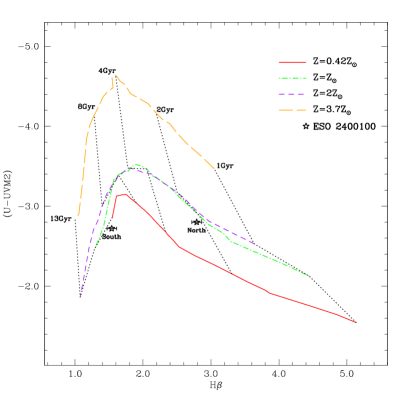
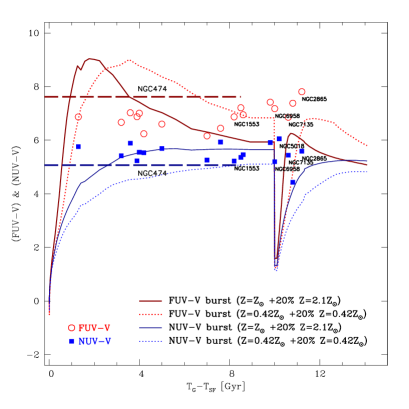
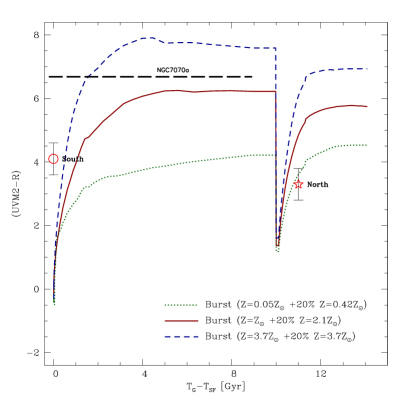
Figure 10 compares the theoretical predictions from different SSP models with metallicities in the range 0.008Z0.070 with the observations. Different optical-UV colors are plotted as a function of “age” estimated as the time elapsed from the last episode of star formation activity computed in different ways, depending on the available information. The left panel shows the nuclear line–strength index H vs (U-UVM2) for the two nuclei of ESO 2400100. The H values are from Longhetti et al. (2000) while the (U-UVM2) (and (UVM2-R), see later) nuclear colors are calculated from the present photometry, within an aperture of about 3″ diameter centered on each nucleus, separated by about 5″. The comparison with the models suggests an age of and Gyr for the northern and southern nuclei, respectively. This is consistent with the photometric results of Fig. 7, where the north, younger nucleus is significantly bluer, which is likely to be the result of a contribution from a young stellar population.
The estimate of 2 Gyr for the northern nucleus, as the age of the last star formation event, should be considered an upper limit. In fact, Longhetti et al. (2000) did not correct the values of H for line emission infilling. Rampazzo et al. (2003) showed the presence of ionized gas, whose filamentary distribution covers the two nuclei. A correction for line infilling would deepen the H line, increasing the value of the line-strength index, and would lead to a smaller age estimate ( 2 Gyr).
In the middle and right panels of Figure 10 we model the colour evolution of an early-type galaxy which has had a recent burst of star formation. The burst occurs at the age 10 Gyr. The intensity of the burst is 20% and two possible combinations for the metallicity for the old and young components are shown. Of course, other values of the age at which the burst occurs, its intensity, and the chemical composition could be adopted. In the middle panel, we plot the GALEX UV - V colors and the age of the sample studied by Rampazzo et al. (2007). The age is plotted as , where is the canonical age of 13 Gyr, and is derived from the index. In other words, all galaxies are supposed to have initiated their star formation history 13 Gyr ago.
The aim of this plot is to compare the observed properties of the galaxies with a typical star formation history of a galaxy which could have had an accretion episode which triggered a secondary star formation episode.
Since we do not have an age estimate for NGC 474, we indicate the (FUV-V) and (NUV-V) values for this galaxy with a dashed line. The galaxy’s colors are entirely consistent with those of other “normal” and shell galaxies. Without other elements, the color analysis suggests that NGC 474 could be explained equally well either as the result of a recent dry merger (it has neither cold nor warm gas associated, see e.g Rampazzo et al., 2006), or as an old accretion event, which is recorded in the shell system. Its (FUV-V) color is at the upper bound of the FUV-V colors observed for shell galaxies in the Rampazzo et al. (2007) sample: we therefore suggest an age Gyr, in analogy with the age range inferred from the line–strength indices for the shell galaxies in the above sample, which could be considered an upper limit to the true age of NGC 474.
In analogy with the previous panel we model the evolution of a galaxy in the (UVM2-R) vs. (TG-TSF) plane (Figure 10 right), and we compare the results with the NGC 7070A and ESO 2400100 data. The (UVM2-R) color, 4.10.5 and 3.30.5 for the southern and the northern nucleus of ESO 2400100, respectively, has a large uncertainty due to the limited resolution ( 2″) of the R-band images. The positions of the northern nucleus in the plot is consistent with a recent merging event that has rejuvenated its stellar population, unlike the southern one, which appears composed of an older stellar population. We do not have an independent estimate of the age of NGC 7070A, as for ESO 2400100, and unfortunately we cannot use the color to infer its age, since at about =3 the (UVM2-R) color saturates, and we can only constrain to be 3.
Given that no line-strength indices have been measured for NGC 7070A and NGC 474, and the comparison with the models does not provide a reliable age estimate, in the following section we use = 2.40.6 Gyr for them, inferred from the average of the age estimates for the shell galaxies in the Rampazzo et al. (2007) sample.
The discovery of a double nucleus in ESO 2400100 makes it a relatively peculiar and rare system among shell galaxies. Forbes et al. (1994) searched for double nuclei in 29 shell galaxies, and 20% of them with a “possible” secondary nucleus undergoing slow disruption. Assuming a shell lifetime of 1 Gyr (see e.g. Henquist & Quinn, 1987a; Nulsen, 1989) they estimate that the average lifetime of secondary nuclei is 200 Myr. The percentage provided by Forbes et al. (1994) is probably an upper limit - as they state. Recent high resolution HST analysis of shell galaxies (Sikkema et al., 2007) did not evidence the presence of double nuclei. In addition, both accretion models (Dupraz & Combes, 1986; Kojima & Noguchi, 1997, see e.g.) and observations (see e.g. Longhetti et al., 2000) indicate that shells are long lasting structures, i.e. the average shell lifetime is probably longer, on average, than 1 Gyr. The estimate of the average time before coalescence of the two nuclei is then very uncertain. However, the lower fraction of double nuclei shell galaxies, with respect to the Forbes et al. (1994) estimate, could be compensated by the longer shell life time in providing an average lifetime of a secondary nuclei not very different from the above value of 200 Myr.
As an alternative interpretation, the secondary nucleus in ESO 2400100 could be considered a chance superposition, e.g. with a group member (see e.g. Forbes et al., 1994). However, the kinematical analysis of Longhetti et al. (1998a) and Rampazzo et al. (2003) suggests that the two nuclei are strongly interacting, dismissing this alternative. The star formation history of the two interacting nuclei, as deduced from Figure 10, can be compared with the simulations for shell formation by Kojima & Noguchi (1997), which provide some predictions for the star formation in the smaller accreted satellite and for the time of formation and duration of the induced shells. In a radial merger, the star formation activity in the gas-rich satellite that was active before merging is completely truncated after its first passage through the primary member. The material that the primary member accretes from the satellite would produce regular shells several 108 year after the truncation of the star formation activity. In a prograde merger instead the star formation is triggered, but shells and loops start to develop only after the starburst phase is over. The duration of the shells is of the order of or slightly greater than 1 Gyr. The difference between different cases lies in the gas dynamics: gas could be pushed at large radii by the interaction decreasing the gas density or conveyed toward the center of the sinking satellite due to the deformation of the potential. Line-strength indices and UV observations suggest that the northern nucleus has had a very recent star formation episode. Therefore, in the framework provided by the Kojima & Noguchi (1997) simulations, we may be taking a snap-shot of an on-going accretion and shell formation event.
5.2 Does the X-ray luminosity evolve with time after a merging episode?
Our galaxies are located in low density environments, although they are all in poor galaxy structures: in particular, NGC 474 is member of a poor, probably evolving group (Rampazzo et al., 2006). Although at different levels, all are interacting systems, and as suggested by the previous section, relatively “young”, as measured by .
Age could be related to the X-ray emission in early-type galaxies, as suggested by Sansom et al. (2000) and O’Sullivan et al. (2001): early-type galaxies showing fine structure – like shells, dust-lane, etc. – or a younger spectroscopic age tend to have a smaller gaseous component, although the dispersion is very large.
All three shell galaxies have a relatively low gas content and low overall luminosity: the only evidence of a hot ISM in ESO 2400100, at a level of L erg s-1. NGC 474 is a relatively extreme case of low luminosity object devoid of gas (Rampazzo et al., 2006). NGC 7070A is dominated by a low luminosity nuclear component, and we could only assign a rather low limit to any plasma component. A few other examples of “young” and X-ray faint objects are available in the literature (e.g. Fabbiano & Schweizer, 1995). Recently O’Sullivan & Ponman (2004) detected 3 underluminous elliptical galaxies, NGC 3585, NGC 4494 and NGC 5322, all of which show evidence of recent dynamical disturbances, including kinematically distinct cores as in the case of NGC 474 (Hau et al., 1996).
We can analyze the X-ray luminosity in shell galaxies as a function of their “age”, in analogy to what Brassington et al. (2007) have done in their study of the evolution of the X-ray emission during a merging between gas rich, disk galaxies and compare then with the interaction/merging simulations developed by Cox et al. (2006) and D’Ercole et al. (2000).
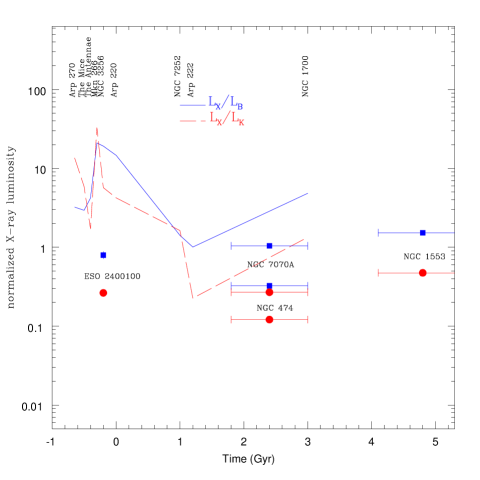
From their analysis of nine merging systems believed to represent different phases of a major merging process, Brassington et al. (2007) suggest that (1) the X-ray luminosity peaks 300 Myr before nuclear coalescence; (2) 1 Gyr after coalescence the merger remnants are fainter compared to mature ellipticals while (3) at a larger dynamical age (3 Gyr) remnants start to resemble typical ellipticals in their hot gas content. Based on this, the above authors agree with the idea of an halo regeneration with time. Can we extend this to early type galaxies, where minor merger and/or accretion events between gas-poor and smaller gas-rich satellites take place? Shell galaxies are a suitable set to be compared with the evolutionary picture discussed by Brassington et al. (2007): the shell systems presented above are very homogeneous, their luminosity profiles and dynamics suggest the presence of a disk, and the shells suggest that a recent accretion event has perturbed their potential. In addition, the rare case of the double nucleus in ESO 2400100 allows us to follow the X-ray luminosity evolution before the companion has been digested. We add another well studied shell system, NGC 1553, observed with Chandra by Blanton et al. (2001). NGC 1553 has optical properties in line with those of our sample: it is an S0 in a small group interacting with an elliptical companion, NGC 1549. Adopting a distance of 13.4 Mpc (Tully, 1988) we compute a X-ray luminosity in the range 0.3-6 keV of LX=2.16 erg s-1.
In Figure 11, adapted from Fig. 16 in Brassington et al. (2007), we plot the relation between the X-ray emission and the time elapsed from the merging episode for shell galaxies. As discussed in the previous section, for NGC 474 and NGC 7070A is the average age of the last star formation episode obtained from the comparison between models and our UV and optical data set. For ESO 2400100, we assume = -200 Myr as the age of coalescence. i.e. the estimated average lifetime of secondary nuclei made by Forbes et al. (1994). For NGC 1553, the study of line-strength indices by Annibali et al. (2007) provides an age of 4.80.7 Gyr as the age of the last burst of star formation.
Clearly the plane is very poorly sampled, both in and in number of objects at any given time (as in Brassington et al., 2007), so any intrinsic scatter cannot be accounted for. However, all shell galaxies appear systematically fainter than the gas rich systems, at very comparable levels (only a factor of a few in the different quantities plotted). ESO 2400100 is 1-2 orders of magnitude weaker that NGC 3256 or Mkn 266 in the pre-merging Brassington et al. (2007) sequence, where a peak in the relation is observed. The same is true for NGC 474 at the assumed age of 2-3 Gyr. The comparison with NGC 7070A is complicated by the presence of the nuclear source, which prevents us to obtain a reasonable estimate of a galactic component. In section 4.2 we have estimated an upper limit for the hot ISM of a few erg s-1. To estimate an upper limit to the emission from the binary population, we assume that their contribution would be at or lower than the unabsorbed power law component in the spectral fit (see section 4.2, Fig 4). This amounts to erg s-1, which is the value used in Fig. 11. With these values, NGC 7070A is comparable to NGC 474, at the same age. NGC 1553, the oldest system, is a factor of a few fainter than NGC 2434, the reference “prototypical” elliptical galaxy chosen by Brassington et al. (2007). We cannot ascribe these differences to the galaxy mass, since all appear to have a similar central velocity dispersions (see Tab. 1; =1803.9 for NGC 2434; note that =18020 km s-1 for NGC 1553, Rampazzo, 1988; Beuing et al., 2002).
All in all, it appears that any age effect on luminosity is significantly less evident in these systems compared to the Brassington et al. (2007) sequence. This is most likely related to the intrinsic properties of the two sets: in gas-rich systems, merging would trigger a significantly larger star formation episode, with the production of active binary systems and shock heating of the available gas. In gas poor systems, even the acquisition of a smaller gas rich object will have limited effects. There is however an intriguing difference in the gas content at different . Gas is found in ESO 2400100, before coalescence, and in NGC 1553, at a later stage, although at lower levels than the “prototypical” mature elliptical NGC 2434. This is in qualitative agreement with a picture in which several gigayears are required to refurbish a galaxy of a hot gaseous halo after a merging responsible for its depletion (Sansom et al., 2000; O’Sullivan et al., 2001), although the difference with NGC 2434 still remains to be properly understood.
Cox et al. (2006) examine the X-ray emission produced from hot gas during collision and mergers of disk galaxies. Models include the effects of radiative cooling, star formation, supernova feedback, and accreting super-massive black holes (BH). The gas emission predicted in either of their models, i.e. “with” and “without” the central accreting Black Hole, is significantly higher than observed in either NGC 474 or NGC 7070A (cf. Fig. 3 and Fig. 5 in Cox et al., 2006). Moreover, we notice that the X-ray emission of NGC 7070A is dominated by the AGN. The AGN contribution is not considered in the Cox et al. (2006) models since the central accreting BH in merger simulations remain obscured for the majority of their lifetime. On the contrary, ESO 2400100 appears to be more luminous than expected if we consider it a pre-merger, at age (see section 5.1).
No gas is detected in NGC 7070A or NGC 474: in the former this could easily be explained by the nuclear emission, that could be fueled by the ambient gas. Numerical simulations indicate that, in major mergers, roughly half the gas is quickly funneled to the centre, some causing a burst of star formation and much settling in a high surface density, mostly molecular central disc; the other half is ejected to large distances but remains bound to the merger remnant. This high angular momentum diffuse gas eventually falls back and may settle into a more extended, large-scale disc (Barnes, 2002; Bournaud et al., 2005; Naab et al., 2006). Several theoretical works suggest that galaxies of moderate optical luminosity and mass are likely to develop galactic outflows, capable of expelling most/all of the gas shed by evolving stars, even without resorting to the heating energy from a central AGN (Ciotti & Pellegrini, 1996; David et al., 2006). Partial or global galactic outflows could then also be invoked to explain the lack of a hot ISM in these galaxies. At the present time, a galactic outflow is observed only in NGC 3379, a very well studied nearby early-type galaxy, for which very deep Chandra observations are available (Trinchieri et al., 2008).
Our X-ray study shows that NGC 7070A hosts a moderate AGN activity. Does it fit in the X-ray luminosity evolutionary scheme? Among the galaxies considered by Brassington et al. (2007), Mkn 266 has a faint AGN, and Arp 220 possibly hosts a heavily shrouded AGN. They are in the pre-merging sequence, a few Myr before the coalescence of the nuclei. NGC 7070A is already a merger remnant.
Recently, Canalizo et al. (2007) found a well developed shell structure in the elliptical host of the QSO MC2 1635+119. To reproduce the elliptical host and its shells a simple N-body model gives an estimate between 30 Myr and 1.7 Gyr for the age of the merger under reasonable assumptions. On the other hand, the spectrum of the host galaxy is dominated by a population of an age of 1.4 Gyr, indicating a strong starburst episode that may have occurred at the time of the merger event. Although we do not have an accurate estimate from line-strength indices of the time at which the last episode of star formation in NGC 7070A has occurred, the average estimate of the last star formation episode adopted from the comparison of our UV data with models is consistent within the errors with the above estimate for QSO MC2 1635+119.
6 Summary and conclusions
We have studied the characteristics of the X-ray emission of two shell systems, NGC 7070A and ESO 2400100 using XMM-Newton. We also analyzed their far UV emission using the XMM-Newton Optical Monitor. We include another shell galaxy NGC 474, for which we have already presented the X-ray characteristics in Rampazzo et al. (2006), exploiting both original XMM-Newton OM images and GALEX archival data.
The XMM-Newton spatial and spectral analysis suggest that a nuclear source is the dominant component in NGC 7070A. In ESO 2400100, the emission is due to a low temperature plasma with a contribution from the collective emission of individual sources in the galaxy.
GALEX data of NGC 474 show that the extension of NUV emission is comparable with that of the optical image, while the FUV emission shows up only in the central regions of the galaxy. Also in the UVW1 and UVM2 filters NGC 474, ESO 2400100 and NGC 7070A have extensions similar to that of the optical image. XMM-OM UV images of ESO 2400100 show the presence of a double nucleus. The shape of the luminosity profiles suggest that a disk component is present, confirming the morphological classification provided by NED and the suggestion, from the kinematical study of Sharples et al. (1983), that NGC 7070A is an S0 seen face-on. This study further suggests that the prominent dust lane is not yet in equilibrium, indicating a recent accretion episode.
We model line–strength indices and the far UV - optical colors of the galaxies to infer the time elapsed from the last significant episode of star formation. From the comparison between our galaxies and shell galaxies in the Rampazzo et al. (2007) sample we suggest that the (UV - optical) colors of NGC 474 and NGC 7070A are consistent with a recent burst of star formation. We argue that the double nucleus in ESO 2400100 is indicative of an ongoing accretion event. The combined UV and line-strength indices analysis suggests indeed a very recent star formation episode in the northern nucleus (see also simulations by Kojima & Noguchi, 1997).
Using the above estimates of the time elapsed from the last significant episode of star formation we investigate whether the evolutionary scheme for gas-rich systems that would lead to mature ellipticals proposed by Brassington et al. (2007) could be applied to the same early-type galaxies undergoing merging episodes.
The time range is very poorly sampled, with only 4 objects, but we span almost the full range, since ESO 2400100 should be at Myr, i.e. before coalescence. We notice that shell galaxies are systematically underluminous relative to gas-rich systems at similar evolutionary stages, and that the or values vary only a factor of a few, compared to factors of 100. The only indication of a possible difference is in the gas content, which is present either before or several Gyr after coalescence. This is consistent with a picture in which several gigayears are required to refurbish a galaxy of a hot gaseous halos after a merging responsible for its depletion (Sansom et al., 2000; O’Sullivan et al., 2001).
To fully understand whether shell galaxies are the precursors of relaxed ellipticals, their more mature counterparts according to hierarchically evolutionary scenarios, we need to better define the dynamical and photometric time-scales of the accretion/merging event and understand whether there is an evolution of their X-ray properties linked to their “age” based on a larger and better studied sample of objects. The study of the UV emission in early-type galaxies in connection with optical line-strength indices (see e.g. Rampazzo et al., 2007) could provide useful insight for timing their photometric evolution.
Acknowledgements.
We acknowledge partial financial support of the Agenzia Spaziale Italiana under contract ASI-INAF contract I/023/05/0. RG and RR acknowledge the support and kind hospitality of INAF-Osservatorio Astronomico di Padova and Institut für Astronomie der Universität der Wien, respectively. We thank Dr. Nora Loiseau of XMM-Newton User Support Group for her skillful assistance. GALEX is a NASA Small Explorer, launched in April 2003. GALEX is operated for NASA by California Institute of Technology under NASA contract NAS-98034. This research has made use of the SAOImage DS9, developed by Smithsonian Astrophysical Observatory and of the NASA/IPAC Extragalactic Database (NED) which is operated by the Jet Propulsion Laboratory, California Institute of Technology, under contract with the National Aeronautics and Space Administration. IRAF is distributed by the National Optical Astronomy Observatories, which are operated by the Association of Universities for Research in Astronomy, Inc., under cooperative agreement with the National Science Foundation. The Digitized Sky Survey (DSS) was produced at the Space Telescope Science Institute under U.S. Government grant NAG W-2166. The images of these surveys are based on photographic data obtained using the Oschin Schmidt Telescope at the Palomar Observatory and the UK Schmidt Telescope. The plates were processed into the present compressed digital form with the permission of these institutions.References
- Aarseth & Fall (1980) Aarseth, S.J. & Fall, S.M. 1980, ApJ, 236, 43
- Annibali et al. (2007) Annibali, F., Bressan, A., Rampazzo, R., Danese, L., Zeilinger, W.W. 2006, A&A, 463, 455
- Balcells et al. (2001) Balcells, M., van Gorkom, J.H., Sancisi, R., Del Burgo, C. 2001, AJ 122, 1758
- Barnes (1985) Barnes J. MNRAS, 215, 517
- Barnes (1992) Barnes J. 1992, ApJ, 393, 484
- Barnes (2002) Barnes J. 2002, MNRAS, 333, 481
- Beuing et al. (2002) Beuing, J., Bender, R., Mendes de Oliveira, C., Thomas, D., Maraston, C. 2002, A&A, 395, 431
- Blanton et al. (2001) Blanton, E.L., Sarazin, C.L., Irwin, J.A. ApJ, 552, 106
- Bournaud et al. (2005) Bournaud A&A, 437, 69
- Brassington et al. (2007) Brassington, N. J., Ponman, T. J., & Read, A. M. 2007, MNRAS, 377, 1439
- Bregman et al. (1992) Bregman J.N. et al. 1992, ApJ, 397, 484
- Bressan et al. (1994) Bressan, A., Chiosi, C., & Fagotto, F. 1994, ApJS, 94, 63
- Brosch et al. (1985) Brosch, N., Greenberg, J. M., & Grosbol, P. J. 1985, A&A, 143, 399
- Canalizo et al. (2007) Canalizo, G., Bennert, N., Jungwiert, B., Stockton A., Schweizer, F., Lacy, M., Peng, C. 2007, ApJ, 669, 801
- Cappellari et al. (2006) Cappellari, M., Bacon, R., Bureau M., Damen, M. C., Davies, R. L., de Zeeuw, P. T., Emsellem, E., Falcon-Barroso, J., Krajnovic, D., Kuntschner, H., McDermid, R. M., Peletier, R. F., Sarzi M., van den Bosch, R. C. E. & van de Ven, G. 2006, MNRAS, 366, 1151
- Charmandaris et al. (2000) Charmandaris, V., Combes, F., van der Hulst, J.M. 2000, A&A 356, L1
- Ciotti & Pellegrini (1996) Ciotti, L., & Pellegrini, S. 1996, MNRAS, 279, 240
- Colbert et al. (2001) Colbert, J.W., Mulchaey J.S., Zabludoff, A. 2001, AJ, 121, 808
- Combes et al. (1995) Combes, F., Rampazzo, R., Bonfanti, P. P., Pringniel, P., & Sulentic, J. W. 1995, A&A, 297, 37
- Cox et al. (2006) Cox, T.J., Di Matteo T., Hernquist L., Hopkins P.F., et al. 2006, ApJ, 643, 692
- David et al. (2006) David, L. P., Jones, C., Forman, W., Vargas, I. M., & Nulsen, P. 2006, ApJ, 653, 207
- D’Ercole et al. (2000) D’Ercole, A., Recchi, S., Ciotti, L. 2000, ApJ, 533, 799
- Dickey & Lockman (1990) Dickey, John M. & Lockman, Felix J., 1990, ARA&A 28, 215.
- Dupraz & Combes (1986) Dupraz C., Combes F. 1986, AAS, 166, 53
- Ebeling et al. (2006) Ebeling, H., White, D. A., Rangarajan, F. V. N. 2006, MNRAS, 368, 65
- Fabbiano & Schweizer (1995) Fabbiano, G., & Schweizer, F. 1995, ApJ, 447, 572
- Fabian et al. (1980) Fabian, A.C., Nulsen, P.E.J., Stewart, G.C. 1980, Nature, 287, 613
- Forbes et al. (1994) Forbes, D.A., Thomson R.C., Groom, W., Williger, G.M. 1994, AJ, 107, 1713
- Greggio (2005) Greggio, L. 2005, ASPC, 342, 459
- Hau et al. (1996) Hau, G.K.T., Balcells, M., Carter, D. 1996, Proc. IAU Symp. 171, ed. R. Bender and R. Davies, 338
- Helsdon et al. (2001) Helsdon, S.F., Ponman, T.J., O’Sullivan, E., Forbes, D.A. 2001, MNRAS, 325, 693
- Henquist & Quinn (1987a) Hernquist L., Quinn P. 1987a, ApJ, 312, 1
- Henquist & Quinn (1987b) Henquist L., Quinn P. 1987b, ApJ, 312, 17
- Hernquist & Spergel (1992) Hernquist L., Spergel, D.N. 1992, ApJ, 399, L117
- Hernquist & Mihos (1995) Hernquist L., Mihos, C. 1995, AJ, 110, 140
- Hibbard et al. (2005) Hibbard, J.E. et al. 2005, ApJ, 619, L87
- Humphrey & Buote (2006) Humphrey P.H., Buote D.A. 2006, ApJ, 639, 136
- Jedrzejewski (1987) Jedrzejewski, R., 1987, MNRAS, 226, 747
- Karachentsev (1987) Karachentsev I.D. 1987, Dvoinye Galaktiki, (Nauka Moskow)
- Kojima & Noguchi (1997) Kojima, M., Noguchi, M. 1997, ApJ, 481, 132
- Lauberts & Valentijn (1989) Lauberts, A., Valentijn, E.A. 1989, The surface photometry catalogue of the ESO-Uppsala galaxies, ESO Publications
- Longhetti et al. (1998a) Longhetti, M., Rampazzo, R., Bressan, A., Chiosi, C. 1998a, A&AS 130, 251
- Longhetti et al. (1998b) Longhetti, M., Rampazzo, R., Bressan, A., Chiosi, C. 1998b, A&AS 130, 267
- Longhetti et al. (1999) Longhetti, M., Bressan, A., Chiosi, C., Rampazzo, R. 1999, A&A 345, 419
- Longhetti et al. (2000) Longhetti M., Bressan A., Chiosi C., Rampazzo R. 2000, A&A, 353, 917
- Malin & Carter (1983) Malin D., Carter D.F. 1983, ApJ, 274, 534
- Martin et al. (2005) Martin, D.C., et al. 2005, ApJ, 619, L1
- Mason et al. (2001) Mason, K.O., Breeveld, A., Much, R., et al. 2001, A&A, 365, 36
- Mathews & Brighenti (2003) Mathews W.G., Brighenti F. 2003, ARA&A, 41, 191
- Merritt (1985) Merritt, D. 1985, ApJ, 289, 18
- Morrissey et al. (2005) Morrissey P., et al. 2005, ApJ, 619, L7
- Morrissey et al. (2007) Morrissey, P., et al. 2007, ApJS, 173, 682
- Mulchaey (2000) Mulchaey, J.S. 2000, ARAA, 38, 289
- Naab et al. (2006) Naab, MNRAS, 372, 839.
- Nulsen (1989) Nulsen, P.E.J. 1989, ApJ, 346, 690
- Oosterloo et al. (2002) Oosterloo, T.A., Morganti, R., Sadler, E.M., Vergani, D., Caldwell, N. 2002, AJ, 123, 729
- O’Sullivan et al. (2001) O’Sullivan, E., Forbes, D.A., Ponman, T.J. 2001, MNRAS, 328, 461
- O’Sullivan et al. (2003) O’Sullivan et al. 2003, MNRAS, 349, 535
- O’Sullivan & Ponman (2004) O’Sullivan, E., Ponman, T.J. 2004, MNRAS, 349, 535
- Peng et al. (2002) Peng, C. Y., Ho, L. C., Impey, C. D. & Rix, H. 2002, AJ, 124, 266
- Pierfederici & Rampazzo (2004) Pierfederici, F., Rampazzo, R. 2004, AN, 325, 359
- Quinn (1984) Quinn, P.J. 1984, ApJ279, 596
- Rampazzo (1988) Rampazzo, R. 1988, A&A, 204, 81
- Rampazzo et al. (2003) Rampazzo, R., Plana, H., Longhetti, M., Amram, P., Boulesteix, J., Gach, J.-L., Hernandez, O. 2003, MNRAS, 343, 819
- Rampazzo et al. (2006) Rampazzo, R., Alexander, P., Carignan, C., Clemens, M.S., Cullen, H. et al. 2006, MNRAS, 368, 851
- Rampazzo et al. (2007) Rampazzo, R., Marino, A., Tantalo, R., Bettoni, D., Buson, L.M., Chiosi, C., Galletta, G., Grützbauch, R., Rich, R.M. 2007, MNRAS, in press
- Reduzzi et al. (1996) Reduzzi, L., Longhetti, M., Rampazzo R. 1996, MNRAS, 282, 149
- Sadler, Jenkins & Kotanyi (1989) Sadler, E.M., Jenkins, C.R., Kotanyi, C.G. 1989, MNRAS, 240, 591
- Sansom et al. (2000) Sansom A.E., Hibbard J.E., Schweizer F. 2000, AJ, 120, 1946
- Schiminovich et al. (1994) Schiminovich, D., van Gorkom, J.H., van der Hulst, J.M., Kasow, S 1994 ApJ 423, L101
- Schiminovich et al. (1995) Schiminovich, D., van Gorkom, J.H., van der Hulst, J.M., Malin, D.F. 1995, ApJ 444, L77
- Seigar (2005) Seigar, M.S. 2005, MNRAS, 354, 375
- Serra & Trager (2007) Serra, P., Trager, S.C. 2007, MNRAS, 374, 769
- Sharples et al. (1983) Sharples, R. M., Carter, D., Hawarden, T. G., & Longmore, A. J. 1983, MNRAS, 202, 37
- Shombert & Wallin (1987) Shombert, J.M., Wallin, J.F. 1987, AJ 94, 300
- Schweizer (1992) Schweizer, F. 1992, in Structure, Dynamics and Chemical Evolution of Elliptical galaxies, ed.s I.J. Danziger, W.W Zeilinger and K. Kjär, ESO/IPC, 651
- Schweizer (1998) Schweizer, F. 1998, Galaxies: Interactions and Induced Star Formation, Saas-Fee Advanced Course 26. Lecture Notes 1996. Swiss Society for Astrophysics and Astronomy, XIV, Edited by R. C. Kennicutt, Jr. F. Schweizer, J. E. Barnes, D. Friedli, L. Martinet, and D. Pfenniger. 404 pp., 214 figs. Springer-Verlag Berlin/Heidelberg; ISBN: 3-540-63569-6, 1998., p.105
- Sersic (1968) Sersic, J. L. 1968, Atlas de Galaxias Australes, Osservatorio Astronomico, Cordoba
- Sikkema et al. (2007) Sikkema, G., Carter, D., Peletier, R.F., Balcells, M., del Burgo, C., Valentijn E.A. 2007, A&A, 467, 1011
- Tantalo & Chiosi (2004b) Tantalo, R., & Chiosi, C. 2004b, MNRAS, 353, 917
- Thomson (1991) Thomson R.C. 1991, MNRAS, 253, 256
- Thomson & Wright (1990) Thomson, R.C., Wright, 1990, MNRAS 224, 895
- Trinchieri et al. (2008) Trinchieri, G., Pellegrini, S., Fabbiano, G., et al. 2008, ApJ, submitted.
- Tully (1988) Tully, R.B. 1988, Nearby Galaxy Catalogue, Cambridge University Press
- Turnbull et al. (1999) Turnbull, A.J., Bridges, T.J., Carter, D. 1999, MNRAS 307, 967
- Weil & Hernquist (1993) Weil, M.L., Hernquist, L. 1993, ApJ, 431, 79
- Wilkinson et al. (2000) Wilkinson, A. et al. 2000, MNRAS 319, 977
- Williams & Christiansen (1985) Williams, R.E., Christiansen W.A. 1985, ApJ, 291, 80