Globular Clusters in the Outer Galactic Halo: AM-1 and Palomar 14 ††thanks: Based on observations with the NASA/ESA Hubble Space Telescope, obtained at the Space Telescope Science Institute, which is operated by AURA, Inc., under NASA contract NAS 5-26555, under program GO-6512.
Abstract
AM-1, at 120 kpc, and Pal 14, at 70 kpc, are two of the most distant Galactic globular clusters known. We present Hubble Space Telescope WFPC2 photometry of AM-1 and Pal 14 that reveals unprecedented depth and detail in the color-magnitude diagrams of these two clusters. Absolute and relative age measurements confirm that both are younger than the inner halo globular cluster M 3 by 1.5–2 Gyr assuming all three clusters have similar compositions. Thus AM-1 and Pal 14 join Pal 3, Pal 4, and Eridanus (studied by Stetson et al.) as distant Galactic globular clusters with red horizontal branches and young ages relative to the inner halo. Within the context of the entire body of research on the ages of second parameter globular clusters, the observed correlation between age and horizontal branch morphology suggests that age is the best candidate for the second parameter. However, this conclusion is tempered by the lack of precise chemical abundance determinations for a significant fraction of second parameter globular clusters.
1 Introduction
The second parameter phenomenon, a long-standing problem in Galactic astronomy, recognizes that the horizontal branch (HB) morphology of Galactic globular clusters (GCs) cannot be explained by the first parameter, metallicity, alone: at least one more factor, a ‘second parameter,’ must be involved.
In a landmark study, Searle & Zinn (1978) demonstrated that GCs inside the solar circle (which they deemed the inner halo) exhibit a tight correlation between [Fe/H] and HB morphology while those that lie outside the solar circle (the outer halo) show no such well-defined trend. This in turn led Searle & Zinn (1978) to theorize that the formation of the Galaxy was a prolonged, complex process.
While the second parameter phenomenon has informed our understanding of galaxy formation, the identity of the second parameter remains a topic of some debate. A number of candidates have been suggested including age, helium abundance, CNO abundances, cluster central density, and stellar rotation (see Fusi Pecci et al. (1996) for a review). It is clear that its influence grows with distance from the Galactic center (Searle & Zinn, 1978; Zinn, 1980; Lee, Demarque, & Zinn, 1994). To gain a better understanding of the second parameter it is logical to carefully examine the most distant GCs. Only six known GCs inhabit the Galaxy at distances greater than 50 kpc (Harris, 1996) 111References to the Harris catalog actually refer to the February 2003 revision that can be found at http://www.physics.mcmaster.ca/harris/mwgc.dat. and five of the six are prime examples of second parameter GCs, i.e. metal poor GCs with red HBs.
All six of the GCs with 50 kpc: Pal 14, NGC 2419, Eridanus, Pal 3, Pal 4, and AM-1 (listed in order of increasing ) have been observed by the Hubble Space Telescope (HST) using the Wide Field Planetary Camera 2 (WFPC2). Harris et al. (1997) presented a HST/WFPC2 color-magnitude diagram (CMD) of NGC 2419—the only one with 50 kpc and a blue HB—and concluded that it is roughly coeval with the old, metal poor cluster M 92. In contrast, Stetson et al. (1999, hereafter S99) presented HST/WFPC2 CMDs of Pal 3, Pal 4, and Eridanus and concluded that these clusters are younger than relatively nearby clusters of similar metallicities (M 3 and M 5) by 1.5–2 Gyr assuming the inner and outer halo GCs have similar abundances.
The two remaining GCs, AM-1 and Pal 14, are the subject of this paper. AM-1 was classified as a GC by Madore & Arp (1979) though it had been observed previously and named ESO 201-10 by Holmberg et al. (1975). Madore & Arp (1979) estimated the distance to AM-1 at 300 kpc and, although it has since been revised downward to 120 kpc (Aaronson et al., 1984; Ortolani, 1985; Madore & Freedman, 1989; Hilker, 2006), it is still the most distant Galactic GC known. Age estimates for AM-1 have proved uncertain to date because none of the published photometry has reached the main sequence. Pal 14, at 70 kpc, was discovered by van den Bergh in 1958 and later classified as a GC by Arp & van den Bergh (1960); it is also known as AvdB. Sarajedini (1997) published the deepest CMD of Pal 14 to date, reaching more than a magnitude fainter than the main sequence turn off (MSTO), and concluded that Pal 14 is 3–4 Gyr younger than inner halo GCs with similar metallicities.
We describe the observations and data reduction in 2 and present the WFPC2 CMDs of AM-1 and Pal 14 in section 3. Available information regarding the reddening and metallicity of both clusters is discussed in 4 followed by relative and absolute age analyses in 5. The results are discussed and put into context in 6 and the paper concludes with a summary in 7.
2 Observations and Data Reduction
The observations used in the present study were obtained with HST/WFPC2 as part of program number GO-6512 (PI: Hesser) during cycle 6. Table 1 shows the observing log. The 36 AM-1 and 14 Pal 14 images were retrieved from the HST archive and calibrated using the pipeline bias and flat-field procedures.
The stellar photometry was performed with the HSTPhot software (Dolphin, 2000) which is designed especially for WFPC2 observations. A number of preprocessing steps were performed before applying HSTPhot. First, image defects such as bad and saturated pixels were masked using the data quality files available for each WFPC2 image. Cosmic rays and hot pixels were flagged using tasks within HSTPhot. Next, the positional offsets between each image and a reference image were measured using the IMEXAMINE task in IRAF. These were input into the multiphotometry mode of HSTPhot in order to measure the magnitudes of all detected profiles on each image. The measurements were done using point spread functions (PSFs) that accompany the HSTPhot software employing the ‘weighted PSF fitting mode’ which places more weight on the central pixels in a profile and less on the outer pixels.
The instrumental magnitudes were transformed to the native WFPC2 VEGAmag system as well as the ground-based Johnson-Cousins VI system using equations included in HSTPhot. The final set of standardized photometry was extracted from the results file by selecting only those stars with ’Object Codes’ that suggest a well-measured star-like profile. The object codes from HSTPhot are defined and described in the work of Dolphin (2000). These come from a comparison of the values of the fits using a stellar profile, a single pixel without a background, and a flat profile representing an extended object. For detections where the stellar profile fits best, one of three star classes is assigned to the object that characerize the probability that the object is either: a single star (object code = 1), an unresolved binary (object code = 2), or a line-of-sight binary (object code = 3). In this work, we have selected only those detections with object code equal to one for further analysis.
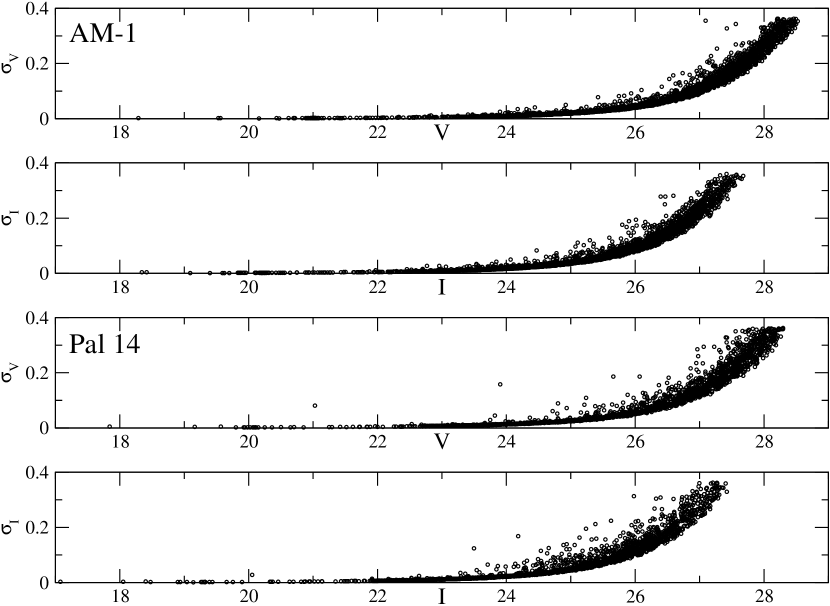
Figure 1 shows how the photometric errors in both bands behave as a function of apparent magnitude. In the plot, F555W and F814W are referred to as V and I, respectively. For AM-1 the average photometric errors are 0.002 in both bands at the level of the HB and rise to 0.011 mag in F555W and 0.012 mag in F814W at the level of the MSTO. For Pal 14 the average photometric errors are 0.002 mag in both bands at the level of the HB and rise to 0.007 mag in F555W and 0.008 mag in F814W at the level of the MSTO. As Figure 1 demonstrates, the scatter in photometric errors is somewhat greater in Pal 14 than in AM-1.
3 Color-Magnitude Diagrams
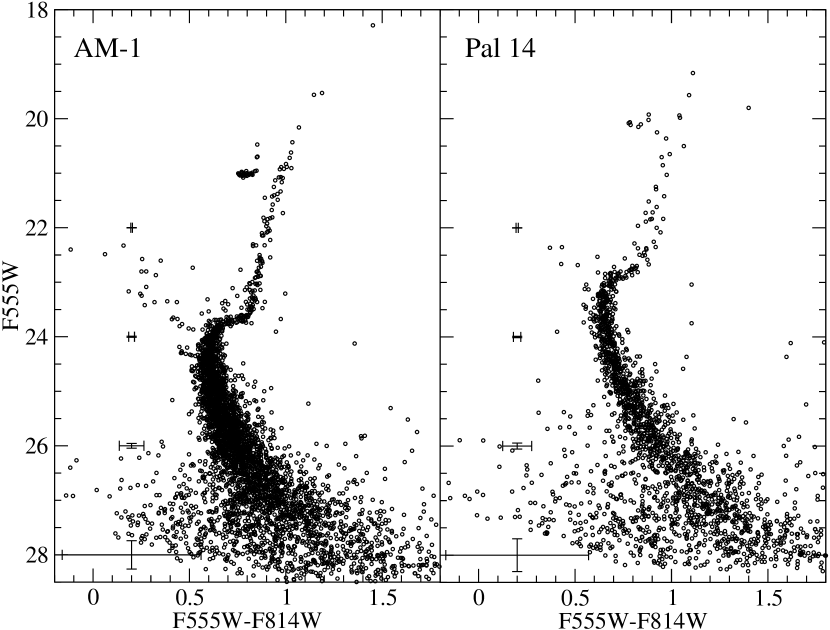
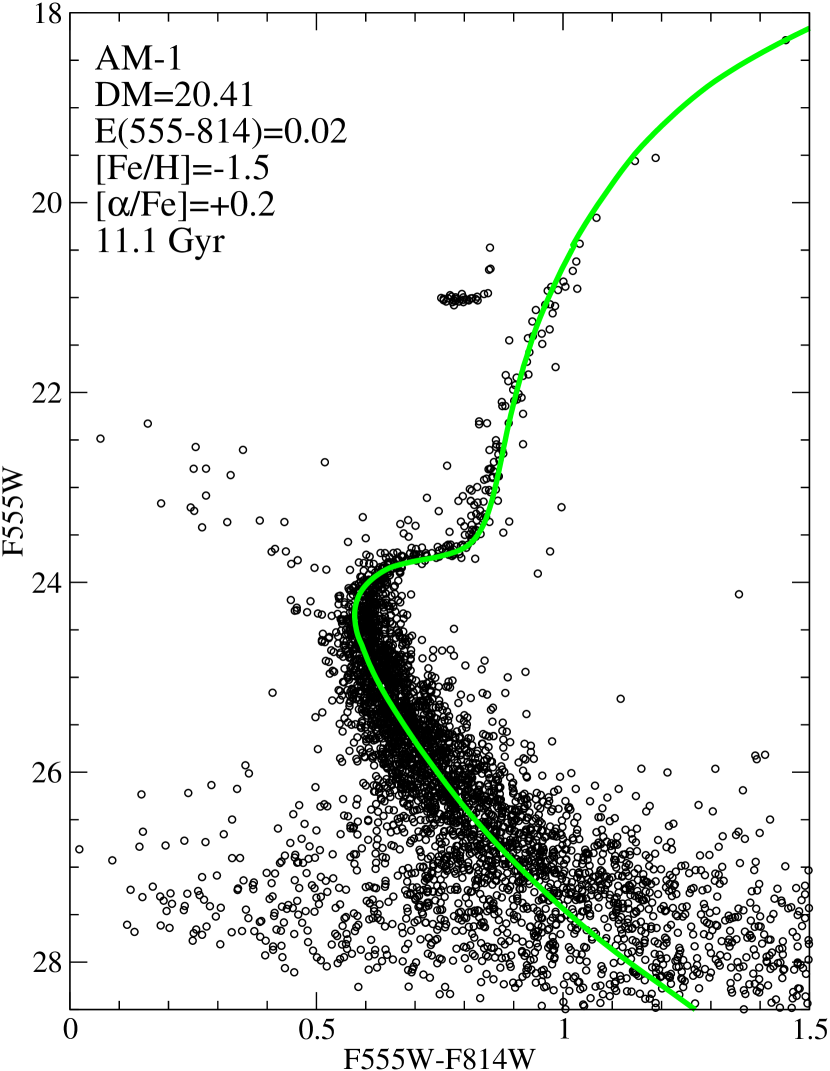
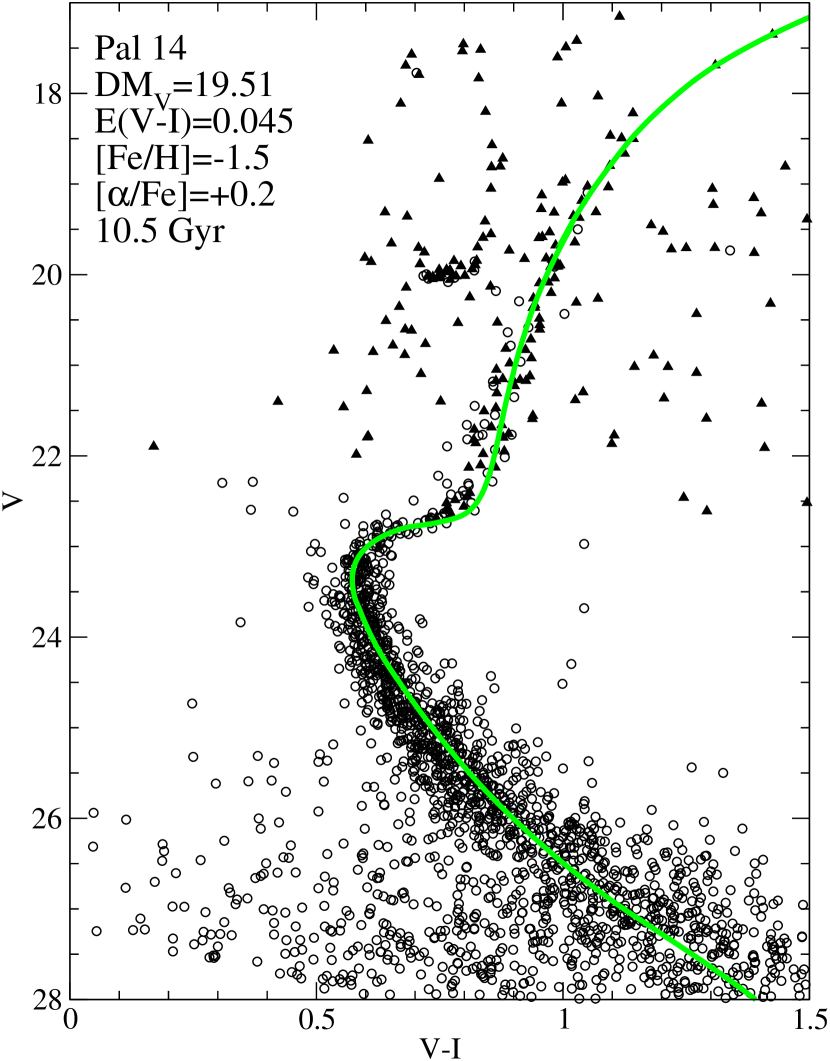
The WFPC2 F555W–F814W CMDs of AM-1 and Pal 14 are presented in Figure 2. Both CMDs are remarkably free of field star contamination. Figure 2 also indicates the average photometric errors by showing error bars at F555W=22, 24, 26, and 28 towards the left side of each panel. The CMD of AM-1 (left panel of Figure 2) includes over 4,000 stars and extends from the brightest giant at F555W 18.5 down to approximately F555W = 29 though the main sequence becomes washed out by F555W 27. The figure shows a well-populated MS and lower red giant branch (RGB), a tight red clump at F555W 21, and a significant population of blue stragglers. The right panel of Figure 2 shows over 2,000 stars in Pal 14. It exhibits a narrow MS that extends about 5 mags below the turnoff. Stars brighter than the turnoff are relatively rare in Pal 14 and thus the red clump and RGB are not as well-defined as in AM-1. Pal 14 contains a handful of blue stragglers.
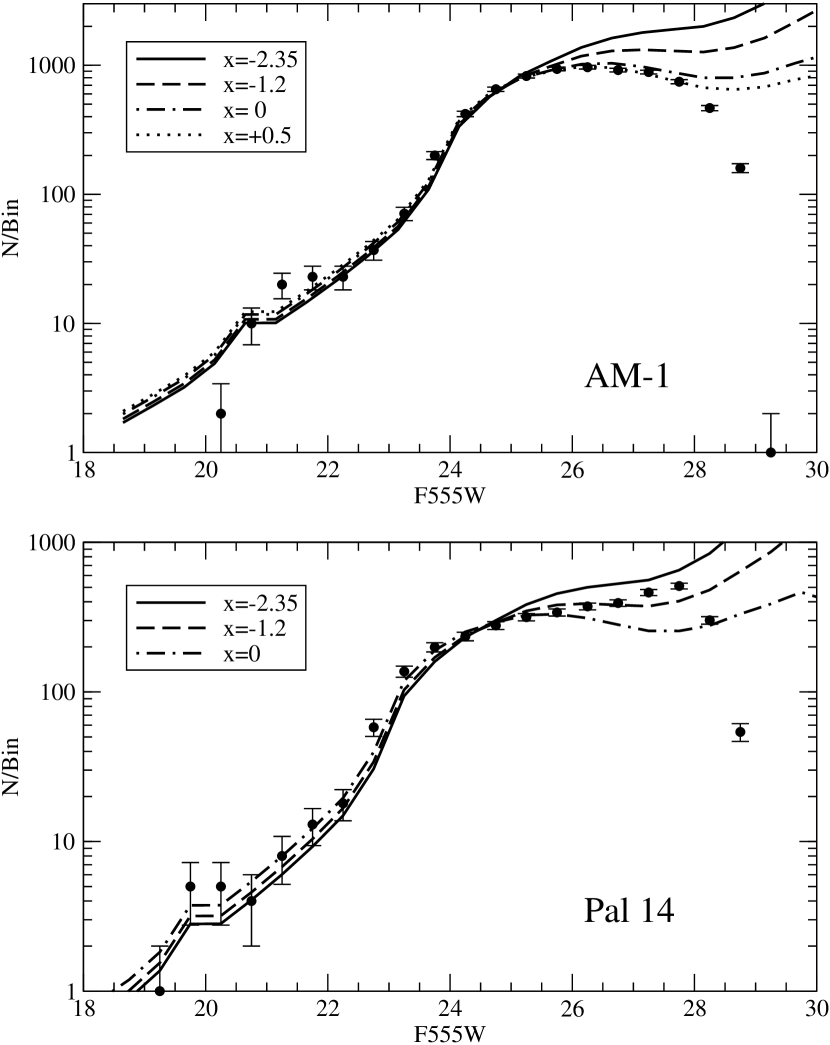
Figure 3 presents F555W luminosity functions (LFs) of AM-1 and Pal 14 but we stress that these results are preliminary and not corrected for incompleteness. The error bars are . Plotted along with the observed LFs are model LFs based on the isochrone fitting described in 5.2 and assuming power-law mass functions (MFs). In this paper, the power-law MF takes the form dN/dMMx where x is referred to as the power-law slope. The model LFs were normalized to the clusters by matching the number of stars within 1 mag of the MSTO. In the top panel, the AM-1 LF is fit well by models with a flat (x=0) or positive power-law MF. In the bottom panel, the LF of Pal 14 indicates a negatively sloped MF but here the model fits are worse than for AM-1. This is related to the flat appearance of the Pal 14 LF (in the logarithmic plot) between V=23 and 28. The models, regardless of power-law slope, suggest more curvature in this region. The unusual LF of Pal 14 deserves further attention and will likely be improved by data covering more of the cluster.
4 Reddening and Metallicity
Before we can measure relative cluster ages we need to adopt a reddening and metallicity for each cluster in our sample, including our comparison cluster, for which we have selected the well-known Galactic globular M 3. No single spectroscopic study encompasses AM-1, Pal 14, and M 3. However, with M 3 measured by Zinn & West (1984, hereafter ZW84), AM-1 measured by Suntzeff et al. (1985) using the same spectral features as ZW84, and Pal 14 measured by Armandroff et al. (1992), there is something approacing a common scale. Armandroff et al. (1992) found good agreement between their [Fe/H] values and ZW84 for clusters that appeared in both studies.
Table 2 shows the distance moduli from Harris (1996), reddening estimates from the Schlegel et al. (1998) dust maps, metallicities from the sources cited in the previous paragraph, and the iron and -element abundances for M 3 from Pritzl, Venn, & Irwin (2005, hereafter PVI). PVI determined abundances by averaging high resolution spectroscopic measurements from 36 stars in M 3. The PVI abundances are likely the most accurate available for M 3 and were adopted for the purpose of isochrone fitting in 5. Since the metallicities listed in column three of Table 2 for each cluster agree to within 0.1 dex, and certainly to within the quoted errors, it is reasonable to differentially compare these three GCs. It should also be noted that Hilker (2006) determined that a Yonsei–Yale isochrone (Kim et al., 2002) with [Fe/H] = –1.4 and [/Fe] = +0.3 at 11 Gyr provided the best fit to the RGB. Since the photometry presented by Hilker (2006) for AM-1 did not reach the MSTO we do not consider this result—at least regarding the age—to be well–constrained.
Since the observational data considered in this paper are in either the ground-based V–I or WFPC2 F555W–F814W color and the reddening estimates are given in E(B–V) it is necessary to convert them. Bessell et al. (1998) determined E(V–I)/E(B–V) = 1.32 + 0.06(V–I) for stars with spectral types from B to K. Since we are interested in colors lying between 0.5 V–I 1.5, we chose (V–I) = 1 as the average color and thus adopted E(V–I) = 1.38 E(B–V). In the native HST/WFPC2 photometric system, we take E(F555W–F814W) = 1.2 E(B–V) from Table 13 of Holtzman et al. (1995).
5 Cluster Age Determinations
5.1 The Horizontal Method
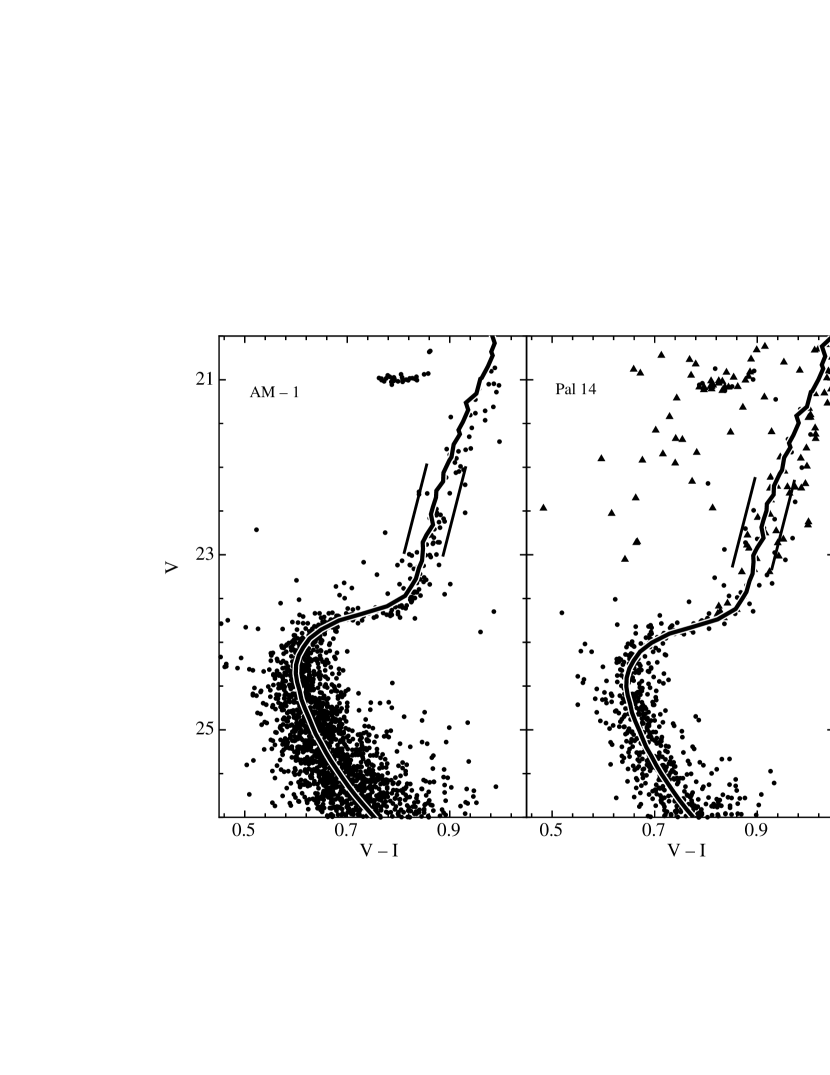
We begin by employing the relative age-dating technique known as the horizontal method pioneered by Sarajedini & Demarque (1990) and VandenBerg et al. (1990, hereafter VBS). Adopting the approach advocated by VBS (also used by S99), we register the photometry of each program cluster and the fiducial sequence of a comparison cluster with similar metal abundance using the color of the MSTO and the magnitude at a point on the main sequence that is 0.05 mag redder than the MSTO. Once registered in this manner, younger clusters will have redder RGBs than older ones.
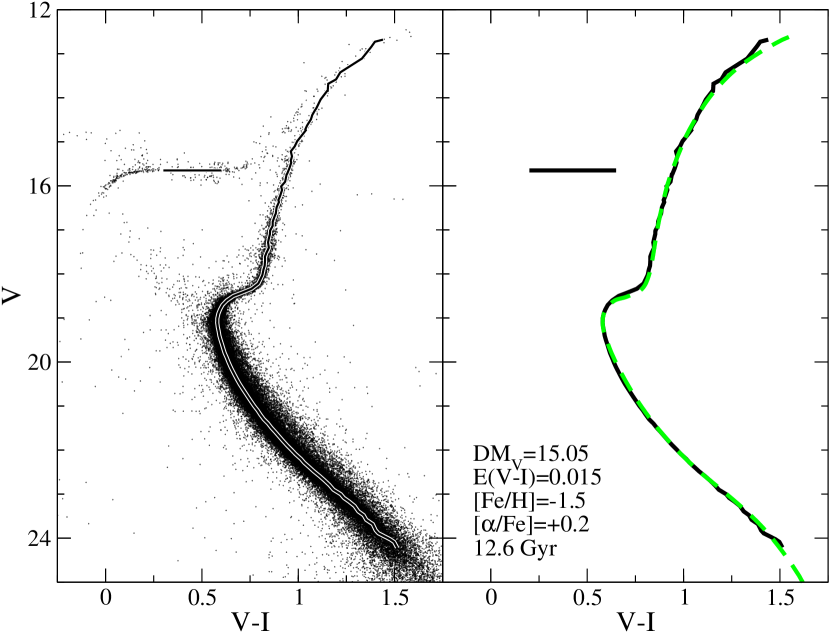
For our comparison cluster, M 3, the CMD used to construct a fiducial sequence was taken from the ACS Survey of Galactic GCs (Sarajedini et al., 2007). For direct comparison with the data presented in this paper, the ACS data were converted from F606W and F814W to ground-based V and I using the transformation equations in Sirianni et al. (2005). A fiducial was constructed using only stars with photometric errors less than 0.05 mag in both bandpasses. The high quality CMD and the fiducial sequence of M 3 are shown in the left panel of Figure 4. We now proceed to compare this sequence to the photometric data of our program clusters.
The left panel of Figure 5 shows our photometry for AM-1 and the fiducial sequence of M 3 matched using the prescription of VBS while the right panel of the same figure illustrates the comparison of Pal 14 with M 3 matched in the same manner. Note that the evolved stars in Pal 14 are relatively few in number (see Figure 2). As a result, we have augmented the WFPC2 photometry (circles) with ground-based photometric standard stars reported by Stetson (2000, triangles). We have offset the WFPC2 data in color and magnitude to match the photometric zero point of the ground-based data. Specifically,
| (1) | |||
| (2) |
The lines parallel to the fiducial RGBs represent the locations of clusters that are 2 Gyr older (left) and 2 Gyr younger (right) than the comparison cluster. The 2 Gyr lines were derived by applying the VBS method to [Fe/H]=–1.5, [/Fe]=+0.2 isochrones from Dotter et al. (2008) with ages ranging from 10 to 14 Gyr. From the isochrones we found that V–I decreases by 0.0197 mag per Gyr and thus the lines were plotted at 0.04 mag on either side of the M 3 fiducial.
The RGBs of AM-1 and Pal 14 suggest that these clusters are 1–2 Gyr younger than M 3. Figure 5 shows that the RGB stars in AM-1 lie to the red of the M 3 fiduical sequence. The case of Pal 14 is less concrete due to the lack of a well-defined sequence of stars. The trend in Pal 14 is more obvious if one considers the range from V=20 to 22. These relative age statements depend on the assumption that the program clusters and M 3 share similar chemical compositions.
5.2 Isochrone Fitting
Before the isochrone fitting results are presented, two points regarding the CMDs of AM-1 and Pal 14 need to be made. First, we have elected to present the isochrone analysis of the AM-1 CMD in the native HST/WFPC2 system because no published ground-based VI photometry exists for this cluster, which would allow us to check our photometric zero point. Second, as we did in the application of the horizontal method in the previous section, we will use the ground-based Pal 14 data to better define the location of the evolved-star sequences.
Theoretical isochrones from the Dartmouth Stellar Evolution Database 222http://stellar.dartmouth.edu/models/(Dotter et al., 2007, 2008) were used in the analysis. These isochrones employ state of the art input physics and include partially inhibited diffusion and gravitational settling of He and metals (Chaboyer et al., 2001) and a model atmosphere based surface boundary condition. The reader is referred to Dotter et al. (2007, 2008) for a full discussion of their properties. These models have been tabulated in 0.5 Gyr intervals but, for the purpose of fitting isochrones to fiducials and CMDs, the isochrones have been interpolated to produce a finer grid spacing of 0.1 Gyr in order to allow for more precise age constraints.
Adopting the PVI abundances of M 3 and starting with the distance and reddening estimates in Table 2, we then vary the age, distance, and reddening until a satisfactory correspondence is achieved between the main sequence of the cluster and the isochrone, making sure that the point 2 mag below the MSTO (i.e., 6) matches the data. This is the same procedure followed by Sarajedini et al. (2007). The results of isochrone fitting are collected in Table 3 and shown in the right panel of Figure 4, Figure 6, and Figure 7. In short, we find that Pal 14 is younger than AM-1 by 0.5 Gyr if both clusters have similar abundances.
The distance and reddening estimates derived from the isochrone fits provides a check on the fitting method. Comparing the reddening estimates derived from isochrone fitting in Table 3 to the values listed in Table 2, we find that differences in the reddening values are within the expected uncertainty in a given reddening of 0.02 mag in E(B–V). As with the reddenings, the isochrone-based distances listed in Table 3 generally agree with those in Table 2 to within the expected error of 0.1 mag in distance modulus.
5.3 Consistency Check on the Ages
Thus far we have presented two types of age analyses, the horizontal VBS method and isochrone fitting, to probe the ages of AM-1 and Pal 14 relative to M 3. Both methods suggest that the program clusters, which exhibit HBs that are predominantly redward of the RR Lyrae instability strip, are 1–2 Gyr younger than the comparison cluster, M 3, which exhibits stars on the red and blue portions of the HB. In this section, our aim is to provide a consistency check of those results using the method employed by Sarajedini, Lee, & Lee (1995). This method compares the relative locations of the MSTO in two clusters whose CMDs have been properly registered as described in more detail below.
Since all three clusters have similar metallicities, we expect them to have comparable HB absolute magnitudes and RGB colors at the level of the HB. This is slightly modulated by the fact that cluster age also affects the level of the red clump and the color of the RGB. The former has been calibrated by Crowl et al. (2001) to be 0.028 mag/Gyr for ages older than 5 Gyr and metallicities below [Fe/H] –1.0. The latter can be assessed using our isochrones from which we find a variation of 0.003 mag/Gyr in the V–I color of the RGB at the level of the HB.
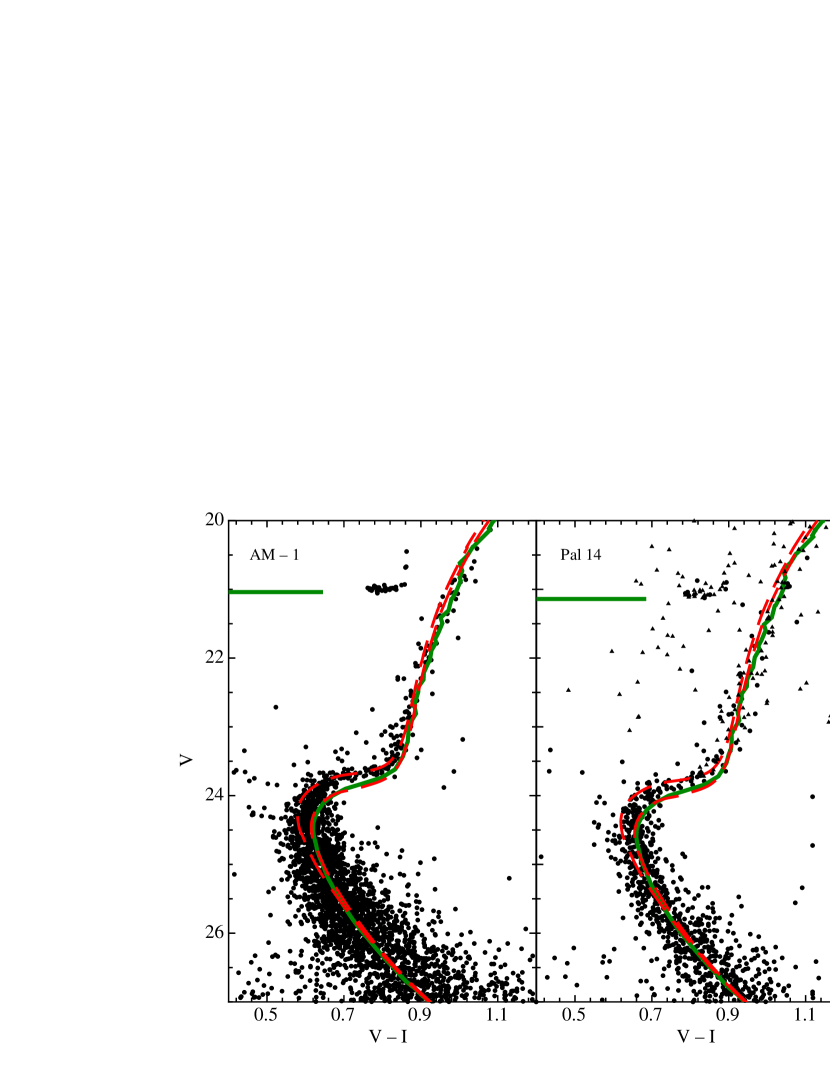
With these guidelines in mind, we proceed to use the measured HB magnitudes and RGB colors of AM-1, Pal 14, and M 3 along with their relatives ages (Table 3) to shift them to the same distance and reddening scale. This allows us to compare their MSTO/SGB locations with each other as shown in Fig. 8. We see that the turnoff regions of both AM-1 and Pal 14 are demonstrably brighter than M 3. Also included in Fig. 8 are Dotter et al. (2008) isochrones with [Fe/H]=–1.5 and [/Fe]=+0.2 at 10.6 and 12.6 Gyr (the best-fit age to the M 3 fiducial and 2 Gyr younger). The MSTO regions of AM-1 and Pal 14 are consistent with ages that are 1–2 Gyr younger than M 3, in agreement with the horizontal method and isochrone fitting.
As we close out this section, it is important to reiterate that the age estimates presented in this paper are accurate only to the extent that AM-1, Pal 14, and M 3 have similar compositions. In order to gauge the effect of changing either [Fe/H] or [/Fe] we use an isochrone with [Fe/H]=–1.5 and [/Fe]=+0.2 at 12 Gyr as the baseline and search for an isochrone with the same separation between the MSTO and the base of the RGB at different compositions. An increase (decrease) in [/Fe] of 0.2 dex causes the age to decrease (increase) by 0.5 Gyr. If [Fe/H] increases by 0.2 dex, then the age decreases by 0.5 Gyr but if [Fe/H] decreases by the same amount, then the age increases by 1 Gyr. Our age measurements must be viewed with some caution until more conclusive abundances can be derived for the sample clusters.
6 Discussion
We provide strong evidence that AM-1 and Pal 14 join the S99 sample of Pal 3, Pal 4, and Eridanus in having younger ages than comparable inner halo GCs. Hence all five GCs with 50 kpc and red HBs are younger than their counterparts with bluer HBs in the inner halo. These five GCs are second parameter clusters (in the sense that they have redder HBs at a given metallicity than the inner halo trend would suggest) and all have been demonstrated to have relatively young ages. This makes a strong case for age as the second parameter in the outer halo. Can we make a case for age as the second parameter throughout the Galaxy - i.e. among the entire sample of Galactic globular clusters?
Mackey & van den Bergh (2005, see their Table 1) presented a compilation of parameters (e.g. , HB type, [Fe/H]) for the entire Galactic GC population. In addition, each is assigned to a sub-population based on the categories introduced by Zinn (1993) along with the addition of two categories not available in 1993: GCs associated with the Sagittarius dwarf galaxy and GCs containing multiple stellar populations. According to the Zinn (1993) classification, GCs that follow the inner halo trend of HB type vs. [Fe/H] belong to the “Old Halo” (OH) while those that diverge from this trend by a certain amount (or more) belong to the “Younger Halo” (YH).
The YH clusters are synonymous with the second parameter phenomenon and while they dominate the OH population at large , the vast majority of them have 50 kpc. Thus the outer halo clusters may not be a representative sample of the entire YH population but there is evidence for age as the second parameter among GCs with 50 kpc as well. Among these, GCs such as Ruprecht 106 (Buonanno et al., 1993), IC 4499 (Ferraro et al., 1995), Palomar 12 (Stetson et al., 1989), and Pyxis (Sarajedini & Geisler, 1996) have been shown to be younger than inner halo GCs with similar metallicities and bluer HB morphologies. This trend is also seen through the detailed examination of ‘second parameter pairs’ such as NGC 288 and NGC 362 (Sarajedini & Demarque, 1990, VBS) or M 3 and M 13 (Rey et al., 2001). At the same time, accurate abundance determinations of second parameter GCs (particularly the more distant ones) are desperately needed. Accurate abundances for the YH population, coupled with a systematic age analysis of these clusters, will provide deeper insight into the Galactic GC population and the nature of the second parameter.
We note in passing that Mackey & van den Bergh (2005) do not consider Pal 12 to be a member of the YH population because of its supposed association with the Sgr dwarf spheroidal galaxy. However, Pal 12 is spatially distinct from the main body of Sgr so that we can consider it to be a member of the Milky Way halo. In any case, if the hypothesis of Searle & Zinn (1978) and the implications of the analysis performed by Mackey & van den Bergh (2005) are correct—that all of the YH clusters originated in (now disrupted) dwarf spheroidal galaxies—then we have no choice but to consider clusters like Pal 12 part of the Milky Way’s YH population and thus part of the Milky Way halo.
7 Conclusion
Color magnitude diagrams of AM-1 and Pal 14 from HST/WFPC2 F555W–F814W photometry were presented. The CMDs reveal unprecedented depth, reaching 4 mag below the MSTO in both clusters. AM-1 and Pal 14 have very similar CMD morphologies. AM-1 shows a more densely populated RGB and HB, albeit with very few bright red giants, and an impressive display of blue stragglers. Pal 14 has a sparsely populated RGB and HB which is likely due to its large size (compared to the area covered by WFPC2) and low density.
Three different age measurement techniques reveal that AM-1 and Pal 14 are 1.5–2 Gyr younger than M 3 assuming all three GCs have similar compositions. Isochrone fitting suggests that if AM-1 and Pal 14 have similar abundances, then Pal 14 is about 0.5 Gyr younger than AM-1. S99 found that Pal 3, Pal 4 and Eridanus are also 1.5–2 Gyr younger than inner halo GCs of comparable metal abundance. Thus all five of the GCs with 50 kpc and red HBs are 1.5–2 Gyr younger than GCs with similar metallicities in the inner halo (to the extent that assumptions regarding similar abundances are valid).
The variation of the second parameter phenomenon with has been known for some time, but the identity of the second parameter itself remains a topic of active debate in the literature, even some 40 years after it was discovered. When combined with previously published results on the ages of clusters that exhibit the second parameter effect, the present study provides further evidence that age is a strong candidate for the second parameter. However, there are a significant number of globular clusters important to identifying the second parameter that have not been accurately age-dated. Of equal importance is the precise determination of abundances in these clusters. Improvements to both the total metal abundance and the abundance ratios in these clusters will lead to more appropriate comparisons with well-studied, nearby GCs and theoretical models and, ultimately, to a better understanding of the second parameter phenomenon and the formation history of the Galactic halo.
References
- Aaronson et al. (1984) Aaronson, M., Schommer, R. A., Olszewski, E. W. 1984, ApJ, 276, 221
- Armandroff et al. (1992) Armandroff, T. E., Da Costa, G. S., & Zinn, R. J. 1992, AJ, 104, 164
- Arp & van den Bergh (1960) Arp, H. C. & van den Bergh, S. 1960, PASP, 72, 48
- Bessell et al. (1998) Bessell, M. S., Castelli, F. & Plez, B. 1998, A&A, 333, 231
- Buonanno et al. (1993) Buonanno, R., Corsi, C. E., Fusi Pecci, F., Richer, H. B., & Fahlman, G. G. 1993, AJ, 105, 184
- Chaboyer et al. (2001)
- Crowl et al. (2001) Crowl, H. H., Sarajedini, A., Piatti, A. E., Geisler, D., Bica, E., Claria, J. J., Santos, J. F. C., Jr. 2001, AJ, 122, 220
- Dolphin (2000) Dolphin, A. E. 2000, PASP, 112, 1383
- Dotter et al. (2007) Dotter, A., Chaboyer, B., Jevremović, D., Baron, E., & Ferguson, J. W., Sarajedini, A., & Anderson, J. 2007, AJ, 134, 376
- Dotter et al. (2008) Dotter, A., Chaboyer, B., Jevremović, D., Kostov, V., Baron, E., & Ferguson, J. W. 2008, ApJS, in press
- Ferraro et al. (1995) Ferraro, I., Ferraro, F. R., Fusi Pecci, F., Corsi, C. E., & Buonanno, R. 1995, MNRAS, 275, 1057
- Fusi Pecci et al. (1996) Fusi Pecci, F., Bellazzini, M., Ferraro, F. R., Buonanno, R., & Corsi, C. E. 1996, ASPC, 92, 221
- Girardi et al. (2000) Girardi, L., Bressan, A., Bertelli, G., & Chiosi, C. 2000, A&AS, 141, 371
- Harris (1996) Harris, W. E. 1996, AJ, 112, 1487
- Harris et al. (1997) Harris, W. E., Bell, R. A., VandenBerg, D. A., Bolte, M., Stetson, P. B., Hesser, J. E., van den Bergh, S., Bond, H. E., Fahlman, G. G., & Richer, H. B. 1997, AJ, 114, 1030
- Hilker (2006) Hilker, M. 2006, A&A, 448, 171
- Holmberg et al. (1975) Holmberg, E. B., Lauberts, A., Schuster, H. E. & West, R. M. 1975, A&A, 22, 327
- Holtzman et al. (1995) Holtzman, J. A., Burrows, C. J., Casertano, S., Hester, J. J., Trauger, J. T., Watson, A. M., & Worthey, G. 1995, PASP, 107, 1065
- Kim et al. (2002) Kim, Y., Demarque, P., Yi, S. K., & Alexander, D. R. 2002, ApJS, 143, 499
- Lee, Demarque, & Zinn (1994) Lee, Y. W., Demarque, P., Zinn, R. J. 1994, ApJ, 423, 248
- Mackey & van den Bergh (2005) Mackey, A. D. & van den Bergh, S. 2005, MNRAS, 360, 631
- Madore & Arp (1979) Madore, B. F. & Arp, H. C. 1979, ApJ, 227, 103
- Madore & Freedman (1989) Madore, B. F. & Freedman, W. L. 1989, ApJ, 340, 812
- Ortolani (1985) Ortolani, S. 1985, A&A, 137, 269
- Pritzl, Venn, & Irwin (2005) Pritzl, P. J., Venn, K. A., & Irwin, M. 2005, AJ, 130, 2140 (PVI)
- Rey et al. (2001) Rey, S. -C¿, Yoon, S. -J, Lee, Y. -W., Chaboyer, B., & Sarajedini, A. 2001, AJ, 122, 3219
- Salpeter (1955) Salpeter, E. E. 1955, ApJ, 121, 161
- Sarajedini (1997) Sarajedini, A. 1997, AJ, 113, 682
- Sarajedini & Demarque (1990) Sarajedini, A. & Demarque, P. 1990, ApJ, 365, 219
- Sarajedini & Geisler (1996) Sarajedini, A. & Geisler, D. 1996, AJ, 112, 2013
- Sarajedini et al. (2007) Sarajedini, A. et al. 2007, AJ, 133, 1658
- Sarajedini, Lee, & Lee (1995) Sarajedini, A., Lee, Y. W., & Lee, D. H. 1995, ApJ, 450, 712
- Schlegel et al. (1998) Schlegel, D. J., Finkbeiner, D. P., & Davis, M. 1998, ApJ, 500, 525
- Searle & Zinn (1978) Searle, L. & Zinn, R. 1978, ApJ, 225, 357
- Sirianni et al. (2005) Sirianni, M. et al. 2005, PASP, 117, 1049
- Stetson (2000) Stetson, P. B. 2000, PASP, 112, 925
- Stetson et al. (1989) Stetson, P. B., Hesser, J. E., Smith, G. H., VandenBerg, D. A., & Bolte, M. 1989, AJ, 97, 1360
- Stetson et al. (1999) Stetson, P. B., Bolte, M., Harris, W. E., Hesser, J. E., van den Bergh, S., VandenBerg, D. A., Bell, R. A., Johnson, J. A., Bond, H. E., Fullton, L. E., Fahlman, G. G., & Richer, H. B. 1999, AJ, 117, 247 (S99)
- Suntzeff et al. (1985) Suntzeff, N., Olszewski, E., Stetson, P. B. 1985, AJ, 90, 1481
- VandenBerg et al. (1990) VandenBerg, D. A., Bolte, M., & Stetson, P. B. 1990, AJ, 100, 445 (VBS)
- Zinn (1980) Zinn, R. 1980, ApJ, 241, 602
- Zinn (1993) Zinn, R. 1993, ASPC, 48, 38
- Zinn & West (1984) Zinn, R. & West, M. J. 1984, ApJS, 55, 45 (ZW84)
| Cluster | Date | Filter | Exposure Time |
|---|---|---|---|
| AM–1 | 1999 June | F555W | 4 x 180s |
| 1 x 900s | |||
| 8 x 1000s | |||
| 5 x 1300s | |||
| F814W | 4 x 230s | ||
| 5 x 1200s | |||
| 4 x 1300s | |||
| 5 x 1400s | |||
| Palomar 14 | 1999 July | F555W | 4 x 160s |
| 1 x 900s | |||
| 7 x 1000s | |||
| F814W | 4 x 230s | ||
| 4 x 1100s | |||
| 2 x 1200s | |||
| 2 x 1300s |
| Name | E(B–V) | [Fe/H] | [Fe/H]PVI | [/Fe]PVI | |
|---|---|---|---|---|---|
| M 3 | 15.12 | 0.013 | –1.660.06 | –1.50 | +0.22 |
| AM-1 | 20.43 | 0.008 | –1.70.2 | ||
| Pal 14 | 19.47 | 0.035 | –1.600.18 |
| Name | DMV | E(B–V) | Age (Gyr) | Rel. Age (Gyr) |
|---|---|---|---|---|
| M 3 | 15.05 | 0.011 | 12.6 | |
| AM-1 | 20.41 | 0.016 | 11.1 | –1.5 |
| Pal 14 | 19.51 | 0.033 | 10.5 | –2.1 |