Variations on Debris Disks: Icy Planet Formation at 30–150 AU for 1–3 M⊙ Main Sequence Stars
Abstract
We describe calculations for the formation of icy planets and debris disks at 30–150 AU around 1–3 M⊙ stars. Debris disk formation coincides with the formation of planetary systems. As protoplanets grow, they stir leftover planetesimals to large velocities. A cascade of collisions then grinds the leftovers to dust, forming an observable debris disk. Stellar lifetimes and the collisional cascade limit the growth of protoplanets. The maximum radius of icy planets, 1750 km, is remarkably independent of initial disk mass, stellar mass, and stellar age. These objects contain 3%–4% of the initial mass in solid material. Collisional cascades produce debris disks with maximum luminosity times the stellar luminosity. The peak 24 m excess varies from 1% times the stellar photospheric flux for 1 M⊙ stars to 50 times the stellar photospheric flux for 3 M⊙ stars. The peak 70–850 m excesses are 30–100 times the stellar photospheric flux. For all stars, the 24–160 m excesses rise at stellar ages of 5–20 Myr, peak at 10–50 Myr, and then decline. The decline is roughly a power law, with 0.6–1.0. This predicted evolution agrees with published observations of A-type and solar-type stars. The observed far-IR color evolution of A-type stars also matches model predictions.
1 INTRODUCTION
During the past 25 years, observations from IRAS, ISO, and Spitzer have revealed substantial mid-infrared (mid-IR) excesses associated with hundreds of normal main sequence stars (e.g., Backman & Paresce, 1993; Habing et al., 2001; Rieke et al., 2005; Bryden et al., 2006; Moór et al., 2006; Rhee et al., 2007a). Current samples include stars with spectral types A–M and ages 5 Myr to 10 Gyr (e.g., Chen et al., 2005; Kim et al., 2005; Rieke et al., 2005; Beichman et al., 2006; Su et al., 2006; Hillenbrand et al., 2008). Although binary stars and single stars in dense clusters and in the field are roughly equally likely to have IR excesses (Stauffer et al., 2005; Su et al., 2006; Bryden et al., 2006; Gorlova et al., 2006; Currie et al., 2007a; Siegler et al., 2007; Trilling et al., 2007), the frequency of excess emission declines from 30%–40% for A-type stars (Su et al., 2006) to 10%–20% for solar-type stars (Greaves & Wyatt, 2003; Trilling et al., 2008; Meyer et al., 2008). Thus, this phenomenon is common among main sequence stars and may depend on stellar mass.
High quality images demonstrate that dust orbiting the central star produces the excesses (Smith & Terrile, 1984; Brandeker et al., 2004; Stapelfeldt et al., 2004; Kalas, 2005; Meyer et al., 2007). In Pic and AU Mic, the dust is in a geometrically thin, edge-on disk with an outer radius of 200–1000 AU (Smith & Terrile, 1984; Telesco et al., 1988; Golimowski et al., 1993; Kalas et al., 2004; Liu, 2004; Augereau & Beust, 2006). In these disks, the small scale height of the dust, 0.1, is consistent with material in roughly circular orbits (e.g., Backman & Paresce, 1993; Kalas et al., 2004, and references therein). Although broad tori of dust are visible in many other systems (e.g. Greaves et al., 1998; Augereau et al., 1999; Holland et al., 2003; Kalas et al., 2006; Su et al., 2006; Fitzgerald et al., 2007), narrow rings of dust produce the emission in PsA and HR 4796A (Jayawardhana et al., 1998; Schneider et al., 1999; Greaves et al., 2000; Telesco et al., 2000; Kalas et al., 2005). For systems with face-on rings and tori, the total emission constrains the scale height, 0.1. Thus, the dust in these systems is as highly flattened as the structures in Pic and AU Mic.
Broadband spectral energy distributions constrain the luminosity, size, temperature, and total mass of the dust (Backman & Paresce, 1993; Lagrange et al., 2000; Dent et al., 2000; Wolf & Hillenbrand, 2003). Some stars have excesses from grains plausibly associated with the terrestrial zone (e.g., Beichman et al., 2005; Absil et al., 2006; Currie et al., 2007b; Rhee et al., 2007b; Meyer et al., 2008; Lisse et al., 2007c). Optically thin emission from cooler material with temperature 20–150 K is more typical (e.g. Su et al., 2006; Trilling et al., 2008; Hillenbrand et al., 2008). For systems with submm observations, the measured fluxes suggest grains with sizes 1 m–1 cm and total mass 0.01 M⊕ (Liu et al., 2004; Najita & Williams, 2005; Chen et al., 2006; Williams & Andrews, 2006). The grains have compositions similar to dust in the asteroid belt, comets, or the trans-Neptunian region of the Solar System (Grün et al., 1995; Brownlee et al., 1997; Lisse et al., 2007a, b). Because the dust mass in these systems lies between the initial mass of solids in protostellar disks ( 100–1000 M⊕; Natta et al., 2000; Andrews & Williams, 2005) and the dust mass in the Solar System ( M⊕; Hahn et al., 2002; Landgraf et al., 2002; Nesvorný et al., 2006), the dusty structures in these systems are often called ‘debris disks’ (Backman & Paresce, 1993; Lagrange et al., 2000).
In addition to the dust properties, several other observations suggest plausible links between debris disks and the formation of planetary systems. Observations of A-type stars suggest a ‘rise and fall’ of debris disk emission (Currie et al., 2008a), with a clear increase in the typical 24 m excess at 5–10 Myr, a peak at 10–20 Myr, and a decline for 20–30 Myr. The rise in debris disk emission roughly coincides with the disappearance of optically thick emission from protostellar disks (e.g. Haisch, Lada, & Lada, 2001; Sicilia-Aguilar et al., 2006; Hernández et al., 2006; Currie et al., 2007a, c). The broad plateau occurs at a time when radiometric dating (Yin et al., 2002) and theory (Chambers, 2001; Kenyon & Bromley, 2006) suggest the Earth contained 90% of its final mass. The decline of dusty debris around A-type stars is at roughly the same time as a gradual decrease in the cratering rate of objects in the Solar System (Swindle, 1993; Melosh, Vickery, & Tonks, 1993; Wadhwa & Russell, 2000; Koeberl, 2003). These results suggest that the evolution of dust in debris disks parallels the evolution of larger solid objects in the Solar System.
Simple physical arguments also link debris disks with the formation of planetary systems. Because radiation removes 1–100 m grains on timescales shorter than the stellar age, some process replenishes the dust. To maintain the observed dust masses for long timescales, normal stars must have a large reservoir, 10–100 M⊕, of unseen objects that continuously collide at large velocities and fragment into smaller objects. Remnant material from planet formation satisfies both needs. The growth of 1000 km or larger planets in a disk of small grains naturally leaves behind an ensemble of ‘leftover’ 1–10 km ‘planetesimals’ on eccentric orbits (Kenyon & Bromley, 2004a, 2004b). For a mass of 10–100 M⊕ in leftovers, high velocity collisions produce enough dust for most debris disks (e.g., Backman & Paresce, 1993; Habing et al., 2001; Kenyon & Bromley, 2004b). If this interpretation is correct, debris disks provide conclusive evidence for the formation of Pluto-mass or larger planets around many, if not most, main sequence stars.
In addition to these considerations, numerical calculations suggest that an evolving swarm of 1–10 km planetesimals explains several observed trends in the properties of debris disks. Starting with an ensemble of 1 km-sized planetesimals, Kenyon & Bromley (2002b, 2004a, b, 2005) show that collisions and mergers form 500–1000 km-sized objects in 1–50 Myr. These protoplanets stir up leftover planetesimals along their orbits. Destructive collisions among the leftovers then produce a collisional cascade – where collisions gradually grind large objects into smaller ones – along with copious amounts of dust (see also Williams & Wetherill, 1994; Durda & Dermott, 1997; Quillen et al., 2007). Dominik & Decin (2003), Wyatt et al. (2007a), and Löhne et al. (2008) show that collisional evolution in a belt of high velocity planetesimals naturally produces a dust luminosity that declines roughly inversely with time (see also Kenyon & Bromley, 2002a, 2004b, 2005), explaining the observed time evolution – , with 0.5–1 – suggested by recent observations of A-type stars (e.g., Kalas, 1998; Habing et al., 2001; Decin et al., 2003; Greaves & Wyatt, 2003; Rieke et al., 2005; Rhee et al., 2007a). To account for the large observed range of IR excesses among stars of similar ages, Wyatt et al. (2007a) propose belts with a range of initial masses and semimajor axes, as suggested from submm observations of protostellar disks (Andrews & Williams, 2005, 2007b).
Here, we continue to explore the evolution of dusty debris arising from planet formation in a disk of icy planetesimals. Our suite of calculations for disks at 30–150 AU around 1–3 M⊙ stars yields robust predictions for the maximum sizes of icy planets as a function of semimajor axis and stellar age. Results for the long-term evolution of IR excesses account for many fundamental aspects of the data. These calculations are the first to explain the ‘rise and fall of debris disks’ around A-type stars (Currie et al., 2008a) and the apparent peak in the 70–160 m excesses of G-type stars with ages of 100 Myr (Hillenbrand et al., 2008). Comparisons between our models and current observations suggest that the minimum stable grain size and the slope of the IR emissivity law are critical parameters.
The models suggest a set of further critical observations. Spatially resolved images of debris disks around A-type and solar-type stars can improve our understanding of the minimum stable grain size. Larger samples of debris disks with high quality submm data from ALMA, Herschel, and SOFIA can place better constraints on the slope of the emissivity law. Together, these data can test our predictions for the time evolution of debris disk emission around 1–3 M⊙ stars and provide input for more complete calculations that include the formation and dynamical evolution of giant planets.
We outline our model in §2. We describe results for the formation of icy planets in §3 and the evolution of debris disks in §4. After discussing several applications of our calculations in §5, we conclude with a brief summary in §6.
2 THE MODEL
Kenyon & Bromley (2001, 2002a, 2004a, 2004c) and Bromley & Kenyon (2006) describe our hybrid multiannulus numerical model for planetesimal growth. Kenyon & Luu (1998, 1999), Kenyon & Bromley (2001, 2002a), and Bromley & Kenyon (2006) compare results with analytical and numerical calculations. We adopt the Safronov (1969) statistical approach to calculate the collisional evolution of an ensemble of planetesimals in orbit around a star of mass (see also Spaute et al., 1991; Weidenschilling et al., 1997; Krivov et al., 2006; Thébault & Augereau, 2007; Löhne et al., 2008). The model grid contains concentric annuli with widths centered at semimajor axes . Calculations begin with a differential mass distribution ) of objects with horizontal and vertical velocities and relative to a circular orbit. The horizontal velocity is related to the orbital eccentricity, = 1.6 , where is the circular orbital velocity in annulus . The orbital inclination depends on the vertical velocity, = sin.
The mass and velocity distributions evolve in time due to inelastic collisions, drag forces, and gravitational forces. For inelastic collisions, we solve the coagulation equations for a particle in mass batch of annulus colliding with another particle in mass batch of annulus ,
| (1) |
| (2) |
where is time, is the total mass in mass bin in annulus , is the cross-section, for and , and for and any . The terms in these equations represent (i) mergers of and into a body of mass , (ii) loss of through mergers with other objects, (iii) addition of mass from debris produced by the collisions of other objects (Kenyon & Luu, 1999), and (iv) loss of mass by gas drag (Kenyon & Luu, 1998). In each equation, the second term includes the possibility that a collision can produce debris but no merger (rebounds; see Davis et al., 1985; Kenyon & Luu, 1999, and references therein).
The collision cross-section is
| (3) |
where is a constant (Wetherill & Stewart, 1993; Kenyon & Luu, 1998), = is the mutual scale height, and are the average heliocentric distance and width for the two interacting annuli, is the average angular velocity, is the relative particle velocity, is the gravitational focusing factor, and and are the particle radii. We adopt the piecewise analytic approximation of Spaute et al. (1991) for the gravitational focusing factor in the dispersion regime and the collisional cross-sections of Greenberg et al. (1991) in the shear-dominated regime (see also Greenzweig & Lissauer, 1990, 1992). For more details of this algorithm, see Kenyon & Luu (1998), Kenyon & Bromley (2002a), Kenyon & Bromley (2004a), and Bromley & Kenyon (2006).
To choose among possible collision outcomes, we use an energy-scaling algorithm. If is the collision energy needed to eject half the mass of a pair of colliding planetesimals and is the center of mass collision energy, the mass of the ejecta is
| (4) |
where and are the masses of the colliding planetesimals. This approach allows us to derive ejected masses for catastrophic collisions with and cratering collisions with (see also Wetherill & Stewart, 1993; Stern & Colwell, 1997; Kenyon & Luu, 1999). Consistent with N-body simulations of collision outcomes (e.g., Benz & Asphaug, 1999), we set
| (5) |
where is the radius of a merged object with mass + , is the mass density of a planetesimal, is the bulk component of the binding energy, and is the gravity component of the binding energy.
Kenyon & Bromley (2005) and Kenyon et al. (2008) describe how collisional evolution depends on various choices for . For icy objects, detailed numerical collision simulations yield erg cm g-1, 0, 1–2 g cm-3, 1–2 erg cm g-2, and 1–2 (e.g., Benz & Asphaug, 1999; Leinhardt et al., 2008). Calculations for the breakup of comet Shoemaker-Levy 9 suggest a smaller component of the bulk strength, erg g-1 (e.g., Asphaug & Benz, 1996), which yields smaller disruption energies for smaller objects. Because nearly all models for collisional disruption yield similar results for objects with 1 km (e.g., Kenyon & Bromley, 2004c; Kenyon et al., 2008), collisional evolution is relatively independent of these uncertainties as planetesimals grow into larger objects. Thus, we choose standard values – = 1.5 erg cm1.75 g-2, = 1.5 g cm-3, and = 1.25 – for the gravity component of . To check how the evolution of the small planetesimals depends on , we consider a broad range in the bulk component of the strength, = 1– erg g-1 with = 0 (Pan & Sari, 2005; Kenyon & Bromley, 2004c, 2005; Kenyon et al., 2008).
To compute velocity evolution, we include collisional damping from inelastic collisions, gas drag, and gravitational interactions. Our equations for the evolution of the velocity dispersion are
| (6) |
for the horizontal component and
| (7) |
for the vertical component, where the subscripts refer to the contributions from collisional damping (‘in’), gas drag (‘gd’), and long-range (‘lr’) and short-range (‘sr’) gravitational interactions.
For collisional damping, we adopt
| (8) |
and
| (9) |
where , , and is the volume density of planetesimals with mass in annulus (Ohtsuki, 1992; Wetherill & Stewart, 1993). In the second summation, when ; = when (see also Kenyon & Luu, 1998, 1999). We add a term, , to treat the overlap between adjacent zones; = 1 when and when j (Kenyon & Bromley, 2001). The integrals and are elliptic integrals described in previous publications (Wetherill & Stewart, 1993; Stewart & Ida, 2000; Ohtsuki, Stewart, & Ida, 2002).
For velocity damping from gas drag, we follow Wetherill & Stewart (1993) and write
| (10) |
and
| (11) |
where = 0.5 is the drag coefficient, , is the gas density, is the relative gas velocity, and is the mean relative velocity of the gas (see Adachi et al., 1976; Weidenschilling, 1977b; Wetherill & Stewart, 1993).
For gravitational interactions, we compute long-range stirring from distant oligarchs (Weidenschilling, 1989) and short-range stirring from the swarm (Ohtsuki, Stewart, & Ida, 2002). The long-range stirring only has a horizontal component,
| (12) |
for continuum objects and
| (13) |
for individual oligarchs, where is the fraction of objects with mass in annulus that approach no closer than 2.4 of the objects with mass in annulus , , , = , = 23.5, and = 5.9 (see also Kenyon & Bromley, 2001).
For short-range gravitational interactions, the stirring depends on the ratio of the relative collision velocity to the mutual Hill velocity,
| (14) |
In the high velocity regime, the collision velocity exceeds the Hill velocity. Statistical solutions to the Fokker-Planck equation then yield accurate estimates for the stirring rates (e.g., Hornung et al., 1985; Wetherill & Stewart, 1993; Stewart & Ida, 2000; Kenyon & Bromley, 2001). At low velocities, -body calculations provide good estimates. We follow Ohtsuki, Stewart, & Ida (2002) and write the stirring as the sum of rates in the two regimes:
| (15) |
and
| (16) |
where the subscripts ‘high’ and ‘low’ indicate the velocity regime (e.g., Eq. (25) of Ohtsuki, Stewart, & Ida, 2002).
In the high velocity regime, the stirring is (e.g. Stewart & Ida, 2000; Kenyon & Bromley, 2001)
| (17) |
and
| (18) |
where the fraction of objects with mass in annulus that approach within 2.4 of the objects with mass in annulus and = 0.28 . In the expression for , = ln and
| (19) |
The functions , , , and are definite integrals defined in Stewart & Ida (2000).
In the low velocity regime, the evolution equations are (Ohtsuki, Stewart, & Ida, 2002):
| (20) |
and
| (21) |
where the ’s are simple functions of the Hill radius
| (22) |
and the normalized eccentricity and inclination (Ohtsuki, Stewart, & Ida, 2002, see also Ida 1990; Ida & Makino 1992). For the low velocity limit of the horizontal velocity
| (23) |
and
| (24) |
For the low velocity limit of the vertical velocity
| (25) |
and
| (26) |
Here, , , and . The constants , , and are identical to those in Eq. (26) of Ohtsuki, Stewart, & Ida (2002).
Several tests indicate that these expressions provide an accurate treatment of velocity evolution for planetesimals in the high and low velocity regimes. Figs. 5–7 of Ohtsuki, Stewart, & Ida (2002) show comparisons with results from -body simulations (see also Ida, 1990; Ida & Makino, 1992). Our simulations confirm this analysis. Weidenschilling et al. (1997) and Kenyon & Bromley (2001) compare variants of this formalism with other -body calculations. Goldreich, Lithwick, & Sari (2004) demonstrate that our numerical results agree with analytic estimates.
To follow the evolution of the most massive objects more accurately, our code includes an -body algorithm. When objects have masses exceeding a ‘promotion mass’ , we promote them into an -body code that directly solves their orbits. The -body code incorporates algorithms to allow collisions among -bodies and interactions between -bodies and coagulation particles. Bromley & Kenyon (2006) describe this code in detail. Because dynamical interactions among large oligarchs are rare and occur at late stages in the evolution, we set g. We describe several test calculations with smaller in §3.3.
To treat the time evolution of the gas volume density , we use a simple nebular model with gas surface density , gas-to-solids ratio = 100 – where is the surface density of solids, and scale height (Kenyon & Hartmann, 1987). To approximate gas removal on a timescale , the gas density declines exponentially with time. We set = 10 Myr. During the early stages of calculations at 30–150 AU, velocity damping is important for particles with 100 m. However, particle losses from gas drag are small, 1% or less of the initial mass. By the time viscous stirring dominates the velocity evolution of small objects, the gas disk has dispersed. Inward drift and velocity damping are then negligible (see also Wetherill & Stewart, 1993).
The initial conditions for these calculations are appropriate for a disk with an age of 1–2 Myr (e.g. Dullemond & Dominik, 2005; Nomura & Nakagawa, 2006; Ciesla, 2007; Garaud, 2007). We consider systems of annuli in disks with = 30–150 AU and = 0.025. The disk is composed of small planetesimals with radii of 1–1000 m and an initial mass distribution in each annulus. The mass ratio between adjacent bins is = 1.4–2. At the start of the calculations, each bin has the same total mass, eccentricity , and inclination . We assume a power law variation of the initial surface density of solid material with semimajor axis,
| (27) |
where is a scaling factor. For a 1 central star, models with 0.1–0.2 g cm-2 at = 30 AU have a mass in icy solids comparable to the minimum mass solar nebula (MMSN hereafter; Weidenschilling, 1977a; Hayashi, 1981). Consistent with observations of disks surrounding pre-main sequence stars (e.g., Natta et al., 2000; Scholz et al., 2006), we scale the reference surface density with the stellar mass, = 0.18 ) g cm-2.
Table 1 lists the ranges in and we consider. The table also lists the main sequence lifetime, , defined as the time to reach core hydrogen exhaustion in the = 0.71, = 0.27, and = 0.02 stellar evolution models of Demarque et al. (2004), where is the initial mass fraction of hydrogen, is the mass fraction of helium, and is the metallicity. For most of our calculations, the number of annuli in the disk is = 64. To check these results, we also calculated models for disks with = 32 around 1 stars. Because the growth of planets has large stochastic variations, we repeated the calculations 5–12 times for each set of starting conditions, , , , and . Table 1 lists the number of calculations for each (, ) pair.
Our calculations follow the time evolution of the mass and velocity distributions of objects with a range of radii, to . The upper limit is always larger than the largest object in each annulus. To save computer time in our main calculation, we do not consider small objects which do not affect significantly the dynamics and growth of larger objects, = 100 cm. Erosive collisions produce objects with which are ‘lost’ to the model grid. Lost objects are more likely to be ground down into smaller objects than to collide with larger objects in the grid (see Kenyon & Bromley, 2002a, 2004a).
To estimate the amount of dusty debris produced by planet formation, we perform a second calculation. Each main calculation yields , the amount of mass lost to the grid per annulus per timestep, and , the scale height of the smallest particle () in each annulus of the coagulation grid. Objects with sizes smaller than contain a small fraction of the mass in each annulus; thus, the scale height for objects with is (Goldreich, Lithwick, & Sari, 2004). The total amount of mass lost from the planetesimal grid in each timestep is . The debris has a known size distribution, , where is a constant (see Stern & Colwell, 1997; Kenyon & Luu, 1999, and references therein). The normalization constant depends only on and , which we derive at each timestep in the main calculation. To evolve the dust distribution in time, we use a simple collision algorithm that includes Poynting-Robertson drag and radiation pressure111Because the collisional cascade begins after the gas disk dissipates, we ignore gas drag.. The optical depth of the dust follows from integrals over the size distribution in each annulus. The optical depth and a radiative transfer solution then yield the luminosity and radial surface brightness of the dust as a function of time. Kenyon & Bromley (2004a) describe this calculation in more detail.
Throughout the text, we use simple scaling relations to show how our results depend on initial conditions and the properties of the grid. For each set of calculations (Table 1), we derive median results for the size distribution, the size of the largest object as a function of and , and other physical variables. Substituting the inter-quartile range for the dispersion, we then perform least-squares fits to relate these median results to input parameters (e.g., ) and the properties of the grid (e.g., ). For parameters where analytic theory predicts a relation (e.g., the growth time as a function of ), we derive the best-fitting coefficient, test whether different fitting functions provide better fits to our results, and keep the result that minimizes per degree of freedom. When analytic theory provides no guidance, we derive fitting functions that yield the sensitivity of our results to all important physical variables. Thus, our fits test some aspects of analytic theory and guide other aspects.
3 PLANET FORMATION CALCULATIONS
3.1 Icy Planet Formation in Disks around 1 Stars
We begin with a discussion of planet formation in disks at 30–150 AU around a 1 star. For most disks around low mass stars, the timescale for planet formation is shorter than the main sequence lifetime. Thus, the growth of planetesimals into planets and the outcome of the collisional cascade depend more on the physics of solid objects than on stellar physics. Here, we review the stages in planet growth and describe the outcome of the collisional cascade. For a suite of calculations of planet formation in disks of different masses, we derive basic relations for the growth time and the maximum planet mass as a function of initial disk mass. We also show how the dust production rate and the mass in small objects depend on initial disk mass and time.
The next section compares these results with calculations for 1.5–3 stars. For disks around more massive stars, the planet formation timescale is comparable to the main sequence lifetime. Thus, the central star evolves off the main sequence before planet formation and the collisional cascade reach a natural end-state. During post-main sequence evolution, the star brightens considerably (e.g., Demarque et al., 2004) and develops a powerful stellar wind (e.g., Knapp & Morris, 1985, and references therein), melting icy objects in the inner disk and ejecting small grains throughout the disk. Thus, we halt our calculations when the star evolves off the main sequence. Here, we show how the physics of main sequence stars changes the results derived for planet formation around 1 M⊙ stars.
3.1.1 Growth of Large Objects
The formation of icy planets in the outer regions of a quiescent planetesimal disk has three distinct stages (Kenyon & Luu, 1999; Kenyon & Bromley, 2004a). Planetesimals with 1 km grow slowly. As they grow, dynamical friction damps for the largest objects; dynamical friction and viscous stirring raise for the smallest objects (e.g., Greenberg et al., 1984; Wetherill & Stewart, 1993; Goldreich, Lithwick, & Sari, 2004). After 0.1–1 Myr, gravitational focusing enhances the collision cross-sections by factors of 10–100. Slow, orderly growth ends. Runaway growth begins. At the inner edge of the disk, the largest objects take 3 Myr to grow to 100 km and 30 Myr to grow to 1000 km. Throughout runaway growth, the gas disk dissipates. Thus, velocity damping by gas drag ceases; dynamical friction and viscous stirring increase for the smallest objects. Stirring reduces gravitational focusing factors, slowing the growth of the largest objects relative to one another and relative to leftover planetesimals (Ida & Makino, 1993; Wetherill & Stewart, 1993). Runaway growth ends; oligarchic growth begins (Kokubo & Ida, 1998; Rafikov, 2003; Chambers, 2006; Nagasawa et al., 2007). After 30–100 Myr, the largest objects – oligarchs – grow slowly and contain an ever increasing fraction of the remaining mass in the disk.
During the transition from runaway to oligarchic growth, collisions start to produce copious amount of dust. Once oligarchs reach sizes 500 km, collisions between 1–10 km objects produce debris instead of mergers (Kenyon et al., 2008, and references therein). Once fragmentation begins, continued stirring leads to a collisional cascade, where leftover planetesimals are ground to dust. For dust grains with sizes 10 m, the collision time is much shorter than the time to remove particles by gas drag (Adachi et al., 1976) or by Poynting-Robertson drag (Burns, Lamy, & Soter, 1979). Thus, the cascade proceeds to particle sizes 1–10 m, where radiation pressure removes material on the dynamical time scale (Burns, Lamy, & Soter, 1979). Because runaway growth leaves most of the mass in 1–10 km objects, the collisional cascade effectively removes a significant fraction of the solid material in the disk.
Fig. 1 shows the time evolution of the eccentricity and the mass distributions for objects in the innermost 8 annuli of a disk with initial mass distribution similar to the MMSN. To minimize stochastic variations, these plots show median results for 15 calculations. During slow growth and the early stages of runaway growth, dynamical friction damps for the largest objects and raises for the smallest objects (Fig. 1; right panel, 10 Myr). The mass distribution develops a pronounced shoulder from 10 km to 300–500 km. As the evolution proceeds, growth concentrates more mass in the largest objects; stirring excites the orbits of the smallest objects. After 100 Myr, the collisional cascade removes mass efficiently from the smallest objects but leaves the mass distribution of the largest objects unchanged. By 5–10 Gyr, almost all of the small objects have been removed.
In these calculations, the rate of planet formation is very sensitive to semimajor axis (Fig. 2). For collisional processes, the growth time in the disk is , where is the orbital period (see the Appendix; also Lissauer, 1987; Kenyon & Luu, 1998; Goldreich, Lithwick, & Sari, 2004). For and (Eq. (27)), the growth time is . Thus, although it takes only 10 Myr for the largest planets to reach radii of 300–600 km at 30 AU, the largest objects at 100 AU still have 3–5 km. By 100 Myr, 100 km objects form at 75–80 AU. After 1 Gyr, 100 km objects form beyond 125 AU. By the end of the calculation at 10 Gyr, 1000 km objects form throughout the disk.
The formation rate also depends on the initial disk mass (Fig. 3). For an expected growth time , planets grow faster in more massive disks. At 100 AU, planets with 2000 km form in a massive disk ( = 3) within 1 Gyr. In a low mass disk with 1/3, the largest planet at 100 AU grows to 300 km in 1 Gyr and 2000 km in 10 Gyr. For all simulations of disks around 1 stars, the median timescale for the formation of the first 1000 km object is
| (28) |
This relation fits our results for the median growth time to 5% for = 30–150 AU and for = 1/3 to 3. For each initial disk mass, the inter-quartile range for the formation time is 20%. Thus, there is a modest range of outcomes for identical starting conditions.
In equation 28, there is a small difference between the result expected from simple theory () and the result derived in our calculations (). We show in the Appendix how gas drag during runaway and oligarchic growth can modify the simple theory and explain the result of our calculations.
Although the timescale to produce the first 1000 km object is a strong function of initial disk mass and semimajor axis, the evolution at late times is less sensitive to the starting conditions. To derive a simple relation for the median size of the largest object as a function of initial disk mass and semimajor axis, we adopt a simple function
| (29) |
and use an amoeba algorithm (Press et al., 1992) to derive the fitting parameters , , and as a function of time. For stellar ages 1 Gyr 10 Gyr, the ensemble of calculations yields
| (30) |
for the radius of the largest object,
| (31) |
for the scale length, and 5–6 for the exponent. These relations match our results to 5%. The uncertainties are 3% in the coefficients and 5% in the exponents.
These calculations produce relatively low mass icy planets with radii 50% larger than the radius of Pluto (Young & Binzel, 1994; Elliot et al., 2003, 2007). Although these objects form relatively rapidly in the inner disk, they grow very slowly at late times. Between 1–10 Gyr, most large object grow by 10–20% in radius ( 50% in mass). Because the size of the largest object depends weakly on the initial disk mass, nearly all disks form Pluto-mass planets. These objects stir leftover planetesimals effectively; thus, nearly all disks develop a collisional cascade.
Despite the general formation of Pluto-mass planets in any disk, the lowest mass disks ( 1/3) form Plutos inefficiently. The scale length, 150 AU, derived from our calculations exceeds the outer radius of the disk. Thus, planet formation does not proceed to completion at large for the lowest mass disks. In these systems, the largest icy planets at 125–150 AU are factors of 3–10 smaller than . The large exponent, 5–6, derived in our fits implies a rapid transition – 10–20 AU – between disk regions where the largest objects are planets with and where the largest objects have 300–500 km.
In our calculations, the collisional cascade limits the size of the largest objects. Once a few objects have radii 1000 km, they stir up leftover planetesimals to the disruption velocity. When the collisional cascade begins, the timescale for 1 km planetesimals to collide and fragment into smaller objects is shorter than the timescale for oligarchs to accrete leftover planetesimals. Thus, the growth of the largest objects stalls at 1000–2000 km ( 0.01–0.02 ). Occasionally, runaway and oligarchic growth produce a very large object with 5000 km ( 0.1 ), but these objects form in only 5–10% of the simulations. These objects form at random semimajor axes and tend to form in more massive disks.
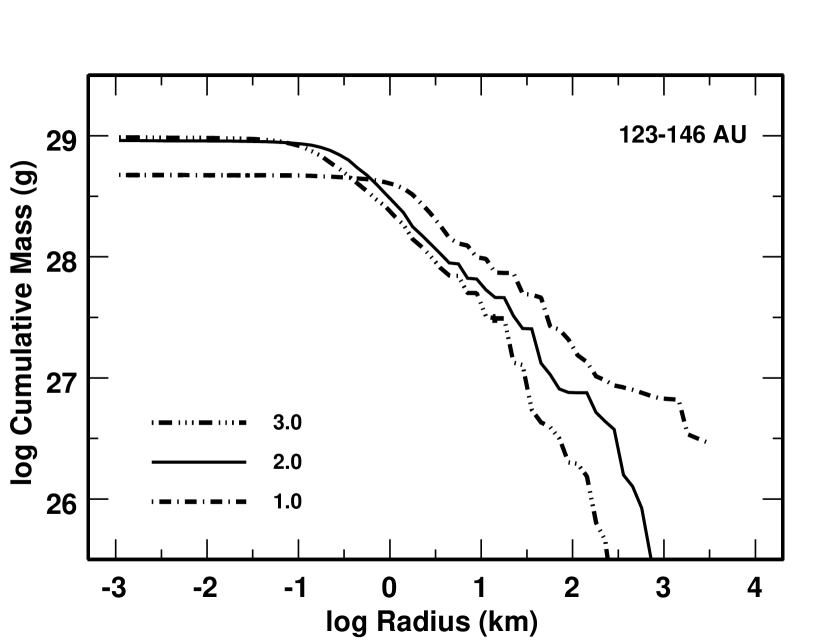
The large radial variation in the formation time produces dramatic differences in the mass distribution as a function of semimajor axis (Fig. 4). In the inner disk, rapid growth leads to many objects with 1000 km (Table 2). With many large objects stirring the leftover planetesimals in the inner disk, the collisional cascade removes most of the mass in small objects (Fig. 4, left panel). In the outer disk, slow growth results in a handful of Pluto-mass objects. A few large objects cannot stir leftover planetesimals efficiently. Thus, the collisional cascade is weak and leaves a substantial amount of mass in 1–10 km planetesimals (Fig. 4, right panel).
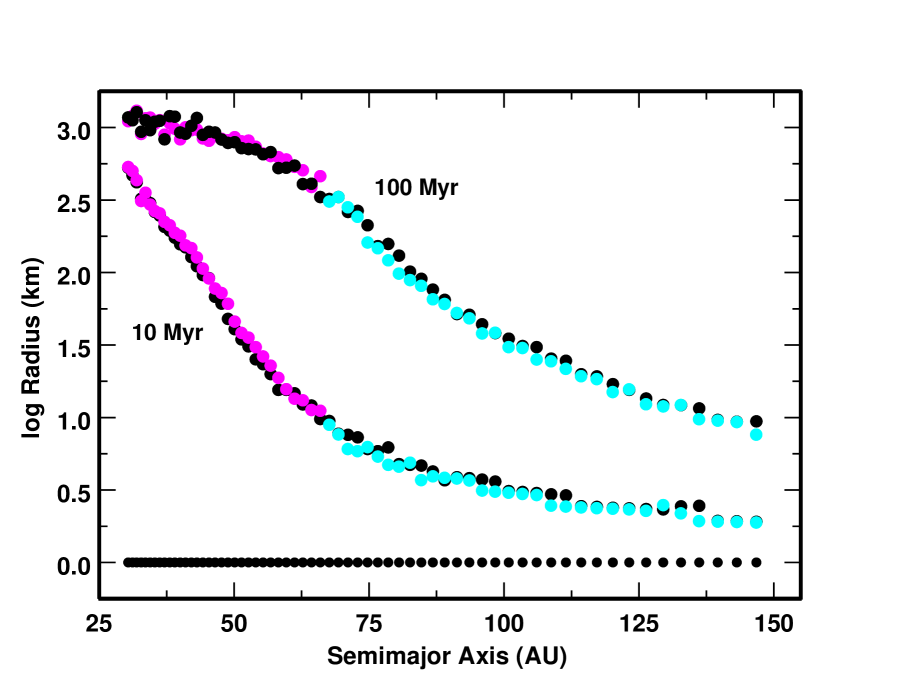
The growth of objects as a function of semimajor axis and time is not sensitive to the size of the model grid (Fig. 5). For two sets of calculations with 32 annuli (cyan and magenta points), the median radius of the largest object in each annulus is nearly identical to results for calculations with 64 annuli (black points). The results for Eqs. (28–34) are also independent of the grid. In principle, long-range stirring from planets at small can influence runaway growth of objects at large . Our results suggest that icy planet formation at large semimajor axes is not influenced by the formation of small icy planets at small semimajor axes.
To conclude this discussion of the formation of large objects in a planetesimal disk, we quote several simple relations for the amount of solid material in small and large objects as a function of initial disk mass and semimajor axis for the ensemble of calculations around a 1 M⊙ star. At 3–10 Gyr, the median fraction of solids remaining in the disk is
| (32) |
For a MMSN with = 1, the amount of mass remaining in the disk at 3–10 Gyr ranges from 9% of the initial mass at 30 AU to roughly 50% of the initial mass at 150 AU. Thus, the inner disk is substantially depleted, while the outer disk contains a significant fraction of its initial mass.
For each , the median fraction of the initial disk mass in 1000 km and larger objects is
| (33) |
The median fraction of the mass in 100 km and larger objects is roughly 50% larger,
| (34) |
For the ensemble of calculations, the typical inter-quartile range is 0.1 for and 20% for and . Thus, the mass distributions in our calculations are top-heavy, with more mass in 1000+ km objects than in 100–1000 km objects.
These relations demonstrate that planet formation at 30–150 AU is very inefficient. For all disk radii in this range, only 6% or less of the initial population of 1 km objects is incorporated into large objects with radii exceeding 100 km. In the inner disk (30–50 AU), the collisional cascade is very efficient at removing leftover 1–10 km objects. Thus, at 3–10 Gyr, the large objects contain most of the mass in the inner disk. In the outer disk (100–150 AU), the collisional cascade does not have enough time to remove leftover planetesimals. Thus, small objects with radii of 1–10 km contain most of the remaining mass at 100–150 AU.
3.1.2 Evolution of Dust
At all semimajor axes, the collisional cascade converts a large fraction of the initial mass in solids into small dust grains. Because oligarchs and leftover planetesimals are unobservable with current techniques, dust emission provides the sole observational diagnostic of the growth of icy planets at 30–150 AU around other stars. Here, we describe the evolution of these small particles and demonstrate that the collisional cascade is observable.
Two physical processes set the visibility of dust grains in a debris disk. Once significant fragmentation begins, collisions gradually grind the fragments to dust. When dust grains are small enough, radiative processes remove them from the disk. For disks at 30–150 AU, radiation pressure dominates mass loss for 1–3 Gyr and removes 65% to 70% of the total mass loss. Poynting-Robertson drag removes material at late times and is responsible for 30% to 35% of the total mass loss. Because the gas density is negligible once the collisional cascade begins, gas drag is unimportant.
To describe our results, we divide dusty debris into ‘large grains’ with 1 mm 1 m, ‘small grains’ with 1 m 1 mm, and ‘very small grains’ with 1 m. Collisions dominate the evolution of large grains at all times. For 1–3 Gyr, collisions dominate the evolution of small grains; Poynting-Robertson drag then removes grains with radii of 1–100 m on Gyr timescales. Radiation pressure removes very small grains on the local dynamical timescale. Thus, radiation pressure produces a ‘wind’ of very small grains in the disk midplane.
Fig. 6 shows the time evolution of the dust production rate for very small grains as a function of initial disk mass. At the start of each calculation, dynamical friction and collisions damp orbital eccentricities. Thus, collisions produce less and less debris; the dust production rate declines with time. As oligarchs reach radii of 500 km, they stir leftover planetesimals along their orbits. Dust production increases. Because oligarchs continue to grow, they stir leftover planetesimals to larger and larger velocities. Collision energies rapidly exceed the critical disruption energy; the dust production rate increases dramatically (Eq. 4–5). When oligarchs start to reach their maximum radii in the inner disk (Eq. (29)), the dust production rate peaks. As oligarchs grow at larger and larger disk radii, the dust production rate slowly declines.
Although the outer disk contains more mass, the global dust production rate declines with time for two reasons. Large oligarchs form at late times in the outer disk (Fig. 2), but the smaller disk surface density and the longer orbital periods lead to smaller collision rates. Smaller collision rates yield smaller dust production rates. Initially, collisions dominate Poynting-Robertson drag; thus, radiation pressure ejects the smallest grains on the local orbital timescale (e.g., Krivov et al., 2000; Wyatt, 2005). The dust production rate then declines roughly as . At late times, the collision rates decline. Poynting-Robertson drag then removes larger grains from the disk, which reduces the population of very small grains from erosive collisions. The dust production rate then declines with evolution time as (see also Dominik & Decin, 2003; Kenyon & Bromley, 2004a, 2005; Wyatt, 2005; Wyatt et al., 2007a, b).
The time evolution of the collision rate in the disk yields a simple relation between the maximum dust production rate and the initial disk mass. For the complete set of calculations,
| (35) |
For a MMSN with = 1, the maximum rate is 0.1 every million years. The collision rate scales with the square of the number density of objects; thus, the dust production rate grows as the square of the initial disk mass (e.g., ).
The timescale for the peak in dust production is shorter than the timescale for the production of 1000 km objects in the disk,
| (36) |
This time corresponds roughly to the time of peak stirring of leftover planetesimals by oligarchs growing in the inner disk, starting the collisional cascade. Oligarchs form faster in more massive disks; thus, the dust production rate peaks earlier in more massive disks.
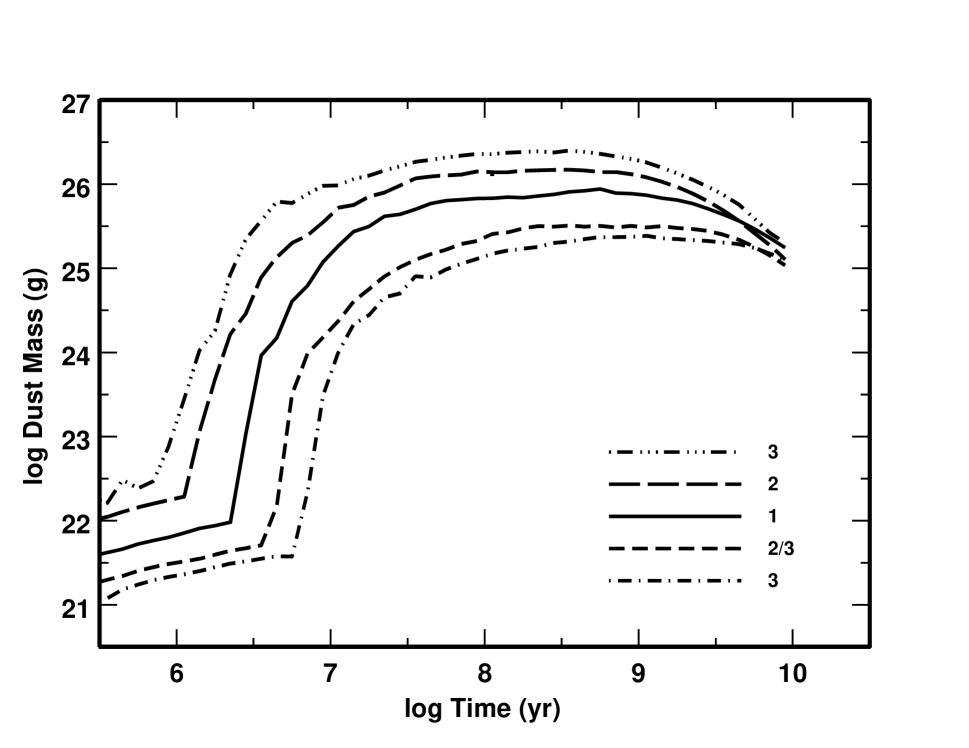
Fig. 7 shows the time evolution of the mass in small grains for disks with a range of initial masses. Initially, the dust production rates are small (Fig. 6) and the dust mass increases slowly with time. Once large oligarchs form in the inner disk, the dust production rate – and thus the mass in small grains – grows rapidly. For all disks, it takes 5–10 Myr for the mass in small grains to grow from (which is unobservable with current techology) to (which is observable). After this rapid rise, oligarchs form at larger and larger disk radii, leading to enhanced dust production farther and farther out in the disk. The dust mass then rises slowly with time. Once oligarchs form at the outer edge of the disk, the collisional cascade removes more and more solid material throughout the disk. The dust mass then begins to decline.
The maximum mass in small grains scales with the initial disk mass,
| (37) |
Because the derived size distributions are dominated by collisional processes, the maximum mass in large grains is roughly 40 times larger (e.g., Dohnanyi, 1969; Williams & Wetherill, 1994; Kenyon & Bromley, 2004c; Krivov et al., 2006),
| (38) |
In both cases, the larger collision rate in more massive disks leads to more dust. Although these dust masses are significant, they are small compared to the mass in objects with 100 km. The typical mass in large grains is 10% of the mass in 100 km and larger objects. The mass in small grains is 0.25% of the mass in the largest objects.
The timescale to reach the maximum dust mass is a function of the particle size. For the small grains,
| (39) |
For the large grains,
| (40) |
Several features of the collisional cascade set these timescales. Early in the evolution, the collision timescale for all particle sizes is smaller than the timescale for Poynting-Robertson drag. Thus, the cascade erodes small particles until radiation pressure ejects them. As planet formation propagates out through the disk, collisions produce more and more small grains. Because the mass in grains is set by a balance between the collision time, which scales as and the local dynamical time, which scales as , the timescale to reach the maximum grain mass is proportional to . As the collision rate declines, Poynting-Robertson drag starts to remove mass from the disk. This drag removes smaller particles from the disk more effectively than it removes large particles. Thus, the mass in small grains peaks before the mass in larger grains.
These results suggest that the mass in collisional debris is large, roughly a lunar mass in 0.001–1 mm grains, throughout the lifetime of a 1 star. Although the Solar System has much less dust (e.g., Landgraf et al., 2002; Nesvorný et al., 2006, and references therein), these large disk masses are comparable to the mass in dust grains detected in many debris disks around other stars (e.g., Beichman et al., 2006; Trilling et al., 2008; Moro-Martin et al., 2007). Because our dust production rates are observable, the large range in dust masses as a function of initial disk mass and time implies a correspondingly large range in the observable properties of debris disks, such as the disk luminosity and the IR excess, at fixed stellar age. Because the dust production rate declines with time, we expect the disk luminosity and IR excesses to decline with time. We derive detailed predictions for this evolution in §4 and compare these results with observations in §5.
3.2 Icy Planet Formation in 1.5–3 Stars
Stellar evolution is an important feature of icy planet formation at 30–150 AU. Because the main sequence lifetime (, with 3–3.5; e.g., Iben, 1967; Demarque et al., 2004) is more sensitive to stellar mass than the timescale to produce large icy planets (; see below), massive stars evolve off the main sequence before oligarchic growth and the collisional cascade remove solid material in the outer disk. After a 1–3 M⊙ star evolves off the main sequence, it becomes more luminous (as a red giant) and hotter (as a post-AGB star). During this evolution, icy planetesimals and planets melt, decreasing collision rates and changing the outcome of the collisional cascade222We assume that melting is accompanied by a loss of volatiles and an increase in the mass density of leftover planetesimals.. Short main sequence lifetimes of massive stars thus lead to clear differences in the amount of solid material in large and small objects in the outer disk.
The stellar mass also affects the outcome of icy planet formation. The timescale for planet formation scales with orbital period and the surface density, (see the Appendix). For a disk with (Eq. (27)) and fixed , the formation time is . Thus, at fixed in disks with identical surface density distributions, planets form faster around more massive stars. However, disk masses in the youngest stars scale with stellar mass (e.g., ; Natta et al., 2000; Scholz et al., 2006). Thus, scales with stellar mass, . Combining these relations leads to a formation time . Thus, at fixed in typical disks, icy planets form 5 times faster around 3 M⊙ stars than around 1 M⊙ stars.
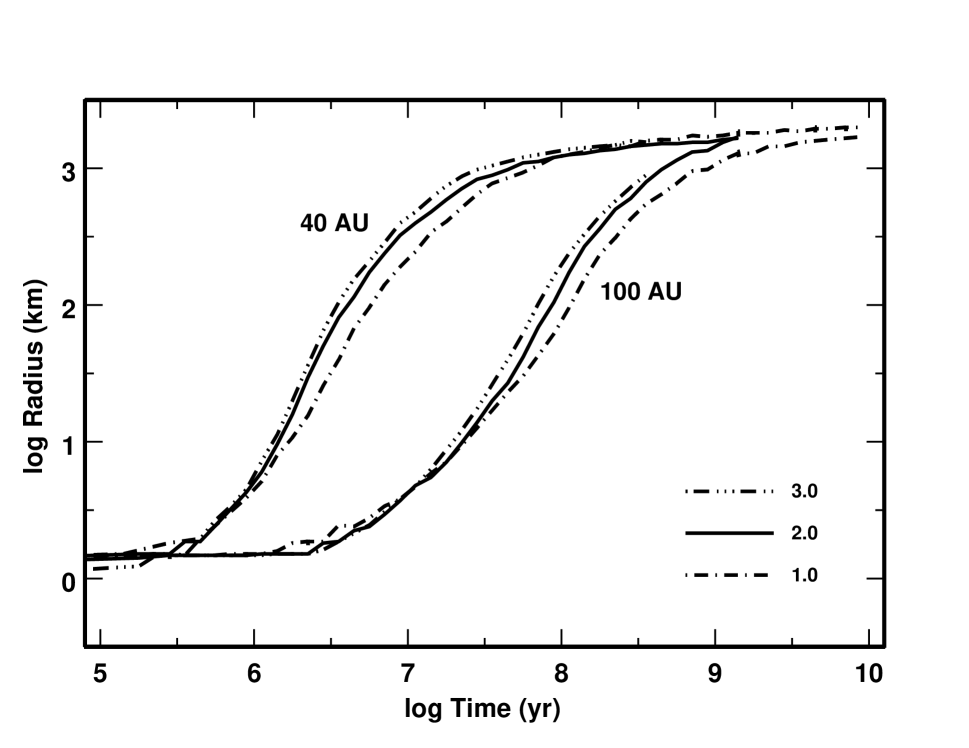
To illustrate how stellar mass and evolution affect planet formation, we begin with the growth of large objects at 40 AU and at 100 AU (Fig. 8). For disks with identical initial surface density distributions, planets at the same in disks around 3 M⊙ stars grow 1.7 times faster than planets around 1 M⊙ stars. Fig. 8 also shows the clear scaling of growth time with semimajor axis, for a disk with . The simple scaling of the growth time with disk mass and orbital period in our calculations leads to a general relation for the median timescale for the formation of the first 1000 km object in disks at 30–150 AU,
| (41) |
For 1–3 M⊙ stars, this relation fits our results for the median growth time to 7% for = 30–150 AU and for = 1/3 to 3. For all initial disk masses, the inter-quartile range for the formation time is 20%. Thus, there is a modest range of outcomes for identical starting conditions around 1–3 M⊙ stars.
Aside from the extra factor of , this relation follows the prediction of from standard coagulation theory. As outlined in the Appendix, velocity damping from gas drag can speed up planet formation in more massive disks.
Fig. 9 further shows how the growth time varies with and for constant . At 100 Myr, icy planets are close to their maximum sizes at 30–50 AU in the inner disk. At large disk radii ( 100–150 AU), planet formation is clearly faster around more massive stars. For all stars with = 1–3 M⊙, the relations have a similar morphology, consisting of a plateau at 1000–2000 km and a steep decline of with increasing . As in §3.1.1, we fit our results to a simple relation between , , and time (Eq. (29)). For all of our calculations, we derive an exponent 5–6 and a characteristic maximum radius
| (42) |
with the exponent . The disk scale length is
| (43) |
These results are valid for late times, 0.1–1 .
Eq. (42) shows that the maximum sizes of icy planets at 30–150 AU are relatively insensitive to initial disk mass, stellar mass, or time. For disks with identical around 1–3 M⊙ stars, the largest icy planets around 3 M⊙ stars are only 10%–20% larger than the largest icy planets around solar-type stars. This range is comparable to the range in maximum sizes for planets formed in identical disks around stars of identical mass (§3.1.1). Disks with a factor of 10 range in yield planets with a 20%–30% range in radii (a factor of 2 in mass). Thus, our calculations predict that the largest icy planets at 30–150 AU around 1–3 M⊙ stars have masses comparable to Pluto and other large Kuiper belt objects in the Solar System beyond the orbit of Neptune.
Although the maximum sizes of planets are fairly independent of initial conditions, the number of Pluto-mass objects is sensitive to disk mass and stellar mass (Table 3). In the inner disk (30–60 AU), scales roughly with initial disk mass and stellar mass. In the outer disk (100–150 AU), the formation timescale for icy planets is comparable to the main sequence lifetime. Thus, scales with initial disk mass and stellar mass only for the most massive disks. In lower mass disks, stars evolve off the main sequence before disks can produce large numbers of Pluto-mass objects.
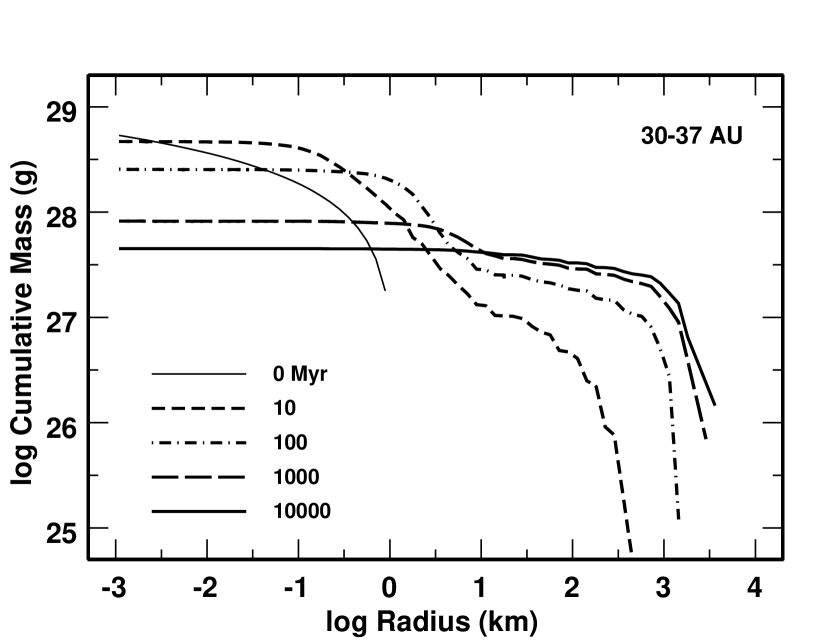
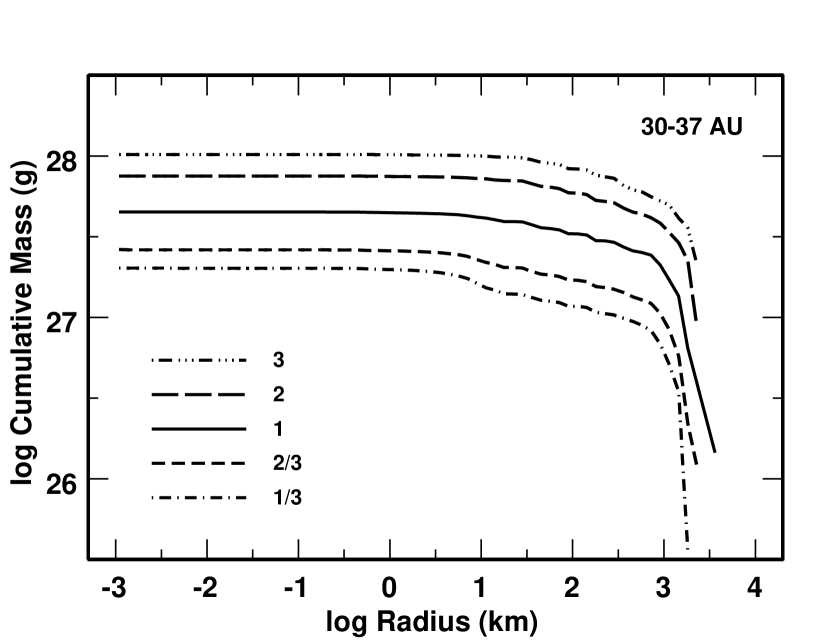
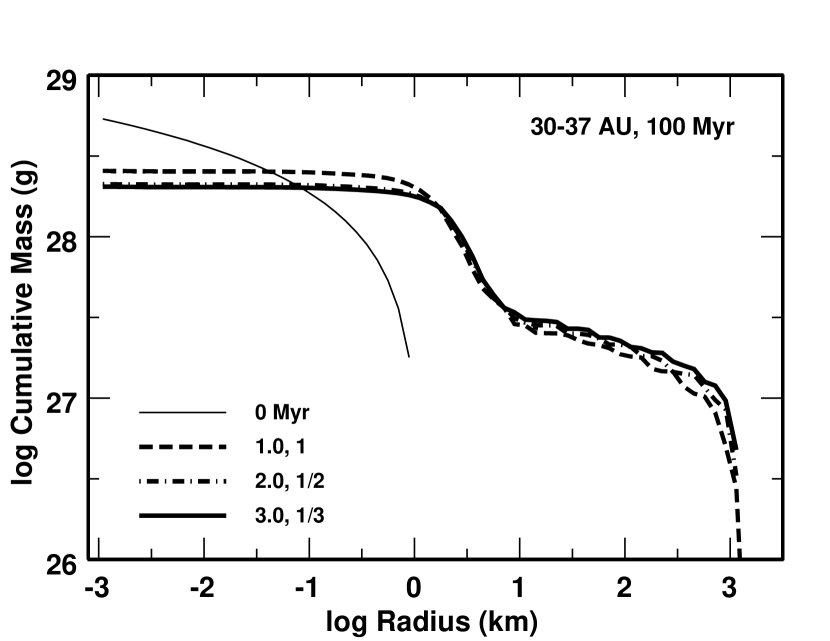
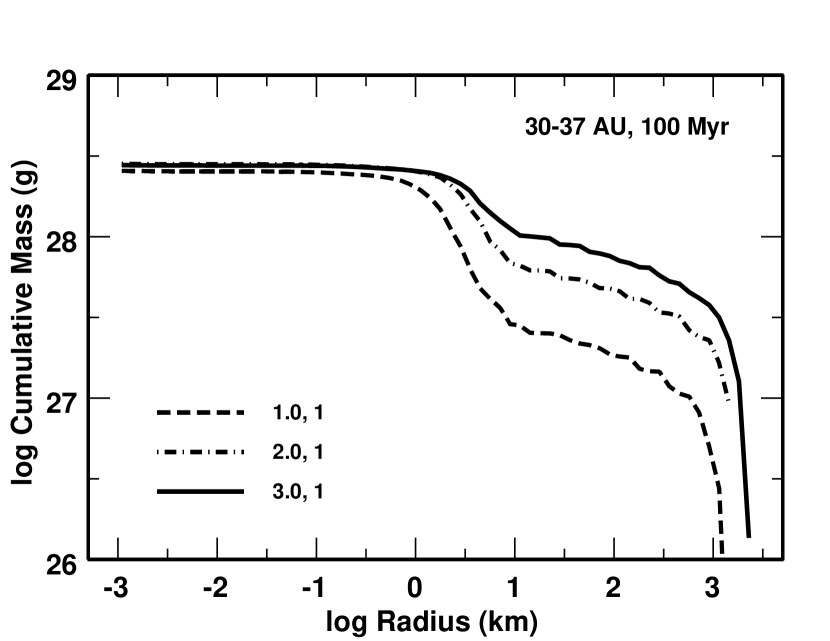
Cumulative mass distributions provide another useful comparison of icy planet formation as a function of disk mass and stellar mass. For disks with identical initial surface density distributions at = 30–37 AU, the shape of the mass distribution is fairly independent of stellar mass at 100 Myr (Fig. 10; left panel). Because large icy planets form first in disks around more massive stars, disks of fixed age around 3 M⊙ stars have more mass in larger planets and are more collisionally depleted than disks around 1 M⊙ stars.
For calculations in scaled MMSN (Fig. 10; right panel), growth is a stronger function of stellar mass. As predicted by the simple scaling relations, disks around 3 M⊙ stars have 5 times more mass in large objects than 1 M⊙ stars. More mass in large objects produces more stirring, enhancing mass loss in the collisional cascade. Despite large difference in initial disk mass, the mass distributions of disks around 1–3 M⊙ stars are very similar for 1 km at similar times.
Although planet formation proceeds faster with increasing stellar mass, stellar evolution halts the collisional cascade and the growth of planets in more massive stars (Fig. 11). Planets reach their maximum radii in the inner disks for all 1–3 M⊙ stars; however, the timescale for the collisional cascade to run to completion is long compared to the main sequence lifetimes of 2–3 M⊙ stars. Thus, the collisional cascade removes a larger fraction of material from the inner disks around 1 M⊙ stars than from the inner disks of 2–3 M⊙ stars (Fig. 11; left panel). In the outer disk, the growth time for 1000 km planets is large compared to the main sequence lifetime for 2–3 M⊙ stars. Thus, planets do not reach their maximum radii of 1000–2000 km in the outer disks of 2–3 M⊙ stars (Fig. 11; right panel)
To conclude our comparison of icy planet formation around stars of different masses, we consider the long-term evolution of all solids in the disk. For , the median fraction of solids remaining in the disk is
| (44) |
for the ensemble of calculations for 1.5 M⊙ stars and
| (45) |
for calculations for 2–3 M⊙ stars. At 30–50 AU, all stars lose roughly the same fraction of mass from the disk. At larger disk radii, more massive stars evolve off the main sequence before the collisional cascade removes most of the leftover 1–10 km planetesimals. Thus, icy planet formation around lower mass stars converts a larger fraction of the initial solid mass into dusty debris.
Although planet formation around massive stars converts a smaller fraction of the initial mass into dusty debris, icy planet formation is equally efficient at producing massive objects around all 1–3 M⊙ stars. For all disks in our calculations, the median fraction of the initial disk mass in 1000 km and larger objects is
| (46) |
The median fraction of the mass in 100 km and larger objects is 50% larger,
| (47) |
Mass distributions for icy planets are top heavy for all 1–3 M⊙ stars. As for calculations around 1 M⊙ stars, the typical inter-quartile ranges are 0.1 for and 20% for and . Thus, identical starting conditions lead to a modest range of outcomes.
3.2.1 Evolution of Dust
The evolution of dusty debris in disks around 1.5–3 M⊙ stars generally follows the evolution for 1 M⊙ stars. As oligarchs form, stirring leads to a collisional cascade that converts 10 km and smaller objects into small dust grains. Because planets form more rapidly around more massive stars, disks around massive stars produce dust sooner than disks around lower mass stars. In our calculations, the disk mass scales with the stellar mass. Thus, disks around massive stars also produce more dust than disks around lower mass stars. However, massive stars do not live as long as lower mass stars, preventing the collisional cascade from removing all of the small objects from the disk (Fig. 10). Over the lifetime of the star, disks around lower mass stars form more dust than disks around more massive stars.
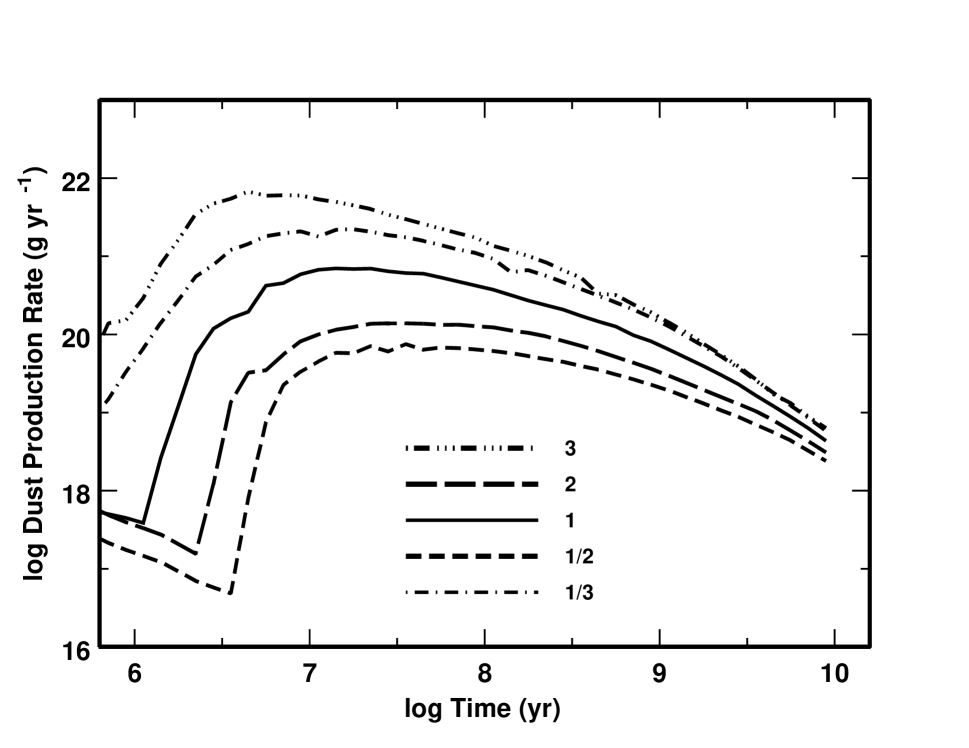
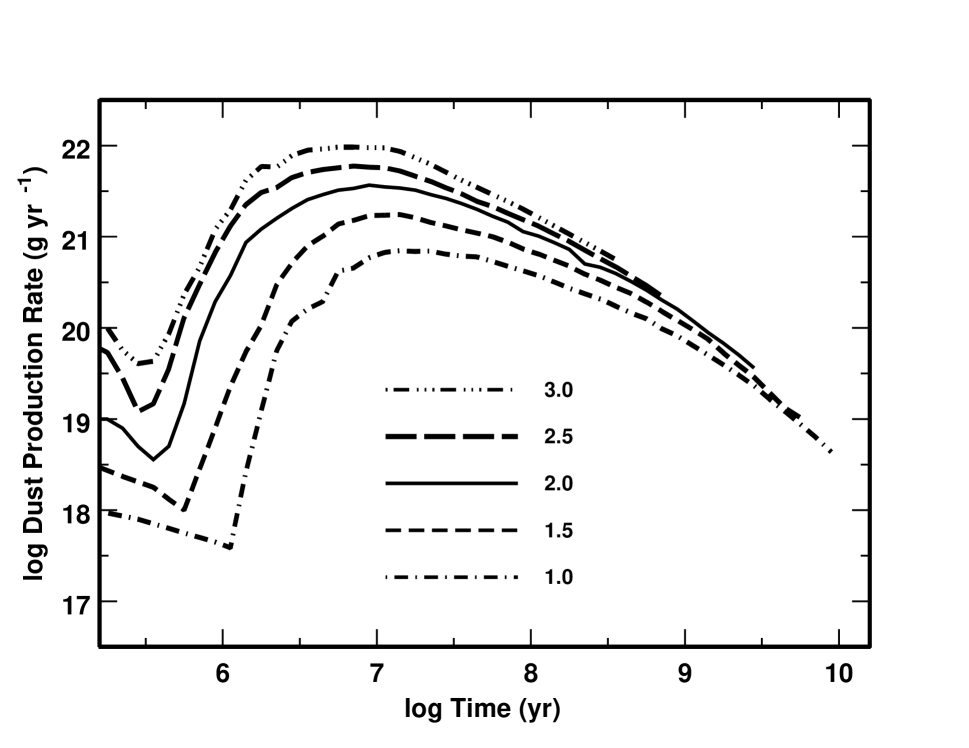
To illustrate these points, Fig. 12 shows the time evolution of the dust production rate for a scaled MMSN ( = 1) around 1 M⊙, 2 M⊙, and 3 M⊙ stars. During runaway growth, destructive collisions are rare; thus, the dust production rate declines with time. As runaway growth ends, there are three distinct phases in dust production: (i) an exponential rise when runaway objects start to stir leftover planetesimals in the inner disk, (ii) a long plateau as oligarchs form farther and farther out in the disk, and (iii) a long decline in dust production as the collisional cascade depletes the disk of 1–10 km objects.
Because planets grow more rapidly around more massive stars, the exponential growth in dust production occurs first around more massive stars. The timescale for the onset of dust production also scales inversely with disk mass; thus, more massive disks produce dust faster than low mass disks.
When runaway growth ends and oligarchic growth begins, the dust production rate reaches a clear plateau (Fig. 12). We define the onset of the plateau phase as the time of maximum dust production333Because there are small fluctuations in the dust production rate during the plateau phase, we define the maximum dust production as the time when the derivative first changes sign.. For our calculations, there is a simple relation between the timescale of maximum dust production and the masses of the disk and central star,
| (48) |
At this time, our simulations yield a simple relation between the maximum dust production rate and the masses of the disk and the central star,
| (49) |
Each of these scaling laws has a simple physical origin. The maximum dust production rate, , depends on the collision rate, the square of the disk mass divided by the orbital period. Thus, . For disks where the surface density scales with stellar mass (Eq. (27)), . Thus, . The timescale to reach this rate is the orbital period divided by the disk mass. Thus, .
Once oligarchs form in the outer disk, the dust production rate declines rapidly. Stellar evolution sets the duration of this decline. In massive stars, the short main sequence lifetime halts the evolution before the collisional cascade depletes the disk of 1–10 km objects. Thus, the dust production rate declines by roughly an order of magnitude before the central star evolves off the main sequence. For lower mass stars, the long main sequence lifetime allows the collisional cascade to remove some material in the outer disk. Thus, the dust production rate declines by two orders of magnitude before the central star evolves into a red giant. We show in §4 how the long-term evolution of the dust production rate as a function of stellar mass produces observable differences in the IR excesses of massive and low mass stars.
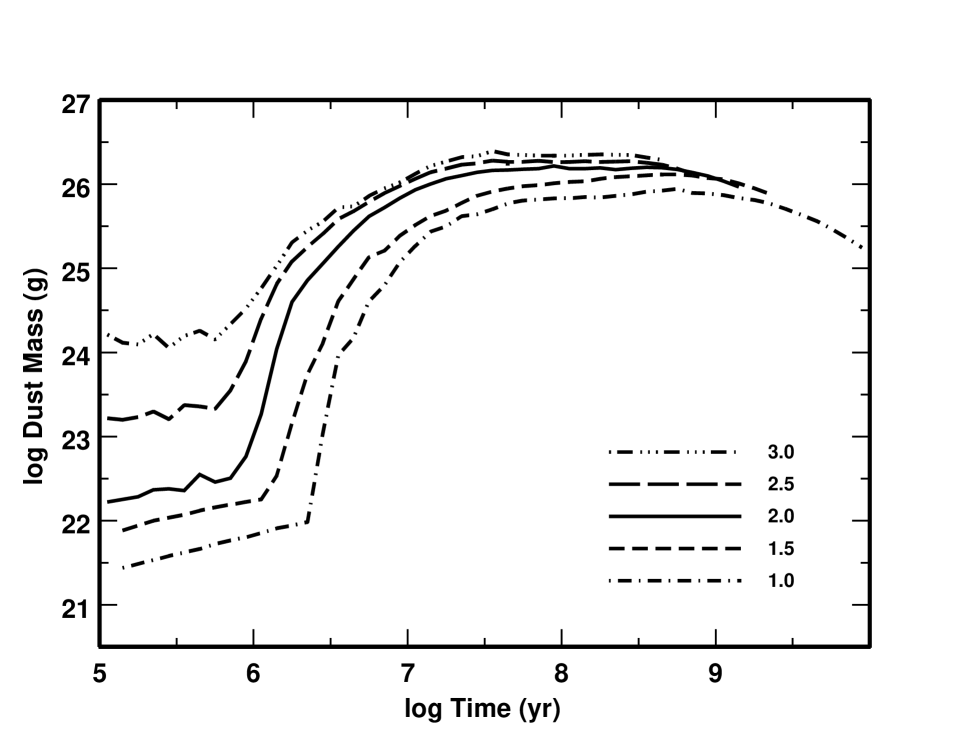
Despite the large differences in dust production rates, there are smaller variations in the amount of dust as a function of disk mass and stellar mass. Fig. 13 shows the time evolution of the median mass in small grains for scaled MMSN around 1–3 M⊙ stars. Once the exponential rise in dust production begins, the dust masses rapidly evolve to similar configurations with g in small grains. For our set of calculations, the maximum mass in small grains is
| (50) |
The coefficient in this equation, , is roughly twice the mass of the Moon. The maximum mass in large particles is
| (51) |
The timescale to reach the maximum dust mass is a function of the particle size. For the small grains,
| (52) |
For the large grains,
| (53) |
As described in §3.1.2, the collision rate, the dynamical timescale, and Poynting-Robertson drag combine to produce the shorter timescale for smaller dust grains.
3.3 Limitations of the Calculations
In previous papers, we have described limitations to multiannulus (Bromley & Kenyon, 2006; Kenyon & Bromley, 2001, 2002a, 2004b, 2005, 2006) and single annulus (Kenyon & Luu, 1998, 1999) coagulation calculations. Here, we review how several of these limitations affect results for the simulations described above.
As long as the statistical assumptions underlying the formalism are met, coagulation calculations provide a reasonable representation of real collision evolution (Wetherill, 1980; Greenberg et al., 1984; Davis et al., 1985; Barge & Pellat, 1991; Spaute et al., 1991; Lissauer & Stewart, 1993; Wetherill & Stewart, 1993; Stern & Colwell, 1997; Weidenschilling et al., 1997; Kenyon & Luu, 1998; Inaba et al., 2001). For calculations at 30–150 AU around 1–3 M⊙ stars, the spacing of mass bins in an annulus and the spacing of annuli in the disk limit the accuracy of the results. Our standard mass spacing, , lengthens the evolution time by 10% to 20% relative to more accurate calculations with 1.4 (see Kenyon & Luu, 1998, and references therein). The radial resolution, = 0.025, also lengthens the evolution time. Compared to calculations described in Kenyon & Bromley (2004b), improvements in our treatment of interactions among particles in neighboring annuli reduce lags by a factor of two, from 20% to 10%. Combining the lags for mass spacing and radial resolution, our evolution timescales are 20% to 30% longer than the actual evolution times. This lag is comparable to the dispersion in timescales derived from multiple calculations with identical starting conditions. Thus, improvements in resolution are unlikely to alter our results significantly.
3.3.1 Dynamical interactions
The coagulation algorithm begins to break down when (i) a few large objects contain most of mass in the grid and (ii) the gravity of these objects dominates the stirring. For 500–1000 km, the largest objects contain a small fraction of the mass in an annulus; individual dynamical interactions are much smaller than the Fokker-Planck stirring rates. Thus, kinetic theory yields good estimates for collisions and stirring among small objects. As objects grow beyond 1000 km, however, both assumptions of our statistical approach begin to fail: (i) the collisional cascade removes leftover planetesimals, increasing the fraction of mass in the largest objects and (ii) individual interactions among the largest objects in an annulus can deflect large objects into neighboring annuli, raising collision and stirring rates significantly. With 100–1000 Pluto-mass objects at 30–150 AU (see Tables 2–3), interactions among the largest objects could play a significant role in the late-time evolution of our models.
Dynamical interactions among an ensemble of Pluto-mass planets occur when the radial spacing is , where is the Hill radius in Eq. (22). For planets with mass g and = 1 M⊙, = 0.001 . Thus, dynamical interactions among the largest objects are inevitable when 50–100 in a region with a radial extent 0.2 (Goldreich, Lithwick, & Sari, 2004; Kenyon & Bromley, 2006). Many of our calculations yield such large numbers of Pluto-mass objects.
To save computer time, we did not calculate the typical long-term evolution of hundreds of Plutos using our hybrid evolution code (Bromley & Kenyon, 2006). However, we can infer the outcome from scaling the results of calculations for the formation of the Earth at 1 AU (e.g., Chambers, 2001; Bromley & Kenyon, 2006; Kenyon & Bromley, 2006). At 0.4–2 AU, dynamical evolution of 100–200 lunar mass objects produces several Earth-mass planets in 10–30 Myr. The spacing of lunar mass objects in these calculations is 70% of the critical spacing , similar to the spacing of Pluto-mass objects at late times in our calculations at 30–150 AU. Scaling the evolution times by the ratio of orbital periods suggests that 100–200 Pluto mass objects collide to form planets with masses 0.1 M⊕ on 1–3 Gyr timescales (see also Levison & Stewart, 2001; Goldreich, Lithwick, & Sari, 2004).
This analysis suggests that dynamical interactions between large numbers of Plutos at 30–150 AU are interesting only for low mass stars. For 2–3 M⊙ stars, the main sequence lifetimes are shorter than the time needed for Plutos to interact, to collide, and to grow into Mars-mass planets. For lower mass stars, several test calculations with our hybrid code confirm that ensembles of 100–200 Plutos can grow into several Mars-mass planets on timescales of 2–5 Gyr444For 75 AU, the escape velocity of Mars-mass planets exceeds the orbital velocity. Although dynamical interactions among Mars-mass objects can produce ejections in these circumstances (Goldreich, Lithwick, & Sari, 2004), damping by leftover planetesimals limits ejections in our simulations.. Although this evolution leads to some extra stirring of leftover low mass planetesimals, there are only small changes in the dust production rate and the total mass in small grains. Thus, dynamical interactions among Plutos have little impact on our general results.
3.3.2 Fragmentation parameters
Fragmentation is another uncertainty in our calculations. We treat destructive collisions with an energy-scaling algorithm that uses (i) the ratio of the center of mass collision energy to the critical disruption energy and (ii) a simple power-law size distribution to apportion ejected material into lower mass bins. Although the energy-scaling algorithm yields a reasonable treatment of collisions in coagulation calculations, the disruption energy sets the strength of the collisional cascade. Large leads to a weak cascade with little debris; small allows a strong cascade with significant debris. Because and the size distribution of the ejecta set the amount of material in small grains, we now discuss how our choices for these input parameters affect our results.
Detailed comparisons of various approaches suggest that the size distribution of the ejected mass has little impact on our results. For the large collision rates in our calculations, all methods for dividing ejected mass among lower mass bins – including dividing the ejected mass equally among 2–3 lower mass bins – leads to a power-law mass distribution with a characteristic slope of (Dohnanyi, 1969; Williams & Wetherill, 1994). Thus, the adopted mass distribution for the ejecta is relatively unimportant.
Kenyon & Bromley (2005) and Kenyon et al. (2008) describe how the form of in Eq. (5) impacts collisional evolution of icy objects at 30–150 AU. Here, we divide into a bulk component (the first term of Eq. (5)) and a gravity component (the second term of Eq. (5)). Gravity provides nearly all of the binding energy for large objects with 10 km; the bulk component of provides most of the binding energy for small objects with 1–10 km. For icy objects with maximum sizes 2000 km, stirring never leads to orbital motions large enough to disrupt objects with 10–20 km. Thus, our choices for the gravity component of have little impact on our results. Although both components of the bulk strength – and – contribute to , quoted uncertainties in derived from theoretical simulations lead to unimportant variations in as a function of . Thus, we concentrate on .
To quantify the impact of on our results, we first consider the evolution of the dust production rate and the amount of material in large and small grains. During runaway growth, the dust production rates for models with erg g-1 are 10%–20% larger than dust production rates for models with erg g-1. At the same time, the total mass in large and small grains is 10 times larger for models with small than for models with large . In both cases, models with the smallest initial disk mass have the largest differences as a function of . During oligarchic growth, these differences disappear. For models with erg g-1, the dispersion in dust production rates near the time of maximum dust production is 5% or less for all disks around 1–3 M⊙ stars. Although the dispersion in the total mass in large and small grains is a factor of 3 during the early stages of oligarchic growth, the dispersion in dust masses declines to 10% or less at late times when the dust masses reach their maximum values (Kenyon & Bromley, 2004b).
The time variation in dust production rate and total dust mass as a function of has a simple physical origin (see also Kenyon et al., 2008). During runaway and oligarchic growth, the collision energies of small objects scale with the mass of the largest objects in the grid (see also Goldreich, Lithwick, & Sari, 2004). Thus, small objects have larger and larger collision energies at later and later evolution times. Because this feature of the evolution depends only on gravitational stirring, it is independent of . Throughout the evolution, the mass ejected in a collision scales with (Eq. (4)). Thus, calculations with small eject more material at early times compared to models with large , leading to a large dispersion in the dust production rate and total dust masses early in the evolution. At late times, all calculations produce objects with 1500–2000 km. These large objects stir all leftover small planetesimals to large random velocities, where the collision energies for all . All collisions then lead to copious mass loss, which eliminates the dispersion in dust production rates and total dust masses at late times (see also Kenyon & Bromley, 2004b).
In addition to the small late-time dispersion in dust production rates and total dust masses, our results yield negligible differences in the late-time fractions of mass in large objects ( 100 km) as a function of . The median radius of the largest object and the median number of Pluto mass objects are also independent of . Thus, our analysis suggests that the fragmentation parameters have a small impact on observable quantities. For low mass disks at 10 Myr, destructive collisions between planetesimals with small produce more dust than objects with large . Although these differences are probably large enough to be observable, they disappear at late times when planets reach their maximum sizes.
3.3.3 Treatment of small particles
Our algorithm for deriving the evolution of small particles with 1 m is a final uncertainty in our calculations. To follow the evolution of sizes and orbits for large objects in a reasonable amount of computer time, we do not calculate the evolution of small particles directly. Instead, we use the known production rate of small particles from the detailed calculation , an adopted power-law size distribution, and a simple collision algorithm to evolve the small particle size distribution with time.
Because we include radiation pressure and Poynting-Robertson drag in this simple treatment of collisional evolution, our predicted size distributions consist of three distinct pieces. For particle sizes where the collisional timescale is shorter than the timescale for Poynting-Robertson drag, . For very small sizes where radiation pressure ejects grains, we adopt for grains in a constant velocity outflowing wind (see the Appendix). For intermediate sizes, Poynting-Robertson drag can remove grains faster than collisions replenish them. Thus, the particle number 0. To conserve mass, we solve a continuity equation to derive the number density of grains dominated by Poynting-Robertson drag.
Although our solution for the evolution of small particles is efficient, it does not consider how fluctuations in the collision and fragmentation rates might modify the size distribution. Campo Bagatin et al. (1994) note that size-dependent fluctuations can produce wavy size distributions for 0.1–10 mm particles. In their simulations of the Pic disk, Thébault, Augereau, & Beust (2003) derive steady-state size distributions with substantial deficits of 0.1–10 mm particles compared to a standard power-law (see also Krivov et al., 2006; Thébault & Augereau, 2007; Löhne et al., 2008). If these deficits are typical, then our algorithm seriously overestimates the mass in small dust grains and thus the infrared fluxes of debris disks.
To check for this possibility, we computed several models with a simple version of our multiannulus coagulation code. In these tests, we extracted a complete disk model near the peak of the collisional cascade, extended the lower end of the size distribution from = 1 m to 1 m using a power law , and continued the calculation for 100 Myr with collisions and Poynting-Robertson drag but without our Fokker-Planck velocity evolution. To estimate the range of errors in our simple algorithm, we varied the power law exponent for the size distribution, 0.6–1, the power law exponent for the fragmentation law, -0.5–0, and the magnitude of the bulk strength = 1– erg g-1. For a range of disk masses around a 2 M⊙ star, this approach provides a straightforward estimate for the accuracy of our results for small particles.
These tests confirm that the simple collision algorithm yields results reasonably close to more detailed coagulation calculations. For models with 0, erg g-1, and 0.6–1, the derived size distributions are within 20% of those predicted by the simple model for all particles with 0.01–100 mm. Although calculations with erg g-1 yield larger deviations from the simple model, these are small compared to those quoted by Thébault & Augereau (2007). Because particles with small are harder to fragment, calculations with tend to produce smaller departures for a power law size distribution than those with .
Several features of our calculations combine to minimize wavy size distributions for small particles in disks at 30–150 AU. Because icy planet formation is inefficient, the collisional cascade begins when most of the initial disk mass is in 1–10 km planetesimals. Fragmentation of the leftovers leads to a very large production rate of 1 m and smaller objects. Continued fragmentation of these objects tends to wash out wavy size distributions produced by a low mass cutoff (Campo Bagatin et al., 1994; Thébault, Augereau, & Beust, 2003). In our Fokker-Planck treatment of velocity evolution, leftover planetesimals are also in dynamical equilibrium with larger protoplanets that are ‘safe’ from fragmentation. Thus, the dust production rate from the collisional cascade is well-matched to the dynamical state of the system and tends to sustain a power-law size distribution for the smallest objects.
3.4 Highlights of Icy Planet Formation Around 1–3 M⊙ Stars
Starting with a disk of 1 km planetesimals, icy planet formation at 30–150 AU follows the same path for all 1–3 M⊙ stars. This evolution has six main features.
-
•
It takes 5–30 Myr for runaway growth to produce an ensemble of oligarchs with radii of 500–1000 km. Throughout runaway growth, oligarchs stir up the orbits of leftover planetesimals. Collisions between leftover planetesimals produce more and more debris.
-
•
From 10 Myr to the main sequence turnoff, planets slowly grow to a characteristic radius. For a broad range of input parameters, the maximum size of an icy planet is 1750 km at 30–150 AU. Because the timescale for planet formation at 100–150 AU is similar to the main sequence lifetime of a 1–3 M⊙ star, the inner disk contains more 1500–2000 km planets than the outer disk.
-
•
As planets grow slowly, a collisional cascade grinds leftover planetesimals to dust. Early on, radiation pressure ejects the smallest grains in an outflowing wind. Later, Poynting-Robertson drag also removes larger grains from the disk. In our calculations, radiation pressure removes roughly twice as much mass from the disk as Poynting-Robertson drag. The timescale for the collisional cascade to remove leftover planetesimals is close to the main sequence lifetime of the central star. Thus, the cascade removes more material from the inner disk than from the outer disk.
-
•
Icy planet formation is inefficient. In our calculations, icy planets with radii exceeding 1000 km contain 3–4% of the initial mass in solid material. Objects with radii 100–1000 km contain 2–3% of the initial mass. Because short stellar lifetimes limit the growth of planets in the outer disk, the mass in large objects declines linearly with increasing distance from the central star. Thus, the inner region of the disk contains many more Pluto-mass objects than the outer region.
-
•
The dust produced by the collisional cascade is observable. For disks around 1–3 M⊙ stars, the maximum mass in small dust grains with radii of 1 m to 1 mm is 1–2 lunar masses. This mass is comparable to the masses derived for the most luminous debris disks around A-type and G-type stars. The time evolution of the dust production rate and the mass in small dust grains suggest the dust luminosity declines with time.
-
•
Dusty debris is a signature of the formation of a planetary system. This debris is present throughout the lifetime of the central star.
4 DEBRIS DISK EVOLUTION
To convert our derived size distributions into observable quantities, we perform a radiative transfer calculation. For each evolution time , we derive the luminosity and effective temperature of the central star from the stellar evolution models (Demarque et al., 2004). We then compute the optical depth of each annulus in our model grid. The optical depth allows us to derive the fraction of the stellar luminosity absorbed by each annulus. For each grain size in each annulus, we derive an equilibrium grain temperature and an emitted spectrum. Summing the emitted spectra over and yields the predicted spectral energy distribution (SED) and the total dust luminosity as a function of time. The Appendix describes this calculation in more detail (see also Kenyon & Bromley, 2004b).
In our calculation of observable quantities, the most important input parameters are the smallest stable grain size (also known as the ‘blowout’ radius; see Backman & Paresce 1993) and the slope of the emissivity law for small grains. Although several estimates for the minimum grain size suggest m for 1–3 M⊙ stars (e.g. Burns, Lamy, & Soter, 1979; Artymowicz, 1988; Backman & Paresce, 1993; Kimura et al., 2002), the coefficient and the scaling relation are sensitive to the composition, internal structure, and radiative properties of the grains. Because observations allow few tests of this relation, we adopt = 1 m for all stars. If more luminous stars have larger , our calculations overestimate the optical depth in small grains. Thus, we overestimate the mid-IR and submm excesses. For the emissivity, submm data suggest 0.6–1 from a handful of debris disks (Najita & Williams, 2005; Williams & Andrews, 2006). To provide some balance for our likely underestimate of , we adopt = 1. Grains with smaller emit more efficiently at longer wavelengths; our models then underestimate mid-IR and submm excesses.
To describe the evolution of observable quantities with time, we focus on the dust luminosity and the excesses at IR and submm wavelengths. The fractional dust luminosity provides a clear measure of the relative luminosity of the debris disk. For excesses at specific wavelengths, we quote the total emission of the disk and the central star relative to the emission from the stellar photosphere, . With this definition, disks that produce no excess have = 1; disks where the excess emission is comparable to the emission from the central star have = 2.
We begin this section with a discussion of excess emission for 1 M⊙ stars. After discussing results for 1.5–3 M⊙ stars, we conclude this section with a brief summary. To facilitate comparisons of our results with observations, Tables 4–8 list results for the fractional dust luminosity and excesses at 24–850 m. The paper version lists the first five lines of results for = 1/3, 1, and 3. The electronic version includes all results for these .
4.1 Evolution for 1 M⊙ stars
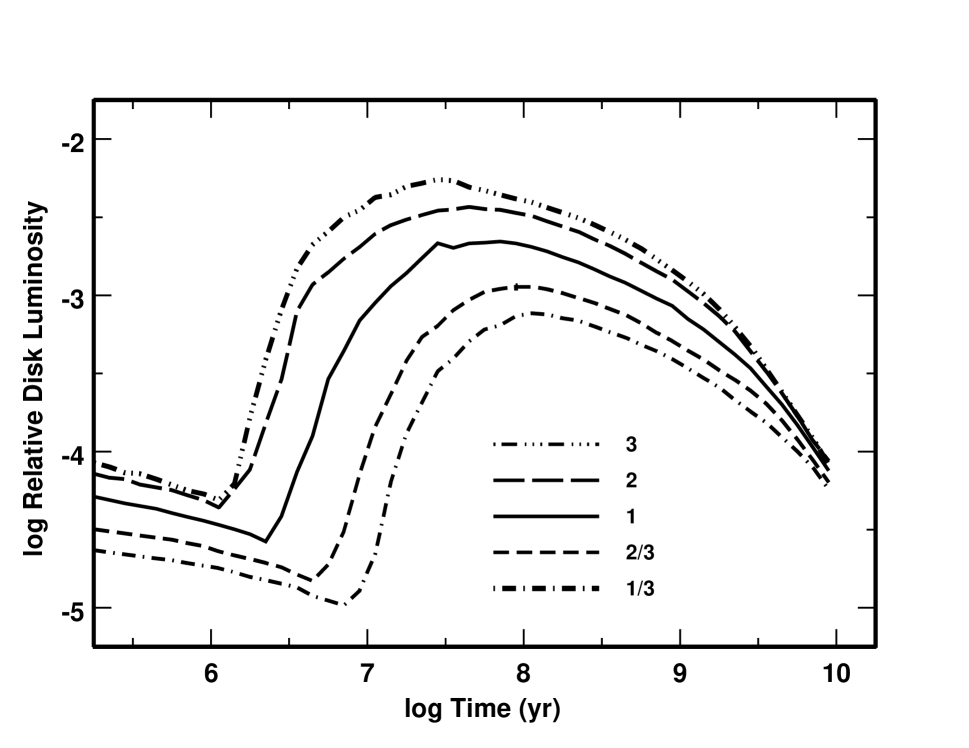
Fig. 14 shows the evolution of the fractional dust luminosity for disks surrounding a 1 M⊙ star. Early in the evolution, collisions produce mergers instead of debris. For an ensemble of growing planetesimals, the surface area per unit mass (and hence the opacity) decreases with time. Thus, declines with time. Less massive disks have smaller dust masses and smaller dust luminosities. As oligarchic growth begins, the dust luminosity rises rapidly and reaches a peak in 30–100 Myr. More massive disks reach larger peak luminosities earlier than less massive disks. At late times, all disks converge to the same dust luminosity, at 10 Gyr.
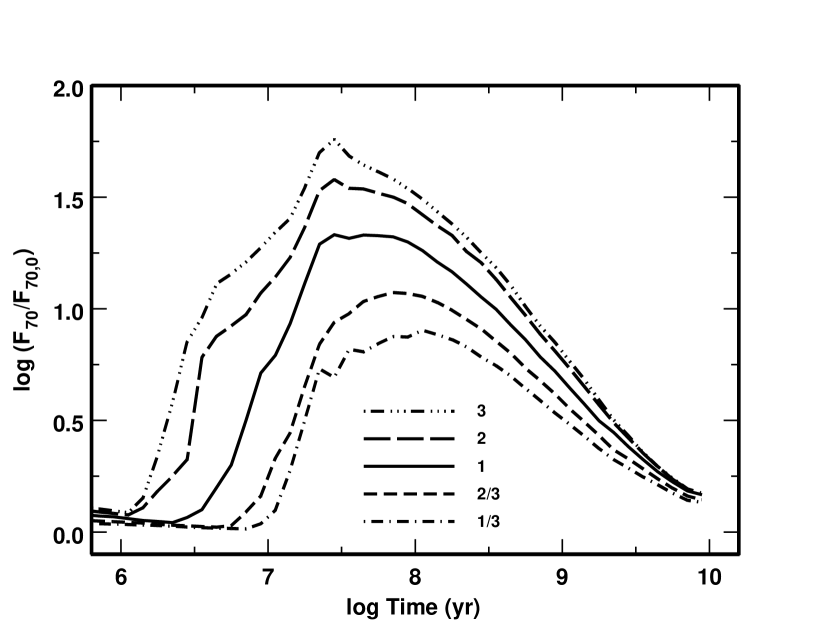
Despite their small fractional dust luminosities, these disks produce large excesses at 70 m (Fig. 15; left panel). For massive disks with = 2–3, the 70 m excess rises from 2–3 at 3 Myr to 30–50 at 30 Myr. Lower mass disks with = 1/3 to 1/2 produce smaller peak excesses at later times, 10 at 100 Myr. For all disk masses, the 70 m excess is close to its maximum value for a short period when planet formation peaks in the inner disk. The excess then declines with time. The rapid decline leads to modest excesses at late times, 3–5 at 1 Gyr and 2 at 3–10 Gyr.
The large excesses at 70 m are a simple consequence of blackbody radiation from small grains at 30–50 AU around a solar-type star. With typical temperatures 40–60 K, these grains emit most of their radiation at 50–70 m. The peak flux from a blackbody grain at temperature T is (Allen, 1976). Setting the total disk luminosity yields . At this wavelength, the stellar flux follows a Rayleigh-Jeans law, . Combining these relations and including a correction factor for inefficient radiation from small grains yields a simple relation for the 70 m flux from the disk and central star,
| (54) |
For the luminosities in Fig. 14, this relation accounts for the 70 m excesses in Fig. 15 at all times.
At longer wavelengths, the disks in our calculations achieve larger peak excesses and stay close to the peak excess for longer periods of time (Fig. 15; right panel). Disks reach their peak excesses at 850 m on timescales similar to those at 70 m, 30 Myr for disks with = 2–3 and 100 Myr for disks with = 1/3. The fractional excesses at 850 m are a factor of 2 larger than the excesses at 70 m. Because the emitting region evolves more slowly, these disks are luminous for 1 Gyr and then decline with time. Despite the rapid decline, the excesses are significant at late times, with 3–10 at 3–10 Gyr.
The time variation of IR excess also depends on the outer radius of the disk. For solar mass stars, grains at 30–50 AU in the inner disk produce most of the flux at 50–100 m. Thus, disks with outer radii of 70 AU and 150 AU produce similar 70 m excesses for 30 Myr (Fig. 16; left panel). Once the smaller disk reaches peak emission, the 70 m excess begins a dramatic decline. The larger disk maintains the peak excess for 30 Myr and then declines more slowly with time. For 100 Myr, the smaller disk is a factor of 2–3 fainter at 70 m than the larger disk.
The evolution of disks with different sizes is more dramatic at 850 m (Fig. 16; right panel). For typical grain temperatures 20–60 K, long wavelength emission from the disk follows the Rayleigh-Jeans tail of a set of blackbodies. The radiation from each disk annulus is then . Because the outer disk produces more long wavelength emission than the inner disk, the 850 m excess scales with the outer disk radius. For 1 Gyr, we derive , where is the outer radius of the disk and 3–4. Thus, doubling the outer disk radius increases the predicted 850 m excess by a factor of 10 at late times.
4.2 Evolution for 1.5-3 M⊙ stars
Several factors change the evolution of the dust luminosity and the IR/submm excesses in stars more massive than 1 M⊙. More massive stars are hotter; for the Y2 stellar evolution isochrones (Demarque et al., 2004). Thus, grains in the inner disks around massive stars are warmer, emit more short wavelength radiation, and produce bluer colors than disks around less massive stars. More massive stars also evolve faster, . Because the evolutionary timescales for solids in the disk are much less sensitive to stellar mass, , massive stars have more dust at the end of their main sequence lifetime than low mass stars (e.g., Fig. 13). Thus, these systems have relatively large IR excesses when their central stars evolve off the main sequence.
To compare the evolution of dust emission in debris disks around 1–3 M⊙ stars, we begin with the evolution of the dust luminosity (Fig. 17). Planets grow faster around more massive stars; thus, the dust luminosity rises earlier for more massive stars. Once the collisional cascade begins, the timescale to reach the peak luminosity depends only on the initial disk mass and the stellar mass,
| (55) |
This timescale is similar to the timescale required to produce the first Pluto-mass object in the inner disk (Eq. (41)). The peak luminosity depends only on the initial disk mass
| (56) |
The luminosity remains close to the peak for 10–30 Myr and then declines with time.
Stellar evolution has a clear impact on the evolution of the dust luminosity. For 1 M⊙ stars, the dust luminosity declines by a factor of 20 before the star evolves off the main sequence (Fig. 14). For 3 M⊙ stars, the typical decline in is only a factor of 4. Because debris disks have roughly the same peak luminosities, an ensemble of debris disks around middle-aged low mass stars should be systematically less luminous than disks around middle-aged high mass stars.
Stellar physics also produces dramatic differences in the behavior of the 24 m excess with stellar mass (Fig. 18; lower left panel). At 30–50 AU, the grain temperatures range from 40–60 K for 1 M⊙ stars to 80–120 K for 3 M⊙ stars. For these temperatures, radiation at 24 m is on the Wien side of the blackbody peak and thus varies exponentially with temperature. Our calculations for 1 M⊙ stars produce very little 24 m radiation from material at 30–150 AU. However, the peak 24 m excesses reach 20 for disks around 3 M⊙ stars. For all 1–3 M⊙ stars, our results yield
| (57) |
This maximum flux occurs at roughly the same time as the peak dust luminosity.
At longer wavelengths, the excesses are less sensitive to stellar mass. Radiation at 70 m is at the blackbody peak for grains in the inner disk. Thus, the inner disk produces most of the 70 m excess. The peak excess is then independent of the stellar luminosity and depends only on the total disk mass (Fig. 18; upper left panel),
| (58) |
For grains at 30–150 AU, radiation at longer wavelengths is on the Rayleigh-Jeans tail of the blackbody. Thus, observations at 160–850 m probe material throughout the disk. At 160 m, extra emission from hotter grains in disks around more massive stars is balanced by more flux from the hotter central star. Thus, the excess is independent of stellar mass and depends only on (Fig. 18; upper right panel),
| (59) |
At 850 m, grains in disks around 1 M⊙ stars are closer to their blackbody peaks than grains in disks around more massive stars. Thus, the 850 m excesses are larger for 1 M⊙ stars (Fig. 18; lower right panel),
| (60) |
At 70–850 m, the time of peak excess is similar to the maximum in the dust luminosity. Thus, all excesses at 24–850 m peak at 20–30 Myr for 1–3 M⊙ stars.
Following the peak in the excess at 20–30 Myr, the relative disk luminosity and the excesses at 24–850 m decrease monotonically with time. For this evolution, simple debris disk models predict a power law decline, with 1–2 (e.g. Dominik & Decin, 2003; Wyatt et al., 2007a, b). To compare our results for with these predictions, we adopt
| (61) |
and
| (62) |
and derive the power law exponents and from all of our calculations as a function of disk mass, stellar mass, and time.
Throughout the evolution of all our debris disk models, changes continuously with time. For , collisions and radiation pressure dominate the removal of small grains. As collision rates slowly decline with time, the exponent increases slowly from 0 to 1. When the central star approaches the end of its main sequence lifetime, Poynting-Robertson drag starts to dominate collisions. The disk luminosity then decreases rapidly; increases from 1 to 2. Because most systems are collisionally-dominated, our calculations yield a typical 0.6–0.8.
For 24–850 m, the exponents follow the evolution of . Because collision rates are larger in the warmer, inner disk than in the colder outer disk, increases slowly with . Thus, the typical 0.6–0.8 is smaller than the typical 0.8–1.0.
The exponents and are somewhat sensitive to the disk mass and the stellar mass. At fixed stellar mass, more massive disks evolve faster. Thus, changes faster for more massive disks and is larger at the main sequence turnoff. For fixed disk mass, lower mass stars live longer and have more time to reach the Poynting-Robertson drag-dominated regime. Our results suggest a 0.1–0.2 range in and for a factor of 10 range in and a factor of 3 range in stellar mass.
In addition to excesses at specific wavelengths, the evolution of color excesses yield interesting trends with stellar mass and time. Because the 24 m excess is sensitive to stellar mass, the [24]–[70] color cleanly distinguishes debris disks around stars of different masses (Fig. 19). For 2–3 M⊙ stars, [24]–[70] rises rapidly to [24]–[70] 1–2 at 1 Myr and then rises slowly throughout the main sequence lifetime of the central star. For 1–1.5 M⊙ stars, the color rises later, reaches [24]–[70] 3–4 at 30–100 Myr, and then declines slowly.
For disks at 30–150 AU, the variation of [24]–[70] with depends solely on the properties of the central star. Because more massive stars are hotter, their disks are warmer. Warmer disks produce bluer colors. Thus, the peak [24]–[70] scales with .
The mass-dependent color evolution of debris disks at 30–150 AU suggests that color-color diagrams can discriminate masses of the central star. In Fig. 20, color-color tracks for scaled MMSN around 1.5 M⊙ stars are clearly distinct from tracks for scaled MMSN around 2 M⊙ and 3 M⊙ stars. In Fig. 21, tracks for a range of disks around 2 M⊙ stars define a triangle-shaped locus distinct from the tracks for 1.5 M⊙ and 3 M⊙ stars.
To establish a triangular debris disk locus for each stellar mass, we define two vectors. Adopting a vertex, x0,y0, the upper boundary of the locus is a vector connecting the vertex with an upper point, xu,yu. The lower boundary is a second vector connecting the vertex with a lower point, xl,yl. Table 9 lists our results for the vertex and the upper/lower points as a function of stellar mass. For each stellar mass, colors for debris disks at 30–150 AU lie within the area defined by the two vectors. More massive disks produce redder colors. Within each locus, the initial disk mass scales with distance from the vertex.
When dust inside 30 AU produces a small IR excess, this color-color diagram provides a useful discriminant of stellar mass. For disks at 30–150 AU around 1–3 M⊙ stars, the typical [5.8]–[8] color is small, with [5.8]–[8] 0.1 at all times. Predicted colors for terrestrial debris disks are much larger. For 3 M⊙ (1.5 M⊙) stars, we predict maximum colors [5.8]–[8] 0.5–1 (0.2–0.5) (e.g., Kenyon & Bromley, 2004a, 2005). Thus, mid-IR color-color diagrams are useful diagnostics of the outer disk for [5.8]–[8] 0.1.
4.3 Summary
Planet formation and stellar evolution combine to produce several robust trends in the time evolution of the dust luminosity and IR/submm excesses from debris disks around 1–3 M⊙ stars.
For scaled MMSN, the maximum dust luminosity is . For an ensemble of debris disks, the range in the peak dust luminosity scales with the initial mass of solid material in the disk. The dust luminosity reaches this peak at roughly the time when the first Pluto-mass objects form at 30–50 AU. Following this peak, the luminosity declines as with 0.6–0.8. Because lower mass stars have longer main sequence lifetimes, debris disks around lower mass stars reach smaller fractional dust luminosities at late times.
The IR/submm excesses from debris disks at 30–150 AU are sensitive to the mass of the central star. At 24 m, disks around more massive stars produce larger excesses; disks around stars with 1 M⊙ produce negligible excesses at 24 m. At 70 m, the excess is a simple function of the total dust luminosity, 1 + . At 850 m, debris disks around 1 M⊙ stars produce larger peak excesses than disks around more massive stars. At late times, however, the typical 850 m excess is fairly independent of stellar mass, with 3–5 for stars with ages .
Among stars with different masses, mid-IR colors provide a sensitive discriminant of debris disk evolution when the [5.8]–[8] color is small (Fig. 19–21). For 2–3 M⊙ stars, [24]–[70] slowly becomes redder with the age of the central star; for 1–1.5 M⊙ stars, [24]–[70] rises more rapidly, remains at peak color for 300 Myr to 1 Gyr, and then declines rapidly with time. For all stars, [8]–[24] and [24]–[70] correlate with stellar mass. Debris disks around 2–3 M⊙ (1–2 M⊙) stars have redder (bluer) [8]–[24] colors and bluer (redder) [24]–[70] colors. Thus, an [8]–[24] vs [24]–[70] color-color diagram provides a way to analyze debris disks around stars with different masses (Table 9).
5 APPLICATIONS
To test whether our predictions provide a reasonable match to observations, we now consider several applications of our models to real systems. For these calculations, the broad trends in the evolution of IR excesses and colors are sensitive to the physics of planet formation and the collisional cascade. Thus, our main goal is to compare our results with observed trends of excesses and colors for large samples of main sequence stars observed with the IRAS, ISO, and Spitzer satellites. In addition to long-term trends, the absolute level of the excesses depends on and . Thus, our second goal is to learn whether our assumptions yield mid-IR and submm excesses similar to those observed.
We begin with an analysis of Spitzer data for the prototypical debris disk, Vega. After demonstrating that our models can explain the mid-IR fluxes and morphology of Spitzer images for this system, we show that our predictions provide a good match to observations of mid-IR excesses for a sample of A-type stars (Rieke et al., 2005; Su et al., 2006) and a sample of solar-type stars (Beichman et al., 2006; Hillenbrand et al., 2008).
5.1 The Vega Disk
Observations of Vega with IRAS first revealed a large excess of emission above the A-type photosphere for wavelengths exceeding 12 m (Aumann et al., 1984). The best-fitting single temperature blackbody to the IRAS data yields a temperature of 85 K, a fractional luminosity of relative to the central star, and a radius of 150–200 AU for the emitting material. Because the lifetime for small grains at 150–200 AU is much shorter than the age of Vega, Aumann et al. (1984) concluded that the grains have sizes larger than 1 mm. Thus, Vega provided the first direct evidence for grain growth outside the Solar System.
Since the Aumann et al. (1984) discovery, Vega has become the prototypical debris disk (e.g., Backman & Paresce, 1993; Artymowicz, 1997; Lagrange et al., 2000). The debris consists of a bright torus with small-scale clumps at 80–1000 AU from the central star (Holland et al., 1998; Wilner et al., 2002; Liu et al., 2004; Su et al., 2005) and a smaller disk of debris at 1 AU from the central star (Absil et al., 2006). Dust in the small disk is hot ( 1500 K), luminous ( ), and mostly confined to a narrow ring with a diameter of 0.5–1 AU (Absil et al., 2006). This dust might be a result of collisions between larger objects at 1 AU or grains lost from icy comets at 80–100 AU in the outer disk.
Recently, Su et al. (2005) analyzed high quality Spitzer images at 24, 70, and 160 m. Their results demonstrate that the large-scale debris consists of a bright ring at 80–200 AU and a smooth ‘halo’ that extends to 1000 AU at 160 m. The halo has an radial density profile, consistent with a wind of small grains ejected by radiation pressure. Fits to the radial surface brightness profiles and the spectral energy distribution suggest the grains in the wind have sizes of 1–50 m and a total mass of M⊕. The grains in the bright ring are larger, with typical sizes of 240 m, and have a total mass of M⊕ (see also Marsh et al., 2006). For an adopted residence time of yr in the wind, the mass in small grains implies that larger grains in the ring produce smaller dust particles at a rate of g s-1.
To check whether our model predictions can match the MIPS data for Vega, we make a simple comparison with median results from several calculations. In addition to the observed fluxes at 24, 70, 160, and 850 m (Su et al., 2005), we adopt published values for the age (200 Myr; Su et al., 2006), luminosity (37 L⊙; Aufdenberg et al., 2006), and mass (2.3 M⊙; Aufdenberg et al., 2006) of the central star. Su et al. (2005) separate the observed fluxes into contributions from the debris disk and the central star. The first row of Table 10 lists these results, along with their derived values for the mass in 1–50 m dust grains and the dust production rate. The rest of Table 10 lists predictions for four of our debris disk models around 2–2.5 M⊙ stars.
The comparison in Table 10 suggests a reasonable match to the data. Predictions for the total mass in 1–50 m dust grains and the fluxes at 160 m and at 850 m bracket the observed values. Our models also predict a bright ring in the 70–160 m dust emission at 80–130 AU, close to the observed position of the bright ring inferred from Spitzer images (85–200 AU; Su et al., 2005). The mass of 0.1–1 mm particles in this ring, M⊕, also agrees with the mass in 240 m grains derived from the Spitzer data. However, our models overpredict the fluxes at 24 m and at 70 m by a factor of 2–10 and underpredict the dust production rate by a similar factor.
To understand possible origins for the mismatches between the data and the models, we consider the evolution of small grains in our calculations. When the collisional cascade starts removing material from the disk, the most destructive collisions involve grains with comparable masses. These collisions gradually erode the parent objects and produce modest amounts of debris in smaller particles. Because (i) the collision timescale is much shorter than the timescale for Poynting-Robertson drag and (ii) the ratio of the radiation force to the gravitational force is , erosion continues until particles reach a size where 0.5–1 (Burns, Lamy, & Soter, 1979). Particles with are ejected. For simplicity, we assume 1 m for all of our calculations.
In this picture for the collisional cascade, the Su et al. (2005) results provide a simple solution for the overprediction of the 24–70 m fluxes in our calculations. If grains with 1 m are in the wind, our ‘Vega models’ underestimate the mass in the wind and overestimate the mass left behind in the disk. More mass at larger distances from the central star lowers the optical depth in the inner disk, reducing the predicted fluxes at short wavelengths. Thus, increasing our adopted for Vega models should provide a better match between observed and predicted fluxes at 24 m and at 70 m. For an adopted = 60 L⊙, Backman & Paresce (1993) estimated = 14 m. Scaling this result for our adopted = 37 L⊙, 8.5 m. Several test calculations with 10 m yield predicted 24 m and 70 m fluxes close to the observed values.
Reconciling the estimated dust production rate with our predictions requires a more rigorous analysis of dust production and ejection in the Vega debris disk. To derive the dust production rate, Su et al. (2005) assume that (i) the 240 m grains in the bright ring are bound, with 0 and residence times yr, and (ii) the 1–50 m grains in the wind are unbound, with 1 and residence times yr. If the collisional cascade proceeds as a gradual erosion of larger objects into smaller objects, however, we expect a more gradual transition from grains with 0 to grains with 1 (see also Burns, Lamy, & Soter, 1979; Artymowicz, 1988). Allowing the residence time to change gradually from the bound 240 m grains to the unbound 1 m grains provides a way to lower the apparent dust production rate and to resolve the mismatch between our models and the observations.
To provide an alternate estimate for the residence time of grains in the Vega disk, we consider the collision times in the ring and the wind. We adopt the dust masses derived from the Spitzer images ( and ) and a typical particle size . For a ring at 150 AU with a width 50 AU, the collision time for a single grain is
| (63) |
where is the local orbital period in yr (Lissauer, 1987; Wetherill & Stewart, 1993; Kenyon & Luu, 1998). Collision times in the wind are similar. For yr at 150 AU, the collision times range from yr for 1 m grains to yr for 240 m grains.
If we assume that the residence times are comparable to the collision times, we can construct a self-consistent picture for the collisional cascade in the Vega disk. Collisions in the bright ring gradually erode 200–300 m grains until they reach sizes 100 m, when they become incorporated into the wind. Collisions in the wind gradually erode the smaller grains until they reach sizes 1 m, when they are ejected rapidly from the system.
As long as the 200–300 m grains are replenished from a reservoir of larger grains, this cascade can remain in a quasi-steady state over the main sequence lifetime of Vega. The required mass for the reservoir of larger objects is 100–1000 times the current mass in 240 m grains, 1–5 M⊕. This mass is small compared to the initial mass of solid material in a torus at 80–200 AU in a scaled MMSN, 50–100 M⊕ (Eq. (27)). Because the optical depth of this reservoir is small, it produces a small IR excess compared to the emission from smaller grains.
This picture relies on two features of the collisional cascade. We need an approximate equivalence in mass between the large grains in the ring and the small grains in the wind. The Su et al. (2005) mass estimates support this feature. We also need a gradual change in grain lifetime from the yr collision timescale of the large grains to the yr dynamical lifetime of the smallest grains. Otherwise, collisions in the broad torus cannot occur fast enough to maintain the current smooth structure of the wind for timescales longer than yr. Current theoretical analyses support this idea (Burns, Lamy, & Soter, 1979; Artymowicz, 1988; Takeuchi & Artymowicz, 2001; Grigorieva et al., 2007). Numerical simulations of a collisional cascade with a careful treatment of the interactions between the radiation field and the small grains could test this proposal in detail (e.g., Grigorieva et al., 2007).
We conclude that our calculations provide a reasonable match to observations of Vega. If we adopt 10 m, the data are consistent with a standard collisional cascade within a broad torus at 80–200 AU. The cascade feeds an outflowing wind of small grains with sizes 1–50 m. If the grain lifetime changes smoothly from yr for large grains to yr for small grains, the cascade can maintain the wind indefinitely.
5.2 Debris Disks Around A-type Stars
Since the discovery of the Vega debris disk, IRAS, ISO, and Spitzer observations have revealed debris around dozens of nearby A-type stars (Backman & Paresce, 1993; Lagrange et al., 2000; Rieke et al., 2005; Su et al., 2006). Like Vega, several of these disks are resolved and thus provide important information on the radial structure of the dusty disk (e.g., Smith & Terrile, 1984; Stapelfeldt et al., 2004; Kalas, 2005; Meyer et al., 2007; Su et al., 2008). Although most A-type stars with debris disks are unresolved, the sample is large enough to probe the time evolution of debris around 1.5–3 M⊙ stars. We now consider whether our calculations can explain this evolution.
To compare our model predictions with observations, we examine data for nearby A-type stars from Rieke et al. (2005) and Su et al. (2006). Rieke et al. (2005) combined 24–25 m data from IRAS and ISO with new 24 m photometry from Spitzer to investigate the decay of planetary debris disks around 266 A-type stars. Su et al. (2006) analyze a sample of 160 A-type stars with high quality 24 m and/or 70 m data acquired with MIPS on Spitzer. The combined sample has 319 (160) stars with 24 m (70 m) observations, spectral types B7–A6, and ages 5–850 Myr. From the Kenyon & Hartmann (1995) table of stellar effective temperatures and spectral types and the Demarque et al. (2004) stellar evolution tracks, 75% ( 85%) of the stars in the Rieke et al. (2005) (Su et al., 2006) sample have masses of 1.7–2.5 M⊙. Thus, we compare these data with our results for debris disk evolution around 2 M⊙ stars.
The observed 24–70 m excesses of A-type stars show a clear trend with the age of the star (Fig. 22–23). Although the statistics are poor, the data suggest a rise in the 24 m excess at 5–10 Myr. The larger sample of young stars with 70 m excesses provides better evidence for this rise. At both wavelengths, the excess has a broad peak for stars with ages of 10–30 Myr. At later times, the excess declines with time as with 0.5–1 (see also Decin et al., 2003; Greaves & Wyatt, 2003; Rieke et al., 2005; Rhee et al., 2007a).
To improve the statistics for 24 m excesses around younger stars, Currie et al. (2008a) added Spitzer data for many young clusters to the Rieke et al. (2005) sample. This expanded set of data provides unambiguous evidence for a rise in the typical 24 m excess at stellar ages of 5–10 Myr and a robust peak in the excess at stellar ages of 10–15 Myr. As in Fig. 22, the 24 m excesses for this larger sample of A-type stars decline with age from 20 Myr to 1 Gyr.
In addition to the long-term time evolution of mid-IR excess, the data also indicate a large range in the 24–70 m excess at fixed stellar age (Rieke et al., 2005; Carpenter et al., 2006; Su et al., 2006; Currie et al., 2008a). Although younger stars are more likely to have mid-IR excesses than older stars, there are many stars without excesses at every age. For ages 200 Myr, stars are equally likely to have any excess between zero and the maximum excess at that age. As stars age, they are less likely to have an excess close to the maximum excess at that age. Thus, the dispersion in the excess declines with time.
Our calculations provide a good match to the time evolution of the amplitude of the 24–70 m excesses. At both wavelengths, the models explain the rise in the amplitude at 5–10 Myr, the maximum at 10–20 Myr, and the slope of the power-law decline at late times. For models with = 1–3, the predicted excesses also agree with the maximum observed excesses. Although there are a few stars with excesses larger than the model predictions, more than 99% of the A stars in this sample have excesses within the range predicted in our calculations.
Our calculations also provide a natural explanation for a large range in the observed 24–70 m excesses at fixed stellar age. At 70 m, the maximum excess is roughly proportional to the initial disk mass (Eq. (58)). Thus, a factor of ten range in initial disk masses yields nearly a factor of ten range in the maximum excess at 70 m. For stars with ages 10–300 Myr, the Spitzer observations suggest a factor of 100 range in the 70 m excess. If this range is set by the initial disk mass, our models suggest initial disk masses with = 0.03–3.
Variations in the initial disk radius can also produce a range in 24–70 m excesses at fixed stellar age (e.g., Fig. 16). For 2 M⊙ stars with ages 400–800 Myr, our results suggest that a factor of three variation in the outer disk radius (e.g., 50–150 AU) yields a factor of two (five) variation in the amplitude of the 24 m (70 m) excess. Although the observed range in the amplitude of the 24 m excess for older A stars agrees with this prediction, the range at 70 m is much larger. Thus, variations in the initial disk radius can explain some of the observed range of excesses at 24–70 m.
Observations of the youngest stars support a large range in initial disk masses and disk radii. Submillimeter observations of dusty disks in the nearby Ophiuchus and Taurus-Auriga star-forming regions indicate a 2–3 ( 1) order of magnitude range in the masses (radii) of disks surrounding young stars with typical ages of 1 Myr (e.g., Osterloh & Beckwith, 1995; Motte & André, 2001; Andrews & Williams, 2005, 2007a,b). Our models with = 3 have disk masses a little smaller than the maximum dust masses derived from the submillimeter surveys. Thus, the submillimeter data imply disks with initial masses 5 and initial disk radii 50 AU 1000 AU. Disks with this range of initial masses and outer radii can produce the range of 24–70 m excesses observed around nearby A-type stars.
Variations in the initial surface density distribution can also lead to a range in the 24–70 m excess. In our calculations, we adopted a ‘standard’ surface density relation with . Compared to this model, disks with shallower (steeper) surface density distributions have relatively more (less) mass at large semimajor axes. The outer disk has cooler grains than the inner disk; thus, disks with shallower (steeper) surface density distributions should produce more (less) flux at longer wavelengths than our standard models. Because the relative fluxes at 24 m and at 70 m provide a measure of the relative disk masses at different semimajor axes, color indices provide a natural measure of the gradient of the surface density distribution.
Fig. 24 compares the predicted color evolution for disks around 2 M⊙ stars with data from Su et al. (2006). Although current observations do not probe the evolution well at 1–10 Myr, disks have a large color range, [24]–[70] 1–3, for stars with ages 10 Myr. For older stars, the data suggest a slow rise in the maximum color from [24]–[70] 3 at 10 Myr to [24]–[70] 3.5 at 100 Myr. After 300 Myr, the maximum color declines. For all stars older than 100 Myr, the range in color is 3–4 mag.
Our models match the observed color evolution. At all ages, the predicted colors for calculations with = 3 provide a clear upper envelope to the observed colors. The predicted colors also explain the slow rise in the maximum observed color for stars with ages of 10–100 Myr. To explain the full range in observed colors for 100 Myr to 1 Gyr old stars, we require disks with initial masses 0.01–3. This range is similar to the range required for the time evolution of the 24 m and 70 m excesses.
The good match to the color observations suggests that the typical initial surface density distribution is reasonably close to our adopted . For disks with shallower gradients, we expect redder colors at later times. A few stars lie above our model predictions; however, most stars have bluer colors than models with = 3. Thus, few disks in these samples require shallower surface density distributions. Disks with steeper surface density distributions can produce stars with blue colors, [24]–[70] 1, at late times. A large sample of A-type stars with [70]–[160] colors and spatially resolved observations of the radial dust distributions of these stars would provide a constraint on the initial surface density gradient.
Despite our success in matching these observations, other physical processes may be needed to explain the full diversity of debris disk properties for A stars with similar ages and luminosities. In their analysis of the large debris disk surrounding Oph, Su et al. (2008) examine a dozen main sequence stars with A0–A3 spectral types, ages of 150–400 Myr, and fractional disk luminosities to (see also Su et al., 2006). Although all of these stars have dust with 50–100 K, Fomalhaut has a bright torus of dust with weak or negligible emission from a wind of small grains, Vega has a bright torus with a luminous wind of small grains, and Oph has an extended disk ( 500 AU) of dust apparently bound to the star. Some A0–A3 stars have warm inner disks with dust temperatures 100 K to 200 K; other A stars have no obvious warm dust emission. Su et al. (2008) conclude that collisional cascades in disks with a range of masses and other processes, such as the formation of giant planets or recent catastrophic collisions, combine to produce the wide range of observed properties in this sample.
In principle, our models can explain some of this diversity. The Su et al. (2008) sample contains A stars with a factor of five range in . Thus, these stars probably have a factor of five range in the blowout radius (see also §5.1; Artymowicz, 1988; Backman & Paresce, 1993). If the protostellar disks around these stars had properties similar to those observed in Taurus-Auriga (Andrews & Williams, 2005, 2007a), they probably had a factor of ten range in initial disk mass, a factor of three range in initial disk radius, and a 50% range in the slope of the initial surface density distribution. Coupled with a similar dispersion in initial conditions for the terrestrial zones of these stars (Kenyon & Bromley, 2005), our results suggest that this range in initial conditions can produce a broad diversity of debris disks. We have started a suite of calculations to address this issue. Larger samples of A stars with resolved disks will provide crucial tests of these calculations.
Other aspects of planet formation are also important. If the cores of gas giant planets form before their parent stars reach the main sequence, we expect gas giants at 20–30 AU around 2–3 M⊙ stars (e.g., Kennedy & Kenyon, 2008). Gas giants rapidly remove debris in the inner disk and impose structure in the debris beyond 30 AU (e.g., Wilner et al., 2002; Moro-Martín & Malhotra, 2005). Because gas giants are common around evolved A stars (Johnson et al., 2007), gas giants probably play a significant role in the evolution of debris disks around A stars.
Catastrophic collisions may also produce diversity among A star debris disks (e.g., Wyatt & Dent, 2002; Su et al., 2005). Although debris from complete disruption of colliding planetesimals is unobservable in our simulations (see also Kenyon & Bromley, 2005), dynamical events similar to those that produced the Late Heavy Bombardment in the Solar System probably are visible (e.g., Gomes et al., 2005). Testing this idea requires numerical calculations that link the dynamics of massive planets with the collisional evolution of smaller objects (e.g., Charnoz & Morbidelli, 2003; Kenyon & Bromley, 2006).
We conclude that our debris disk models can explain the overall time evolution of the IR excesses and IR colors of A-type main sequence stars at 24 m and at 70 m. Our calculations for disks with = 1/3 to 3 around 2 M⊙ stars fit the overall level of the excesses and the trends with stellar age. Explaining the full range of observed IR excesses and IR colors requires a set of disks with = 0.01–3, as suggested from observations of disks around the youngest stars. Matching other properties of these stars – including the relative amount of emission from a warm inner disk, an outflowing wind of small grains, and a large outer disk – requires calculations that include a broader range of initial disk radii and gas giant and terrestrial planet formation at 30 AU (e.g., Kenyon & Bromley, 2005; Nagasawa et al., 2007; Kennedy & Kenyon, 2008; Ida & Lin, 2008; Kretke et al., 2008).
5.3 Debris Disks Around Solar-type Stars
Although most of the debris disks discovered with IRAS and ISO have A-type central stars, a few have F-type or G-type central stars with masses of 1–1.5 M⊙ (Backman & Paresce, 1993; Lagrange et al., 2000; Decin et al., 2003; Song et al., 2005; Rhee et al., 2007a). More recent Spitzer observations reveal debris disks around many solar-type stars (Bryden et al., 2006; Beichman et al., 2006; Meyer et al., 2006; Trilling et al., 2008; Hillenbrand et al., 2008). Although several Spitzer programs concentrate on older solar-type stars as preparation for detailed planet searches, the range of ages is large enough to provide an initial test of our predictions.
To compare our model predictions with observations, we consider data for nearby solar-type stars from Beichman et al. (2006) and Hillenbrand et al. (2008). Beichman et al. (2006) observed 80 solar-type stars at 24 m and at 70 m using MIPS on Spitzer. Hillenbrand et al. (2008) analyze 30 stars with 70 m excesses out of a sample of 328 stars from the Spitzer Legacy Science Program, “Formation and Evolution of Planetary Systems” (Meyer et al., 2006). After eliminating K-type and M-type stars from the Beichman et al. (2006) study, the two programs contain 80 stars with ages of 10 Myr to 10 Gyr. Most of these stars have masses of 0.8–1.5 M⊙. Thus, we compare these data with our results for debris disk evolution around 1 M⊙ stars.
The observed 70–160 m excesses of solar-type stars show trends similar to those observed in the evolution of A-type stars at 24–70 m (Fig. 25–26). Although the statistics for solar-type stars are poor for the youngest stars, the data suggest a rise in the 70–160 m excess at 10–100 Myr. The maximum in the 70 m excess is comparable in magnitude but a factor of 10 later in time than the maximum 70 m excess for A-type stars. At 70 m and at 160 m, the excess follows a roughly power-law decline with time for older stars. Solar-type stars also have a large range in excess at all ages, with 1–300 at 100 Myr and 1–30 at 1–3 Gyr. For stars with similar ages, the range in the 70 m excess is larger for solar-type stars than for A-type stars.
Our models match the observed trends for the IR excesses of solar-type stars. At 70 m, 65%–75% of the observations lie within model predictions; at 160 m, more than half of the observations are within model predictions. For a range of initial disk masses ( 0.01–3) and outer radii ( 70–150 AU), we predict a large range of excesses at all ages, as observed. These model also explain the larger 70 m excesses observed for solar-type stars relative to A-type stars, the apparent maximum in the 70–160 m excess at 30–100 Myr, and the general power-law decline in the excess flux for the oldest stars.
Despite this general success, however, the models underpredict the largest observed excesses. At 70 m, the brightest disks are a factor of 5–10 brighter than disks with = 3. At 160 m, the brightest systems are 3–5 times brighter than our most luminous disks. Although the sample of 160 m sources is small, our models underpredict the largest observed fluxes at all ages.
Changing two assumptions in our models yields a better match to the observed fluxes at 70–160 m. For realistic grain properties, Burns, Lamy, & Soter (1979) show that radiation pressure from the Sun cannot eject small grains from the Solar System. Reducing the minimum stable grain size from = 1 m to = 0.1 m increases our predicted 70 m (160 m) fluxes by a factor of 2–3 (1.5–2). Submm observations of several debris disks imply 0.6–1 for the slope of the radiative emissivity. If we adopt instead of , our predicted 70–160 m fluxes increase by factors of 2–4. Combining these two modifications increase our predicted fluxes by a factor of 5–10 at both wavelengths.
Several observations could check whether these modifications of our standard model are reasonable. By analogy with the Spitzer Vega data, detection of an outflowing wind of small grains in a debris disk around a solar-type star provides a clean measurement of and a better constraint on our predicted IR excesses. Measurements of for larger samples of debris disks allows a better assessment of our assumptions for the grain emissivity.
6 CONCLUSIONS
Our calculations provide a robust picture for the formation of planets and debris disks from a disk of icy planetesimals and set the context for the evolution of dusty debris in a dynamic system of planets. The results of this study provide a framework for interpreting existing observations of debris disks around 1–3 M⊙ stars and suggest new observational tests of this picture.
We describe a suite of numerical calculations of planets growing from ensembles of icy planetesimals at 30–150 AU in disks around 1–3 M⊙ stars. Using our hybrid multiannulus coagulation code, we solve for the evolution of sizes and orbits of objects with radii of 1 m to 1000 km over the main sequence lifetime of the central star. These results allow us to constrain the growth of planets as a function of disk mass, stellar mass, and semimajor axis.
Debris disk formation is coincident with the formation of a planetary system. All calculations of icy planet formation at 30–150 AU lead to a collisional cascade which produces copious amounts of dust on timescales of 5–30 Myr. This dust is observable throughout the lifetime of the central star. Because we consider a broad range of input parameters, we derive the time evolution of (i) dust produced in the collisional cascade and (ii) the IR and submm emission from this dust as a function of disk mass, stellar mass, and time.
We divide the rest of this section into (i) theoretical considerations, (ii) observable consequences, and (iii) observational tests. The theoretical considerations build on the highlights of icy planet formation in §3.4. Observable consequences of the calculations follow from the discussion in §4. The observational tests of the models are described in §5.
6.1 Theoretical Considerations
-
•
Icy planet formation at 30–150 AU is self-limiting. Starting with a swarm of 1 km planetesimals, runaway growth produces a set of 100–500 km protoplanets. As the protoplanets grow, they stir up leftover planetesimals along their orbits. When the leftovers reach high , collisions produce debris instead of mergers. Because protoplanets cannot accrete leftovers rapidly, a cascade of destructive collisions grinds the leftovers to dust. Poynting-Robertson drag and radiation pressure then remove the dust from the disk.
-
•
The maximum sizes of icy planets at 30–150 AU are remarkably independent of initial disk mass, stellar mass, and stellar age. For disks with = 1/3 to 3 around 1–3 M⊙ stars with ages , the typical planet has 1750 km and M⊕. These objects contain 3%–4% of the initial disk mass. Although this result is also independent of the fragmentation parameters, the finite main sequence lifetimes of 1–3 M⊙ stars limits the formation of many large planets in the outer disk. Thus, the inner disk produces many more Pluto-mass planets than the outer disk (Tables 2 and 3).
-
•
For stars close to the main sequence turnoff, stellar lifetimes and the collisional cascade limit the mass in solid objects at 30–150 AU. In the inner disk, the collisional cascade removes most of the leftover planetesimals before the central star evolves off the main sequence. Thus, the typical mass in small objects is 10% of the initial mass at 30–40 AU. In the outer disk, smaller collision rates produce a slower cascade. Thus, the central star evolves off the main sequence with 50% of the initial mass remaining in 1–10 km planetesimals at 125–150 AU.
-
•
The collisional cascade produces copious amounts of dust. Dust begins to form during the transition from runaway to oligarchic growth ( = 5–10 Myr), peaks when the first objects reach their maximum sizes ( = 10–30 Myr), and then slowly declines 30–50 Myr). The peak mass in 0.001–1 mm (0.001–1 m) particles is 1–2 lunar masses ( 1 M⊕). Disks with initial masses = 1/3 to 3 reach these peak masses when the age of the star is 10% to 20% of its main sequence lifetime. Because the timescale to form dust is short ( 10–20 Myr), stars are surrounded by large disks of debris at 30–150 AU throughout their main sequence lifetimes.
-
•
Radiative processes remove large amounts of mass from debris disks. Radiation pressure produces a radial wind of small particles containing 60% to 70% of the mass removed from the disk. Poynting-Robertson drag pulls the rest of the lost mass into the inner disk. Because radiation pressure is more important than Poynting-Robertson drag when collision rates are large, we expect more wind (inner disk) emission earlier (later) in the evolution.
6.2 Observable Consequences
We derive clear observational consequences of the collisional cascade.
-
•
The dusty debris from the collisional cascade is directly observable. For disks around 1–3 M⊙ stars, the maximum fractional dust luminosity of is comparable to the maximum dust luminosities of known debris disks (Backman & Paresce, 1993; Rieke et al., 2005; Su et al., 2006; Rhee et al., 2007a). The dust temperature at the inner edge of a 30–150 AU disk scales with the temperature of the central star; thus, the predicted 24 m excess is very sensitive to the stellar mass. At 70 m, the predicted excesses scale roughly linearly with disk mass and stellar mass. The predicted 160–850 m excesses depend on the disk mass but are nearly independent of the stellar mass.
-
•
For systems with little or no emission from terrestrial dust ([5.8]–[8] 0.1), mid-IR color-color diagrams clearly distinguish debris disks around stars of different masses. In a [8]–[24] vs [24]–[70] diagram, 2–3 M⊙ (1–2 M⊙) stars have red (blue) [8]–[24] and blue (red) [24]–[70] (Fig 20). In both cases, the color scales with the initial disk mass (Fig 21). Optical colors and spectra generally provide good estimates for stellar mass; thus, these diagrams provide good tests of our model predictions.
6.3 Observational Tests
We compare our predictions with observations of A-type stars and solar-type stars.
-
•
For A-type stars, our calculations are the first to explain the observed rise and fall of debris disk fluxes at 24 m (Fig. 22; Currie et al., 2008a, b). In our picture, the rise in debris disk emission corresponds to the transition from runaway growth – when mergers of small planetesimals produce larger protoplanets – to oligarchic growth – when the collisional cascade begins to grind leftover planetesimals into dust. When oligarchs in the inner disk are close to their maximum sizes of 1750 km, the collisional cascade produces a maximum in debris disk emission. For a wide range of initial conditions, this maximum occurs at 10–20 Myr. As the collisional cascade moves out through the disk, smaller collision rates produce less dust which emits at lower temperatures. Thus, the 24 m excess falls with time. The predicted rate of decline, with 0.6–0.8, is close to the observed rate ( 0.5–1; Greaves & Wyatt, 2003; Rieke et al., 2005; Rhee et al., 2007a).
-
•
At longer wavelengths, the maximum excess is larger and lasts longer than at 24 m. Predicted mid-IR colors also increase slowly with time. Although larger samples of A-type stars with 8 m photometry would provide a better test of our models, current data for the 70 m excess and the evolution of the [24]–[70] color agree with our predictions (Fig. 23–24). For 2–3 M⊙ stars near the main-sequence turnoff, our calculations also yield a clear maximum in the 850 m flux. Large surveys, such as the proposed JCMT Legacy Survey (Matthews et al., 2007) and submm observations with ALMA, Herschel and SOFIA, can test this prediction.
-
•
For solar-type stars, our models match observations of most sources. The predicted evolution of the 70–160 m excesses follows the observed rise at 10–100 Myr, the peak at 30–100 Myr, and the decline at 300 Myr. Although 70% (55%) of observed debris disks have fluxes that lie within model predictions, our models underpredict fluxes for the brightest sources by a factor of 5–10. Fluxes for models with 0.1 m and 0.7 provide better matches to these observations. To guide our choices for and , we require spatially resolved images and submm fluxes for these objects.
-
•
For 1–3 M⊙ stars with ages 0.1–1 Gyr, current data suggest that solar-type stars have a larger range of far-IR excesses than A-type stars. In our models, faster debris disk evolution around A-type stars produces a smaller dispersion in far-IR excesses and colors for stars with ages of 100 Myr to 1 Gyr. Larger samples of debris disks can test this prediction in more detail.
-
•
We also consider observations of Vega, the prototypical debris disk. If we adopt models with a blowout radius = 10 m, we can match observations with a standard collisional cascade within a broad torus at 80–200 AU. If the torus contains 1–5 M⊕ in large objects with 1 cm, the cascade can generate (i) the observed ensemble of grains with 200–300 m within the torus and (ii) an outflowing wind of small grains with 1–50 m.
This conclusion differs from Su et al. (2006), who postulate a recent catastrophic collision between two large objects as the source of the dusty Vega wind. Although the complete destruction of two large icy objects can produce a massive outflowing wind, our results suggest that the dusty wind is short-lived and cannot be rapidly replenished by the observed population of larger objects. We show that a steady-state collisional cascade can explain the Spitzer data (see also Kenyon & Bromley, 2005). If our interpretation is correct, sensitive observations at 1–10 mm should detect our proposed reservoir of larger objects.
Matching other observations of debris disks requires more realism in our planet formation calculations. Adding binary companions and giant planets provides ways to modify the evolution of the collisional cascade and to impose structure on rings and tori (e.g. Wilner et al., 2002; Moro-Martín & Malhotra, 2005; Quillen, 2006). Extending the coagulation calculations to smaller sizes allows studies of the formation of winds and other large structures. Although these calculations have been prohibitively expensive in computing time, rapid advances in computing technology will make these additions possible in the next few years.
Based on the results described here and in Kenyon & Bromley (2004b), we conclude that debris disks are the inevitable outcome of icy planet formation in a disk of solid objects. The basic structures produced by this model – broad tori and narrow rings of dust that propagate out through the disk (Kenyon & Bromley, 2004b) – are consistent with observations (e.g. Jayawardhana et al., 1998; Kalas, 2005; Su et al., 2006; Fitzgerald et al., 2007). The model also explains the time evolution of mid-IR colors and fluxes for debris disks around A-type and solar-type stars.
Appendix A APPENDIX
A.1 Growth rates
In standard coagulation theory, protoplanets accrete material from a swarm of planetesimals at a rate (e.g., Safronov, 1969; Lissauer, 1987; Wetherill & Stewart, 1993)
| (A1) |
where is the radius of a planetesimal, is the angular frequency of material in the disk, is the random velocity of planetesimals, and is the escape velocity of the protoplanet. The term is the gravitational focusing factor.
To derive the accretion time, we set and substitute the orbital period for the angular frequency,
| (A2) |
where is the mass density of a planetesimal. Throughout runaway growth and the early stages of oligarchic growth . Because we are interested in the time to produce planets with the same and in disks with different and , we eliminate and . Thus, the growth time is roughly
| (A3) |
This equation sets the typical timescale for planet growth in a disk of planetesimals. If (Eq. (27)) and constant (Fig. 1; Wetherill & Stewart, 1993; Goldreich, Lithwick, & Sari, 2004),
| (A4) |
This result is close to the derived for the formation of the first 1000 km object in our calculations (e.g., Eq. (41)).
To evaluate possible sources for the extra factor of in our derived accretion times, we consider the random velocity of accreted planetesimals. Shorter growth times require smaller random velocities. Thus, we consider processes that damp planetesimal velocities. In our calculations, collisions and gas drag can reduce ; dynamical friction and viscous stirring increase . At 30–150 AU, gas drag damps random velocities 10–20 times more rapidly than collisions (Goldreich, Lithwick, & Sari, 2004). Thus, we ignore collisional damping and concentrate on gas drag.
Rafikov (2004) investigated the dynamics of small planetesimals and growing protoplanets in a gaseous nebula. For the early stages of oligarchic growth, the random velocity of planetesimals is
| (A5) |
Substituting this expression into Eq. (A4) and adopting a constant gas-to-dust ratio, , we derive
| (A6) |
with . For typical conditions in planetesimal disks, Rafikov (2004) derived 1/6 to 1/5. Thus, to , close to the exponent of derived in our calculations.
Our treatment of gas drag probably reduces the exponent of in Eq. (A6) from the predicted – to . In our simulations, we assume the gas density declines exponentially on a timescale = 10 Myr. With typical growth times of 20–40 Myr, the gas density is 1% to 10% of its initial value when the first 1000 km objects form in the inner disk. Thus, gas drag cannot reduce planetesimal random velocities as efficiently as predicted in Eq. A6. Reducing drag lowers the exponent. With gas depletion timescales 25% to 50% of the growth time, we expect an exponent of to , similar to the in our calculations.
A.2 Radiation from dust
In the Appendix of Kenyon & Bromley (2004a), we briefly described our simple algorithm for the evolution of particles with sizes smaller than the smallest object – 1 m – followed in the multiannulus coagulation code. This algorithm yields the optical depth in very small grains ejected from the system and the optical depth in larger grains evolving under the influence of collisions and Poynting-Robertson drag. The optical depth in both grain populations allows us to derive the time evolution of the disk luminosity and surface brightness in bolometric units. Here, we describe the derivation of grain temperature for these populations that yields the predicted time evolution of the broadband spectral energy distributions of debris disks.
As in Kenyon & Bromley (2004a), we divide objects with sizes smaller than 1 m into very small grains, small grains, and large grains. In each annulus of our calculation, radiation pressure ejects very small grains with radii between and . If is the mass density of these grains and is the production rate of very small grains in each annulus, the very small grains have an integrated optical depth
| (A7) |
where is the inner boundary of an annulus centered at , is the vertical scale height in units of the semimajor axis, and is the orbital velocity in annulus .
For small ( = to 1 mm) and large grains ( = 1 mm to 1 m), we derive the optical depth in each annulus. To derive the radial surface brightness and total disk luminosity, we follow Kenyon & Hartmann (1987) and derive the amount of stellar radiation absorbed by each annulus. We assume a spherical, limb-darkened star with radius , luminosity , and limb-darkening parameter = 0.6. For a point at the outer boundary of annulus with height above the disk midplane, rays from the star enter the annulus at a scale height above (below) the midplane. We compute the length of the path through the disk and derive the optical depth along this path as = (), where is the width of the annulus. The radiation absorbed along this path is , where is the flux incident on the boundary of the annulus. Numerical integrations over the stellar surface and the vertical extent of an annulus yield the amount of flux absorbed by each annulus, which we convert to relative surface brightness. A final numerical integration over the radial extent of the disk yields the ratio of the disk luminosity to the stellar luminosity, .
To derive the spectral energy distribution of the disk, we make several assumptions. Consistent with observations of scattered light from resolved debris disks (Backman & Paresce, 1993; Lagrange et al., 2000), we adopt a single albedo = 0.25 for all grains. For all , the luminosity in scattered light is then ; the thermal luminosity emitted by all grains is . In each annulus , we assume grains emit at a temperature , where the index refers to discrete bins in grain size. To derive equilibrium temperatures for these grains, we assume the grains have an absorption efficiency and radiative efficiency . For most grains in our calculations, the grain size is larger than the peak wavelength of radiation emitted by the central star. Thus, the grains efficiently absorb stellar photons and = 0. Large grains with emit as blackbodies and have = 0. Smaller grains radiate less efficiently and have 1.
References
- Absil et al. (2006) Absil, O., et al. 2006, A&A, 452, 237
- Adachi et al. (1976) Adachi, I., Hayashi, C., & Nakazawa, K. 1976, Progress of Theoretical Physics 56, 1756
- Allen (1976) Allen, C. W. 1976, Astrophysical Quantities, Athlone, London, p. 197
- Andrews & Williams (2005) Andrews, S. M., & Williams, J. P. 2005, ApJ, 631, 1134
- Andrews & Williams (2007a) Andrews, S. M., & Williams, J. P. 2007a, ApJ, 659, 705
- Andrews & Williams (2007b) Andrews, S. M., & Williams, J. P. 2007b, ApJ, 671, 1800
- Artymowicz (1988) Artymowicz, P. 1988, ApJ, 335, L79
- Artymowicz (1997) Artymowicz, P. 1997, ARE&PS, 25, 175
- Asphaug & Benz (1996) Asphaug, E., & Benz, W. 1996, Icarus, 121, 225
- Aufdenberg et al. (2006) Aufdenberg, J. P., et al. 2006, ApJ, 645, 664
- Augereau & Beust (2006) Augereau, J.-C., & Beust, H. 2006, A&A, 455, 987
- Augereau et al. (1999) Augereau, J. C., Lagrange, A.-M., Mouillet, D., Papaloizou, J. C. B., & Grorod, P. A. 1999, A&A, 348, 557
- Aumann et al. (1984) Aumann, H. H., et al. 1984, ApJ, 278, L23
- Backman & Paresce (1993) Backman, D. E., & Paresce, F. 1993, in Protostars and Planets III, eds. E. H. Levy & J. I. Lunine, Tucson, Univ of Arizona, p. 1253
- Barge & Pellat (1991) Barge, P., & Pellat, R. 1991, Icarus, 93, 270
- Beichman et al. (2005) Beichman, C. A., et al. 2005, ApJ, 626, 1061
- Beichman et al. (2006) Beichman, C. A., et al. 2006, ApJ, 652, 1674
- Benz & Asphaug (1999) Benz, W., & Asphaug, E. 1999, Icarus, 142, 5
- Brandeker et al. (2004) Brandeker, A., Liseau, R., Olofsson, G., & Fridlund, M. 2004, A&A, 413, 681
- Bromley & Kenyon (2006) Bromley, B., & Kenyon, S. J. 2006, AJ, 131, 2737
- Brownlee et al. (1997) Brownlee, D. E., et al. 1997, Meteoritics & Planetary Science, vol. 32, page A22, 32, 22
- Bryden et al. (2006) Bryden, G., et al. 2006, ApJ, 636, 1098
- Burns, Lamy, & Soter (1979) Burns, J. A., Lamy, P. L., & Soter, S. 1979, Icarus, 40, 1
- Campo Bagatin et al. (1994) Campo Bagatin, A., Cellino, A., Davis, D. R., Farinella, P., & Paolicchi, P. 1994
- Carpenter et al. (2006) Carpenter, J. M., Mamajek, E. E., Hillenbrand, L. A., & Meyer, M. R. 2006, ApJ, 651, L49
- Chambers (2001) Chambers, J. E. 2001, Icarus, 152, 205
- Chambers (2006) Chambers, J. 2006, Icarus, 180, 496
- Charnoz & Morbidelli (2003) Charnoz, S., & Morbidelli, A. 2003, Icarus, 166, 141
- Chen et al. (2005) Chen, C. H., et al. 2005, ApJ, 634, 1372
- Chen et al. (2006) Chen, C. H., et al. 2006, ApJS, 166, 351
- Ciesla (2007) Ciesla, F. J. 2007, ApJ, 654, L159
- Currie et al. (2007a) Currie, T., et al. 2007, ApJ, 659, 599
- Currie et al. (2007b) Currie, T., Kenyon, S. J., Rieke, G., Balog, Z., & Bromley, B. C. 2007, ApJ, 663, L105
- Currie et al. (2007c) Currie, T., Kenyon, S. J., Balog, Z., Bragg, A., & Tokarz, S. 2007, ApJ, 669, L33
- Currie et al. (2008a) Currie, T., Kenyon, S. J., Balog, Z., Rieke, G., Bragg, A., & Bromley, B. 2008, ApJ, 672, 558
- Currie et al. (2008b) Currie, T., Plavchan, P., & Kenyon, S. J. 2008b, ApJ, submitted
- Davis et al. (1985) Davis, D. R., Chapman, C. R., Weidenschilling, S. J., & Greenberg, R. 1985, Icarus, 62, 30
- Decin et al. (2003) Decin, G., Dominik, C., Waters, L. B. F. M., & Waelkens, C. 2003, ApJ, 598, 636
- Demarque et al. (2004) Demarque, P., Woo, J.-H., Kim, Y.-C., & Yi, S. K. 2004, ApJS, 155, 667
- Dent et al. (2000) Dent, W. R. F., Walker, H. J., Holland, W. S., & Greaves, J. S. 2000, MNRAS, 314, 702
- Dohnanyi (1969) Dohnanyi, J. W. 1969, J. Geophys. Res., 74, 2531
- Dominik & Decin (2003) Dominik, C., & Decin, G. 2003, ApJ, 598, 626
- Dullemond & Dominik (2005) Dullemond, C. P., & Dominik, C. 2005, A&A, 434, 971
- Durda & Dermott (1997) Durda, D. D., & Dermott, S. F. 1997, Icarus, 130, 140
- Elliot et al. (2003) Elliot, J. L., Person, M. J., & Qu, S. 2003, AJ, 126, 1041
- Elliot et al. (2007) Elliot, J. L., et al. 2007, AJ, 134, 1
- Fitzgerald et al. (2007) Fitzgerald, M. P., Kalas, P. G., & Graham, J. R. 2007, ApJ, 670, 557
- Garaud (2007) Garaud, P. 2007, ApJ, 671, 2091
- Goldreich, Lithwick, & Sari (2004) Goldreich, P., Lithwick, Y., & Sari, R. 2004, ARA&A, 42, 549
- Golimowski et al. (1993) Golimowski, D. A., Durrance, S. T., & Clampin, M. 1993, ApJ, 411, L41
- Gomes et al. (2005) Gomes, R., Levison, H. F., Tsiganis, K., & Morbidelli, A. 2005, Nature, 435, 466
- Gorlova et al. (2007) Gorlova, N., Balog, Z., Rieke, G. H., Muzerolle, J., Su, K. Y. L., Ivanov, V. D., & Young, E. T. 2007, ApJ, 670, 516
- Gorlova et al. (2006) Gorlova, N., Rieke, G. H., Muzerolle, J., Stauffer, J. R., Siegler, N., Young, E. T., & Stansberry, J. H. 2006, ApJ, 649, 1028
- Greaves et al. (1998) Greaves, J. S. et al. 1998, ApJ, 506, L133
- Greaves et al. (2000) Greaves J. S., Mannings V. & Holland, W. S. 2000b, Icarus, 143, 155
- Greaves & Wyatt (2003) Greaves, J. S., & Wyatt, M. C. 2003, MNRAS, 345, 1212
- Greenberg et al. (1984) Greenberg, R., Weidenschilling, S. J., Chapman, C. R., & Davis, D. R. 1984, Icarus, 59, 87
- Greenberg et al. (1991) Greenberg, R., Bottke, W., Carusi, A., Valsecchi, G. B. 1991, Icarus, 94, 98
- Greenzweig & Lissauer (1990) Greenzweig, Y., & Lissauer, J. J. 1990, Icarus, 87, 40
- Greenzweig & Lissauer (1992) Greenzweig, Y., & Lissauer, J. J. 1992, Icarus, 100, 440
- Grigorieva et al. (2007) Grigorieva, A., Artymowicz, P., & Thébault, P. 2007, A&A, 461, 537
- Grün et al. (1995) Grün, E., et al. 1995, Planet. Space Sci., 43, 971
- Habing et al. (2001) Habing, H. J., et al. 2001, A&A, 365, 545
- Hahn et al. (2002) Hahn, J. M., Zook, H. A., Cooper, B., & Sunkara, B. 2002, Icarus, 158, 360
- Haisch, Lada, & Lada (2001) Haisch, K., Lada, E. A., & Lada, C. J. 2001, ApJ, 553, 153
- Hayashi (1981) Hayashi, C. 1981, Prog Theor Phys Suppl, 70, 35
- Hernández et al. (2006) Hernández, J., Briceño, C., Calvet, N., Hartmann, L., Muzerolle, J., & Quintero, A. 2006, ApJ, 652, 472
- Hillenbrand et al. (2008) Hillenbrand, L. A., et al. 2008, ArXiv e-prints, 801, arXiv:0801.0163
- Holland et al. (1998) Holland, W. S., et al. 1998, Nature, 392, 788
- Holland et al. (2003) Holland, W. S., et al. 2003, ApJ, 582, 1141
- Hornung et al. (1985) Hornung, P., Pellat, R., & Barge, P. 1985, Icarus, 64, 295
- Iben (1967) Iben, I. Jr, 1967, ARA&A, 5, 571
- Ida (1990) Ida, S. 1990, Icarus, 88, 129
- Ida & Lin (2008) Ida, S., & Lin, D. N. C. 2008, ArXiv e-prints, 802, arXiv:0802.1114
- Ida & Makino (1992) Ida, S., & Makino, J. 1992, Icarus, 96, 107
- Ida & Makino (1993) Ida, S., & Makino, J. 1993, Icarus, 106, 210
- Inaba et al. (2001) Inaba, S. H., Tanaka, H., Nakazawa, K., Wetherill, G. W., & Kokubo, E. 2001, Icarus, 149, 235
- Jayawardhana et al. (1998) Jayawardhana, R. et al. 1998, ApJ, 503, L79
- Johnson et al. (2007) Johnson, J. A., et al. 2007, ApJ, 665, 785
- Kalas (1998) Kalas, P. 1998, Earth, Moon, & Planets, 81, 27
- Kalas (2005) Kalas, P. 2005, ApJ, 635, L169
- Kalas et al. (2005) Kalas, P., Graham, J. R., & Clampin, M. 2005, Nature, 435, 1067
- Kalas et al. (2006) Kalas, P., Graham, J. R., Clampin, M. C., & Fitzgerald, M. P. 2006, ApJ, 637, L57
- Kalas et al. (2004) Kalas, P., Liu, M. C., & Matthews, B. C. 2004, Science, 303, 1990
- Kennedy & Kenyon (2008) Kennedy, G. M., & Kenyon, S. J. 2008, ApJ, 673, 502
- Kenyon & Bromley (2001) Kenyon, S. J., & Bromley, B. C. 2001, AJ, 121, 538
- Kenyon & Bromley (2002a) Kenyon, S. J., & Bromley, B. C. 2002a, AJ, 123, 1757
- Kenyon & Bromley (2002b) Kenyon, S. J., & Bromley, B. C. 2002b, ApJ, 577, L35
- Kenyon & Bromley (2004a) Kenyon, S. J., & Bromley, B. C., 2004a, AJ, 127, 513
- Kenyon & Bromley (2004b) Kenyon, S. J., & Bromley, B. C., 2004b, ApJ, 602, L133
- Kenyon & Bromley (2004c) Kenyon, S. J., & Bromley, B. C., 2004c, AJ, 128, 1916
- Kenyon & Bromley (2005) Kenyon, S. J., & Bromley, B. C. 2005, AJ, 130, 269
- Kenyon & Bromley (2006) Kenyon, S. J., & Bromley, B. C. 2006, AJ, 131, 1837
- Kenyon et al. (2008) Kenyon, S. J., Bromley, B. C., O’Brien, D. C., & Davis, D. R. 2008, to appear in The Solar System Beyond Neptune, edited by A. Barucci, H. Boehnhardt, D. Cruikshank, & A. Morbidelli, Tucson, Univ. of Arizona Press, in press
- Kenyon & Hartmann (1987) Kenyon, S. J., & Hartmann, L. 1987, ApJ, 323, 714
- Kenyon & Hartmann (1995) Kenyon, S. J., & Hartmann, L. W., 1995, ApJS, 101, 117
- Kenyon & Luu (1998) Kenyon, S. J., & Luu, J. X. 1998, AJ, 115, 2136
- Kenyon & Luu (1999) Kenyon, S. J., & Luu, J. X. 1999, AJ, 118, 1101
- Kenyon et al. (1999) Kenyon, S. J., Wood, K., Whitney, B. A., & Wolff, M. 1999, ApJ, 524, L119
- Kim et al. (2005) Kim, J. S., et al. 2005, ApJ, 632, 659
- Kimura et al. (2002) Kimura, H., Okamoto, H., & Mukai, T. 2002, Icarus, 157, 349
- Knapp & Morris (1985) Knapp, G. R., & Morris, M. 1985, ApJ, 292, 640
- Kobayashi & Ida (2001) Kobayashi, H., & Ida, S. 2001, Icarus, 153, 416
- Koeberl (2003) Koeberl, C. 2003, EM&P, 92, 79
- Koerner et al. (1998) Koerner, D. W., Ressler, M. E., Werner, M. W., & Backman, D. E. 1998, ApJ, 503, L83
- Koerner, Sargent, & Ostroff (2001) Koerner, D. W., Sargent, A. I., & Ostroff, N. A. 2001, ApJ, 560, L181
- Kokubo & Ida (1998) Kokubo, E., & Ida, S. 1998, Icarus, 131, 171
- Kretke et al. (2008) Kretke, K. A., Lin, D. N. C., Garaud, P., & Turner, N. J. 2008, ArXiv e-prints, 806, arXiv:0806.1521
- Krivov et al. (2000) Krivov, A. V., Mann, I., & Krivova, N. A. 2000, A&A, 362, 1127
- Krivov et al. (2006) Krivov, A. V., Löhne, T., & Sremčević, M. 2006, A&A, 455, 509
- Kuchner & Holman (2003) Kuchner, M. J., & Holman, M. J. 2003, ApJ, 588, 1110
- Lada (1999) Lada, C. J. 1999, in The Physics of Star Formation and Early Stellar Evolution, edited by C. J. Lada and N. Kylafis, Dordrecht, Kluwer, p. 143
- Lagrange et al. (2000) Lagrange, A.-M., Backman, D., & Artymowicz, P. 2000, in Protostars & Planets IV, eds. V. Mannings, A. P. Boss, & S. S. Russell, Tucson, Univ. of Arizona, in press
- Landgraf et al. (2002) Landgraf, M., Liou, J.-C., Zook, H. A., & Grün, E. 2002, AJ, 123, 2857
- Larwood (1997) Larwood, J. D. 1997, MNRAS, 290, 490
- Larwood & Kalas (2001) Larwood, J. D., & Kalas, P. G. 2001, MNRAS, 323, 402
- Leinhardt et al. (2008) Leinhardt, Z. M., Stewart, S. T., & Schultz, P. H. 2008, to appear in The Solar System Beyond Neptune, edited by A. Barucci, H. Boehnhardt, D. Cruikshank, & A. Morbidelli, Tucson, Univ. of Arizona Press, in press (ArXiv e-prints, 705, arXiv:0705.3943)
- Levison & Stewart (2001) Levison, H. F., & Stewart, G. R. 2001, Icarus, 153, 224
- Lin & Papaloizou (1979) Lin, D. N. C., & Papaloizou, J. C. B. 1979, MNRAS, 186, 799
- Lissauer (1987) Lissauer, J. J. 1987, Icarus, 69, 249
- Lissauer & Stewart (1993) Lissauer, J. J., & Stewart, G. R. 1993, In Protostars and Planets III, edited by E. H. Levy and J. I. Lunine, U. of Arizona Press, Tucson, 1061
- Lisse et al. (2007a) Lisse, C. M., Beichman, C. A., Bryden, G., & Wyatt, M. C. 2007, ApJ, 658, 584
- Lisse et al. (2007c) Lisse, C. M., Chen, C. H., Wyatt, M. C., & Morlok, A. 2007, ArXiv e-prints, 710, arXiv:0710.0839
- Lisse et al. (2007b) Lisse, C. M., Kraemer, K. E., Nuth, J. A., Li, A., & Joswiak, D. 2007, Icarus, 191, 223
- Liu (2004) Liu, M. C. 2004, Science, 305, 1442
- Liu et al. (2004) Liu, M. C., Matthews, B. C., Williams, J. P., & Kalas, P. G. 2004, ApJ, 608, 526
- Liu et al. (2004) Liu, W. M., et al. 2004, ApJ, 610, L125
- Löhne et al. (2008) Löhne, T., Krivov, A. V., & Rodmann, J. 2008, ApJ, 673, 1123
- Marsh et al. (2006) Marsh, K. A., Dowell, C. D., Velusamy, T., Grogan, K., & Beichman, C. A. 2006, ApJ, 646, L77
- Matthews et al. (2007) Matthews, B. C., et al. 2007, PASP, 119, 842
- Melosh, Vickery, & Tonks (1993) Melosh, H. J., Vockery, A. M., & Tonks, W. B. 1993, in Protostars and Planets III, eds. E. H. Levy & J. I. Lunine, Tucson, Univ of Arizona, p. 1339
- Meyer et al. (2007) Meyer, M. R., Backman, D. E., Weinberger, A. J., & Wyatt, M. C. 2007, Protostars and Planets V, 573
- Meyer et al. (2006) Meyer, M. R., et al. 2006, PASP, 118, 1690
- Meyer et al. (2008) Meyer, M. R., et al. 2008, ApJ, 673, L181
- Moór et al. (2006) Moór, A., Ábrahám, P., Derekas, A., Kiss, C., Kiss, L. L., Apai, D., Grady, C., & Henning, T. 2006, ApJ, 644, 525
- Moro-Martín & Malhotra (2005) Moro-Martín, A., & Malhotra, R. 2005, ApJ, 633, 1150
- Moro-Martin et al. (2007) Moro-Martin, A., Wyatt, M. C., Malhotra, R., & Trilling, D. E. 2007, ArXiv Astrophysics e-prints, arXiv:astro-ph/0703383
- Motte & André (2001) Motte, F., & André, P. 2001, A&A, 365, 440
- Mouillet et al. (1997) Mouillet, D., Larwood, J. D., Papaloizou, J. C. B., & Lagrange, A.-M. 1997, MNRAS, 292, 896
- Nagasawa et al. (2007) Nagasawa, M., Thommes, E. W., Kenyon, S. J., Bromley, B. C., & Lin, D. N. C. 2007, Protostars and Planets V, 639
- Najita & Williams (2005) Najita, J., & Williams, J. P. 2005, ApJ, 635, 625
- Natta et al. (2000) Natta, A., Grinin, V., & Mannings, V. 2000, Protostars and Planets IV, 559
- Nesvorný et al. (2006) Nesvorný, D., Vokrouhlický, D., Bottke, W. F., & Sykes, M. 2006, Icarus, 181, 107
- Nomura & Nakagawa (2006) Nomura, H., & Nakagawa, Y. 2006, ApJ, 640, 1099
- Ohtsuki (1992) Ohtsuki, K. 1992, Icarus, 98, 20
- Ohtsuki, Stewart, & Ida (2002) Ohtsuki, K., Stewart, G. R., & Ida, S. 2002, Icarus, 155, 436
- Osterloh & Beckwith (1995) Osterloh, M., & Beckwith, S. V. W. 1995, ApJ, 439, 288
- Pan & Sari (2005) Pan, M., & Sari, R. 2005, Icarus, 173, 342
- Press et al. (1992) Press, W. H., Flannery, B. P., Teukolsky, S. A., & Vetterling, W. T. 1992, Numerical Recipes, The Art of Scientific Computing, Cambridge, Cambridge
- Quillen (2006) Quillen, A. C. 2006, MNRAS, 372, L14
- Quillen et al. (2007) Quillen, A. C., Morbidelli, A., & Moore, A. 2007, MNRAS, 380, 1642
- Rafikov (2003) Rafikov, R. R. 2003, AJ, 125, 942
- Rafikov (2004) Rafikov, R. R. 2004, AJ, 128, 1348
- Rhee et al. (2007a) Rhee, J. H., Song, I., Zuckerman, B., & McElwain, M. 2007, ApJ, 660, 1556
- Rhee et al. (2007b) Rhee, J. H., Song, I., & Zuckerman, B. 2007, ArXiv e-prints, 711, arXiv:0711.2111
- Rieke et al. (2005) Rieke, G. H., Su, K. Y. L., Stansberry, J. A., Trilling, D., Bryden, G., Muzerolle, J., White, B., Gorlova, N., Young, E. T., Beichman, C. A., Stapelfeldt, K. R., & hines, D. C. 2005, ApJ, 620, 1010
- Safronov (1969) Safronov, V. S. 1969, Evolution of the Protoplanetary Cloud and Formation of the Earth and Planets, Nauka, Moscow [Translation 1972, NASA TT F-677]
- Schneider et al. (1999) Schneider, G., et al. 1999, ApJ, 513, L127
- Scholz et al. (2006) Scholz, A., Jayawardhana, R., & Wood, K. 2006, ApJ, 645, 1498
- Sicilia-Aguilar et al. (2006) Sicilia-Aguilar, A., et al. 2006, ApJ, 638, 897
- Siegler et al. (2007) Siegler, N., Muzerolle, J., Young, E. T., Rieke, G. H., Mamajek, E. E., Trilling, D. E., Gorlova, N., & Su, K. Y. L. 2007, ApJ, 654, 580
- Smith & Terrile (1984) Smith, B. A., & Terrile, R. J. 1984, Science, 226, 1421
- Song et al. (2005) Song, I., Zuckerman, B., Weinberger, A. J., & Becklin, E. E. 2005, Nature, 436, 363
- Spaute et al. (1991) Spaute, D., Weidenschilling, S. J., Davis, D. R., & Marzari, F. 1991, Icarus, 92, 147
- Stapelfeldt et al. (2004) Stapelfeldt, K. R., et al. 2004, ApJS, 154, 458
- Stauffer et al. (2005) Stauffer, J. R., et al. 2005, AJ, 130, 1834
- Stern & Colwell (1997) Stern, S. A., & Colwell, J. E. 1997a, AJ, 114, 841
- Stewart & Ida (2000) Stewart, G. R., & Ida, S. 2000, Icarus, 143, 28
- Su et al. (2005) Su, K. Y. L., et al. 2005, ApJ, 628, 487
- Su et al. (2006) Su, K. Y. L., et al. 2006, ApJ, 653, 675
- Su et al. (2008) Su, K. Y. L., Rieke, G. H., Stapelfeldt, K. R., Smith, P. S., Bryden, G., Chen, C. H., & Trilling, D. E. 2008, ApJ, 679, L125
- Swindle (1993) Swindle, T. D. 1993, in Protostars and Planets III, eds. E. H. Levy & J. I. Lunine, Tucson, Univ of Arizona, p. 867
- Takeuchi & Artymowicz (2001) Takeuchi, T., & Artymowicz, P. 2001, ApJ, 557, 990
- Telesco et al. (1988) Telesco, C. M., Decher, R., Becklin, E. E., & Wolstencroft, R. D. 1988, Nature, 335, 51
- Telesco et al. (2000) Telesco, C. M., et al. 2000, ApJ, 530, 329
- Thébault & Augereau (2007) Thébault, P., & Augereau, J.-C. 2007, A&A, 472, 169
- Thébault, Augereau, & Beust (2003) Thébault, P., Augereau, J. C., & Beust, H. 2003, A&A, 408, 775
- Trilling et al. (2007) Trilling, D. E., et al. 2007, ApJ, 658, 1289
- Trilling et al. (2008) Trilling, D. E., et al. 2008, ApJ, 674, 1086
- Wadhwa & Russell (2000) Wadhwa, M., & Russell, S. S. 2000, in Protostars abd Planets IV, eds. V. Mannings, A. P. Boss, & S. S. Russell, Tucson, Univ. of Arizona, p. 995
- Weidenschilling (1977a) Weidenschilling, S. J. 1977a, Astrophys Sp Sci, 51, 153
- Weidenschilling (1977b) Weidenschilling, S. J. 1977b, MNRAS, 180, 57
- Weidenschilling (1989) Weidenschilling, S. J. 1989, Icarus, 80, 179
- Weidenschilling et al. (1997) Weidenschilling, S. J., Spaute, D., Davis, D. R., Marzari, F., & Ohtsuki, K. 1997, Icarus, 128, 429
- Wetherill (1980) Wetherill, G. W. 1980, ARA&A, 18, 77
- Wetherill & Stewart (1993) Wetherill, G. W., & Stewart, G. R. 1993, Icarus, 106, 190
- Williams & Wetherill (1994) Williams, D. R., & Wetherill, G. W. 1994, Icarus, 107, 117
- Williams & Andrews (2006) Williams, J. P., & Andrews, S. M. 2006, ApJ, 653, 1480
- Wilner et al. (2002) Wilner, D. J., Holman, M. J., Kuchner, M. J., & Ho, P. T. P. 2002, ApJ, 569, 115
- Wolf & Hillenbrand (2003) Wolf, S., & Hillenbrand, L. A. 2003, ApJ, 596, 603
- Wood et al. (2002) Wood, K., Lada, C. J., Bjorkman, J. E., Kenyon, S. J., Whitney, B., Wolff, M. J. 2002, ApJ, 567, 1183
- Wyatt (2003) Wyatt, M. C. 2003, ApJ, 598, 1321
- Wyatt (2005) Wyatt, M. C. 2005, A&A, 433, 1007
- Wyatt & Dent (2002) Wyatt, M. C., & Dent, W. R. F. 2002, MNRAS, 334, 589
- Wyatt, Dent, & Greaves (2003) Wyatt, M. C., Dent, W. R. F., & Greaves, J. S. 2003, MNRAS, 342, 867
- Wyatt et al. (1999) Wyatt, M. C., Dermott, S. F., Telesco, C. M., Fisher, R. S., Grogan, K., Holmes, E. K., & Piña, R. K. 1999, ApJ, 527, 918
- Wyatt et al. (2007a) Wyatt, M. C., Smith, R., Greaves, J. S., Beichman, C. A., Bryden, G., & Lisse, C. M. 2007, ApJ, 658, 569
- Wyatt et al. (2007b) Wyatt, M. C., Smith, R., Su, K. Y. L., Rieke, G. H., Greaves, J. S., Beichman, C. A., & Bryden, G. 2007, ApJ, 663, 365
- Yin et al. (2002) Yin, Q., Jacobsen, S. B., Yamashita, K., Blichert-Toft, J., Télouk, P.; Albarède, F. 2002, Nature, 418, 949
- Young & Binzel (1994) Young, E. F., & Binzel, R. P. 1994, Icarus, 108, 219
- Zuckerman (2001) Zuckerman, B. 2001, ARA&A, 39, 549
| Stellar Mass in | ||||||
|---|---|---|---|---|---|---|
| 1.0bb32 annulus models at 30–70 AU and at 70–150 AU | 1.0cc64 annulus models at 30–150 AU | 1.5 | 2.0 | 2.5 | 3.0 | |
| 0.33 | 41 | 19 | 15 | 20 | 18 | 18 |
| 0.50 | 49 | 18 | 18 | 17 | 17 | 17 |
| 1.00 | 49 | 15 | 22 | 17 | 15 | 15 |
| 2.00 | 41 | 15 | 30 | 17 | 16 | 15 |
| 3.00 | 45 | 18 | 12 | 22 | 15 | 21 |
| ddMain sequence lifetime in Gyr Demarque et al. (2004) | 10.00 | 10.00 | 2.90 | 1.22 | 0.65 | 0.39 |
| 30–37 AU | 37–45 AU | 45–55 AU | 55–67 AU | 67–82 AU | 82–100 AU | 100–123 AU | 123–146 AU | |
|---|---|---|---|---|---|---|---|---|
| 0.33 | 40 | 44 | 33 | 32 | 19 | 12 | 3 | 1 |
| 0.50 | 62 | 65 | 39 | 49 | 33 | 25 | 10 | 1 |
| 1.00 | 111 | 110 | 73 | 73 | 47 | 55 | 26 | 5 |
| 2.00 | 172 | 194 | 134 | 155 | 116 | 84 | 58 | 33 |
| 3.00 | 165 | 260 | 172 | 251 | 137 | 109 | 85 | 44 |
| 30–37 AU | 37–45 AU | 45–55 AU | 55–67 AU | 67–82 AU | 82–100 AU | 100–123 AU | 123–146 AU | |
|---|---|---|---|---|---|---|---|---|
| 1.5 M⊙ | ||||||||
| 0.33 | 46 | 46 | 45 | 28 | 16 | 3 | 1 | 1 |
| 0.50 | 69 | 85 | 68 | 48 | 53 | 25 | 2 | 1 |
| 1.00 | 102 | 136 | 128 | 101 | 98 | 67 | 28 | 2 |
| 2.00 | 158 | 243 | 240 | 261 | 211 | 123 | 169 | 47 |
| 3.00 | 201 | 239 | 301 | 295 | 381 | 165 | 198 | 97 |
| 2.0 M⊙ | ||||||||
| 0.33 | 55 | 51 | 48 | 30 | 2 | 1 | 1 | 3 |
| 0.50 | 115 | 87 | 85 | 51 | 20 | 10 | 1 | 2 |
| 1.00 | 172 | 187 | 231 | 123 | 82 | 50 | 1 | 3 |
| 2.00 | 261 | 230 | 366 | 236 | 324 | 204 | 77 | 5 |
| 3.00 | 259 | 262 | 398 | 264 | 446 | 295 | 171 | 48 |
| 2.5 M⊙ | ||||||||
| 0.33 | 105 | 92 | 63 | 55 | 19 | 1 | 5 | 2 |
| 0.50 | 152 | 139 | 123 | 100 | 53 | 10 | 5 | 5 |
| 1.00 | 164 | 174 | 234 | 198 | 125 | 90 | 7 | 6 |
| 2.00 | 223 | 230 | 278 | 243 | 158 | 108 | 10 | 8 |
| 3.00 | 353 | 434 | 490 | 495 | 477 | 615 | 313 | 157 |
| 3.0 M⊙ | ||||||||
| 0.33 | 133 | 121 | 62 | 36 | 6 | 5 | 1 | 1 |
| 0.50 | 127 | 153 | 129 | 103 | 50 | 2 | 2 | 1 |
| 1.00 | 199 | 230 | 239 | 258 | 171 | 66 | 6 | 5 |
| 2.00 | 224 | 353 | 376 | 392 | 342 | 265 | 173 | 5 |
| 3.00 | 428 | 598 | 479 | 657 | 570 | 756 | 578 | 272 |
| log (yr) | log | log | log | log | log |
|---|---|---|---|---|---|
| = 0.33 | |||||
| 5.05 | -4.57 | 0.000 | 0.053 | 0.145 | 0.090 |
| 5.15 | -4.57 | 0.000 | 0.053 | 0.145 | 0.090 |
| 5.25 | -4.63 | 0.000 | 0.047 | 0.131 | 0.082 |
| 5.35 | -4.65 | 0.000 | 0.045 | 0.127 | 0.080 |
| 5.45 | -4.67 | 0.000 | 0.043 | 0.123 | 0.077 |
| = 1.0 | |||||
| 5.05 | -4.18 | 0.000 | 0.096 | 0.255 | 0.172 |
| 5.15 | -4.18 | 0.000 | 0.096 | 0.255 | 0.172 |
| 5.25 | -4.29 | 0.000 | 0.090 | 0.243 | 0.164 |
| 5.35 | -4.31 | 0.000 | 0.088 | 0.238 | 0.161 |
| 5.45 | -4.33 | 0.000 | 0.086 | 0.233 | 0.158 |
| = 3.0 | |||||
| 5.05 | -4.02 | 0.000 | 0.162 | 0.464 | 0.357 |
| 5.15 | -4.06 | 0.000 | 0.150 | 0.410 | 0.307 |
| 5.25 | -4.10 | 0.000 | 0.138 | 0.355 | 0.257 |
| 5.35 | -4.12 | 0.000 | 0.133 | 0.354 | 0.248 |
| 5.45 | -4.14 | 0.000 | 0.127 | 0.332 | 0.238 |
| log (yr) | log | log | log | log | log |
|---|---|---|---|---|---|
| = 0.33 | |||||
| 5.05 | -4.40 | 0.001 | 0.100 | 0.202 | 0.110 |
| 5.15 | -4.45 | 0.001 | 0.090 | 0.184 | 0.099 |
| 5.25 | -4.51 | 0.001 | 0.078 | 0.163 | 0.088 |
| 5.35 | -4.52 | 0.001 | 0.074 | 0.157 | 0.085 |
| 5.45 | -4.53 | 0.001 | 0.070 | 0.151 | 0.082 |
| = 1.0 | |||||
| 5.05 | -4.01 | 0.001 | 0.162 | 0.321 | 0.188 |
| 5.15 | -4.19 | 0.001 | 0.148 | 0.299 | 0.178 |
| 5.25 | -4.22 | 0.001 | 0.140 | 0.287 | 0.170 |
| 5.35 | -4.24 | 0.001 | 0.133 | 0.275 | 0.163 |
| 5.45 | -4.24 | 0.001 | 0.128 | 0.266 | 0.157 |
| = 3.0 | |||||
| 5.05 | -3.73 | 0.002 | 0.206 | 0.406 | 0.261 |
| 5.15 | -4.01 | 0.002 | 0.199 | 0.394 | 0.251 |
| 5.25 | -4.04 | 0.002 | 0.192 | 0.382 | 0.242 |
| 5.35 | -4.05 | 0.002 | 0.181 | 0.361 | 0.227 |
| 5.45 | -4.08 | 0.002 | 0.167 | 0.339 | 0.211 |
| log (yr) | log | log | log | log | log |
|---|---|---|---|---|---|
| = 0.33 | |||||
| 5.05 | -4.28 | 0.002 | 0.128 | 0.215 | 0.109 |
| 5.15 | -4.34 | 0.002 | 0.118 | 0.201 | 0.102 |
| 5.25 | -4.41 | 0.002 | 0.108 | 0.191 | 0.096 |
| 5.35 | -4.43 | 0.002 | 0.103 | 0.183 | 0.092 |
| 5.45 | -4.46 | 0.002 | 0.098 | 0.175 | 0.087 |
| = 1.0 | |||||
| 5.05 | -3.89 | 0.003 | 0.195 | 0.334 | 0.185 |
| 5.15 | -4.00 | 0.003 | 0.186 | 0.320 | 0.177 |
| 5.25 | 4.11 | 0.003 | 0.177 | 0.309 | 0.170 |
| 5.35 | -4.16 | 0.003 | 0.175 | 0.307 | 0.168 |
| 5.45 | -4.18 | 0.003 | 0.161 | 0.286 | 0.156 |
| = 3.0 | |||||
| 5.05 | -3.71 | 0.005 | 0.248 | 0.421 | 0.250 |
| 5.15 | -3.98 | 0.005 | 0.239 | 0.409 | 0.240 |
| 5.25 | -4.02 | 0.004 | 0.227 | 0.389 | 0.226 |
| 5.35 | -4.02 | 0.004 | 0.207 | 0.358 | 0.205 |
| 5.45 | -4.07 | 0.004 | 0.192 | 0.333 | 0.188 |
| log (yr) | log | log | log | log | log |
|---|---|---|---|---|---|
| = 0.33 | |||||
| 5.05 | -4.18 | 0.004 | 0.170 | 0.259 | 0.120 |
| 5.15 | -4.22 | 0.004 | 0.153 | 0.233 | 0.108 |
| 5.25 | -4.34 | 0.004 | 0.137 | 0.207 | 0.096 |
| 5.35 | -4.36 | 0.004 | 0.130 | 0.197 | 0.093 |
| 5.45 | -4.38 | 0.004 | 0.123 | 0.188 | 0.086 |
| = 1.0 | |||||
| 5.05 | -3.97 | 0.008 | 0.237 | 0.352 | 0.181 |
| 5.15 | -4.08 | 0.007 | 0.219 | 0.329 | 0.168 |
| 5.25 | -4.09 | 0.000 | 0.000 | 0.000 | 0.000 |
| 5.35 | -4.14 | 0.006 | 0.201 | 0.306 | 0.154 |
| 5.45 | -4.14 | 0.005 | 0.187 | 0.287 | 0.144 |
| = 3.0 | |||||
| 5.05 | -3.83 | 0.010 | 0.285 | 0.424 | 0.230 |
| 5.15 | -3.95 | 0.009 | 0.270 | 0.403 | 0.217 |
| 5.25 | -3.98 | 0.009 | 0.258 | 0.387 | 0.206 |
| 5.35 | -4.03 | 0.009 | 0.248 | 0.372 | 0.197 |
| 5.45 | -3.48 | 0.087 | 0.749 | 0.887 | 0.558 |
| log (yr) | log | log | log | log | log |
|---|---|---|---|---|---|
| = 0.33 | |||||
| 5.05 | -4.08 | 0.011 | 0.173 | 0.229 | 0.099 |
| 5.15 | -4.11 | 0.010 | 0.164 | 0.213 | 0.091 |
| 5.25 | -4.14 | 0.009 | 0.152 | 0.198 | 0.083 |
| 5.35 | -4.16 | 0.008 | 0.140 | 0.183 | 0.076 |
| 5.45 | -4.19 | 0.007 | 0.134 | 0.174 | 0.072 |
| = 1.0 | |||||
| 5.05 | -3.96 | 0.015 | 0.254 | 0.326 | 0.150 |
| 5.15 | -4.01 | 0.014 | 0.239 | 0.310 | 0.142 |
| 5.25 | -4.04 | 0.013 | 0.227 | 0.297 | 0.135 |
| 5.35 | -4.07 | 0.012 | 0.216 | 0.282 | 0.127 |
| 5.45 | -4.10 | 0.011 | 0.204 | 0.269 | 0.120 |
| = 3.0 | |||||
| 5.05 | -3.83 | 0.020 | 0.318 | 0.410 | 0.199 |
| 5.15 | -3.88 | 0.019 | 0.301 | 0.390 | 0.189 |
| 5.25 | -3.92 | 0.030 | 0.321 | 0.389 | 0.187 |
| 5.35 | -3.38 | 0.113 | 0.661 | 0.740 | 0.416 |
| 5.45 | -3.01 | 0.226 | 0.934 | 0.987 | 0.592 |
| (M⊙) | x0,y0 | xu,yu | xl,yl |
|---|---|---|---|
| 1.0 | 0.00,0.0 | 4.0,0.1 | 5.00,0.00 |
| 1.5 | 1.50,0.0 | 4.0,1.5 | 4.50,0.25 |
| 2.0 | 1.25,0.0 | 2.5,2.5 | 3.50,0.50 |
| 2.5 | 1.00,0.0 | 2.0,4.0 | 3.00,1.00 |
| 3.0 | 1.00,0.0 | 1.5,5.0 | 2.25,1.75 |
| Source | ||||||||||
|---|---|---|---|---|---|---|---|---|---|---|
| Vega | 7.2 | 0.8 | 0.16 | 0.006 | 1.5 | 7.0 | 4.0 | 0.091 | 3.0 | 30bbDust production rate from Su et al. (2005). Our analysis suggests a smaller dust production rate, g yr-1. |
| Model 1ccDebris disk model with = 2 M⊙, = 1/3, = 200 Myr | 7.2 | 0.8 | 0.16 | 0.006 | 4.2 | 10.0 | 3.0 | 0.05 | 0.9 | 0.2 |
| Model 2ddAs in note (c) for = 2 M⊙, = 1, = 200 Myr | 7.2 | 0.8 | 0.16 | 0.006 | 7.2 | 23.0 | 8.0 | 0.11 | 3.8 | 0.6 |
| Model 3eeAs in note (c) for = 2.5 M⊙, = 1/2, = 200 Myr | 7.2 | 0.8 | 0.16 | 0.006 | 10.9 | 15.0 | 4.0 | 0.05 | 2.4 | 0.3 |
| Model 4ffAs in note (c) for = 2.5 M⊙, = 1, = 200 Myr | 7.2 | 0.8 | 0.16 | 0.006 | 15.5 | 23.0 | 5.0 | 0.07 | 4.8 | 0.8 |