The Origin of the Intrinsic Scatter in the Relation Between Black Hole Mass and Bulge Luminosity for Nearby Active Galaxies 11affiliation: Based on observations made with the NASA/ESA Hubble Space Telescope, obtained from the Data Archive at the Space Telescope Science Institute, which is operated by the Association of Universities for Research in Astronomy (AURA), Inc., under NASA contract NAS5-26555. These observations are associated with program AR-10969 and GO-9763.
Abstract
We investigate the origin of the intrinsic scatter in the correlation between black hole mass () and bulge luminosity () in a sample of 45 massive, local ( 0.35) type 1 active galactic nuclei (AGNs). We derive from published optical spectra assuming a spherical broad-line region, and from detailed two-dimensional decomposition of archival optical Hubble Space Telescope images. AGNs follow the relation of inactive galaxies, but the zero point is shifted by an average of dex. We show that the magnitude of the zero point offset, which is responsible for the intrinsic scatter in the relation, is correlated with several AGN and host galaxy properties, all of which are ultimately related to, or directly impact, the BH mass accretion rate. At a given bulge luminosity, sources with higher Eddington ratios have lower . The zero point offset can be explained by a change in the normalization of the virial product used to estimate , in conjunction with modest BH growth (10%–40%) during the AGN phase. Galaxy mergers and tidal interactions appear to play an important role in regulating AGN fueling in low-redshift AGNs.
1 Introduction
Early-type galaxies commonly contain a central black hole (BH) whose mass strongly correlates with the bulge luminosity (Kormendy & Richstone 1995; Magorrian et al. 1998) and stellar velocity dispersion (Gebhardt et al. 2000; Ferrarese & Merritt 2000). Lower-mass BHs found in late-type spirals and spheroidal galaxies follow a similar relation (Barth et al. 2005; Greene & Ho 2006a) but apparently a different relation (Greene et al. 2008). The BH-host scaling relations suggest that BHs play an important role in galaxy formation and evolution (e.g., Granato et al. 2004; Di Matteo et al. 2005; Robertson et al. 2006). Understanding the mechanism by which BHs coevolve with their hosts impacts current models of cosmological structure formation (e.g., Bower et al. 2006; Croton et al. 2006).
A key, unanswered question is how the BH-host scaling relations originated. This issue can be addressed by extending the BH-host scaling relations to active galaxies—wherein, the BH, by selection, is currently still growing—and by tracking the scaling relations to higher redshift to see when and possibly how they were established. BH masses in type 1 (broad-line, unobscured) active galactic nuclei (AGNs) now can be routinely estimated to reasonable accuracy ( dex), from the “virial method” using single-epoch ultraviolet or optical spectra (e.g., Kaspi et al. 2000; McLure & Dunlop 2001; Vestergaard 2002; Greene & Ho 2005). More challenging to obtain are reliable measurements of the underlying host galaxy, particularly of the bulge component, which is maximally affected by the bright AGN core (e.g., McLure et al. 1999; Floyd et al. 2004; Nelson et al. 2004; Greene & Ho 2006b; Kim et al. 2007), although substantial progress has been made.
Recent studies present tantalizing evidence that the BH-host scaling relations for active galaxies evolve with redshift, even by (Woo et al. 2006; Treu et al. 2007) and as far back as (Peng et al. 2006a, 2006b; Shields et al. 2006; Ho 2007). Compared to local, inactive systems, the sense of the evolution is that for a given host galaxy mass or gravitational potential, higher redshift AGNs have a larger BH mass than similar systems at low redshift. Taken at face value, this suggests that the growth of the BH precedes, or at least outpaces, the growth of the galaxy at higher redshifts. On the other hand, local () AGNs seem to behave quite differently. McLure & Dunlop (2002) studied a sample of 72 nearby AGNs and find that they roughly follow the same relation defined by inactive galaxies, albeit with a somewhat greater scatter. In the relation of AGNs, highly accreting AGNs seem to have a different normalization in the sense that they tend to have a lower for a given (Greene & Ho 2006b; Shen et al. 2008). A similar trend is seen by Ho et al. (2008), using H I line widths to constrain the gravitational potential of the underlying host galaxy.
As a concrete step toward establishing a robust baseline for comparison
with high- studies, this series of papers (Kim et al. 2007, 2008; M. Kim
et al., in preparation) focuses on quantifying the local ![[Uncaptioned image]](/html/0807.1337/assets/x1.png)
Distribution of vs. Eddington ratio. Radio-loud and radio-quiet objects are denoted by filled and open symbols, respectively.
relation for active galaxies. Among nearby inactive galaxies, BH mass correlates only marginally less tightly with bulge luminosity or mass than with bulge stellar velocity dispersion (Marconi & Hunt 2003; Häring & Rix 2004; Novak et al. 2006). Moreover, the relation for active galaxies shows no large systematic differences from that of inactive galaxies (McLure & Dunlop 2002). This suggests that the relation can be used as a useful substitute for the relation, being an especially effective observational tool to track the cosmological evolution of the BH-galaxy connection (Peng et al. 2006a, 2006b; Treu et al. 2007). Whereas stellar velocity dispersions are difficult, if not impossible, to measure for distant quasars, for example, photometric measurements of quasar hosts continue to be feasible even out to high redshifts, either through direct imaging (e.g., Kukula et al. 2001; Ridgway et al. 2001) or through strong lensing magnification (Peng et al. 2006b). In a companion paper, Kim et al. (2008) demonstrate that the bulge luminosity of type 1 AGNs can be measured to a reasonable accuracy ( mag) in Hubble Space Telescope (HST) images, even in the regime when the active nucleus far outshines the galaxy.
Instead of characterizing the full relation for AGNs, this paper restricts itself to only one important aspect: the origin of the intrinsic scatter. By choosing a sample for which we can estimate reliable BH masses and for which we can derive robust measurements of bulge luminosity from HST images, our objective is to quantify the true intrinsic scatter of the relation and to characterize possible variations of the scatter with physical properties of the AGN, host galaxy, or environment. By elucidating the physical drivers that influence the scatter of the relation, we hope to gain insights on how the BH-host galaxy relations were established.
This paper is structured as follows. We describe the sample selection in
§2. We present the image-fitting procedure for measuring bulge
luminosities and our image decomposition results in §3.
We investigate the relation for type 1 AGNs in §4.
Finally, Section 5 discusses the origin of
the intrinsic
![[Uncaptioned image]](/html/0807.1337/assets/x2.png)
Distribution of redshifts for our sample. The open histogram shows the total sample; the hatched histogram shows the objects with low Eddington ratio (/); the dashed histogram shows the radio-loud objects.
scatter in the relation, ending with a summary in §6. Throughout we adopt the following cosmological parameters: km s-1 Mpc-1, , and (Spergel et al. 2003).
2 Sample Selection
Our initial selection begins with all AGNs known to possess broad emission lines (type 1 objects), and have reasonably deep, and non-highly saturated optical images in the HST public archive. Since we are interested in establishing the local relation, we only consider sources with 0.35. Next, we carefully search the literature for published measurements of broad emission-line widths (either H or H), which are needed for calculating . Although this step is necessarily somewhat subjective, we try to be consistent in selecting only objects that have line widths with published error bars 10%. The availability of spectrophotometric measurements is not essential for us because our BH masses ultimately make use of the nuclear luminosities from our photometric decomposition of the nucleus (§3.3). The above screening process yields approximately 200 objects.
Since the principal aim of this work is to study the intrinsic scatter of the relation, it is imperative that we choose objects for which we can obtain the most reliable estimates of the two primary quantities of interest, and . Guided by this overriding goal, we purposely restrict our sample to the upper end of the distribution. All else being equal, this selection criterion biases the sample toward more luminous, more massive, earlier-type hosts for which we can derive more reliable bulge parameters because the structural decomposition will be less complicated than in later-type systems. An added benefit of this mass selection is that our sample will consist of close analogs of higher-redshift quasars. For concreteness, we choose sources with . This limit111Our BH masses assume a smaller geometrical factor than that used in Onken et al. (2004), by a factor of 1.8. Thus, = on our scale is equivalent to = on the scale of Onken et al. We note that that our main conclusions do not rely on the geometrical factor. This issue is discussed in §5.2. is admittedly somewhat
![[Uncaptioned image]](/html/0807.1337/assets/x3.png)
![[Uncaptioned image]](/html/0807.1337/assets/x4.png)
![[Uncaptioned image]](/html/0807.1337/assets/x5.png)
![[Uncaptioned image]](/html/0807.1337/assets/x6.png)
![[Uncaptioned image]](/html/0807.1337/assets/x7.png)
![[Uncaptioned image]](/html/0807.1337/assets/x8.png)
![[Uncaptioned image]](/html/0807.1337/assets/x9.png)
![[Uncaptioned image]](/html/0807.1337/assets/x10.png)
Distribution of the differences in host galaxy magnitudes from the 2-D imaging-fitting simulations of Kim et al. (2008). Artificial images of AGN host galaxies with a range of input parameters were generated, and GALFIT was used to recover the input parameters. The open histograms denote the errors for idealized conditions in which the fitting was done with the same PSF as used for making the input images. The hatched histograms give the errors for the more realistic situation that accounts for PSF mismatch (see Kim et al. 2008 for details). PSF mismatch causes significant systematic errors.
arbitrary, but it yields a sizable sample of 45 objects. Our objects (Table 1) span orders of magnitude in accretion rate (Eddington ratio) over a relatively narrow range ( dex) in (Fig. 1) and redshift (Fig. 2). From radio data assembled from the literature, 33% (15/45) of the sample is radio-loud, defined by , where Å) (Kellermann et al. 1989).
3 Analysis
3.1 Structural Decomposition
Our companion paper (Kim et al. 2008) discusses in detail our technique for decomposing the HST images of AGN host galaxies. We performed extensive simulations to quantify the performance of the two-dimensional (2-D) image-fitting code GALFIT (Peng et al. 2002) under conditions typically encountered in AGN host galaxy images contained in the HST archive, similar to those analyzed in this study. We paid particular attention to quantifying systematic uncertainties in estimating the photometric parameters of the bulge component and devised strategies for mitigating them.
In the regime where the bright, unresolved active nucleus dominates over the light of the host galaxy, our ability to extract the bulge luminosity depends sensitively on the properties of the point-spread function (PSF). PSF mismatch systematically biases the derived bulge luminosities to high values, by as much as 0.5–1 mag (Fig. 3). PSF mismatch occurs as a result of variations in time, location on the detector, and, to a lesser extent, differences in the spectral energy distribution between the PSF star and the science target. The dominant effect, however, comes from the fact that HST PSFs are undersampled. Because the PSFs are not Nyquist-sampled, it is impossible to shift by a sub-pixel unit to perfectly align the PSF star with the AGN core. Kim et al. (2008) show that this fundamental problem outweighs most other concerns, including the choice of actually observed (stellar) or synthetic (TinyTim; Krist 1995) PSFs. They demonstrate that the undersampling problem can be significantly alleviated by broadening both the science image and the PSF image to critical sampling [full width at half maximum (FWHM) pixels]. This is the strategy we adopt here. Although the choice of real versus synthetic PSFs is secondary, we use observed PSF stars whenever possible. When these are not available, we use TinyTim PSFs.
As in our companion paper, we use an updated version of GALFIT (C. Y. Peng et al., in preparation)222http://www.ociw.edu/peng/work/galfit/newfeatures.html. The code simultaneously fits multiple components to model the host galaxy, with the freedom to use Fourier modes to accommodate complex, nonaxisymmetric features such as tidal distortions or even spiral arms. These improvements allow us to obtain a more accurate decomposition of the structural components of the host, an important consideration for our aim of deriving robust bulge luminosities.
We model the active nucleus with a synthetic PSF and the host galaxy with ellipses represented by a Sérsic (1968) function:
| (1) |
where is the effective radius, is the intensity at , is the Sérsic index, and satisfies
| (2) |
The Sérsic function reduces to an exponential profile for and a de Vaucouleurs (1948) profile for .
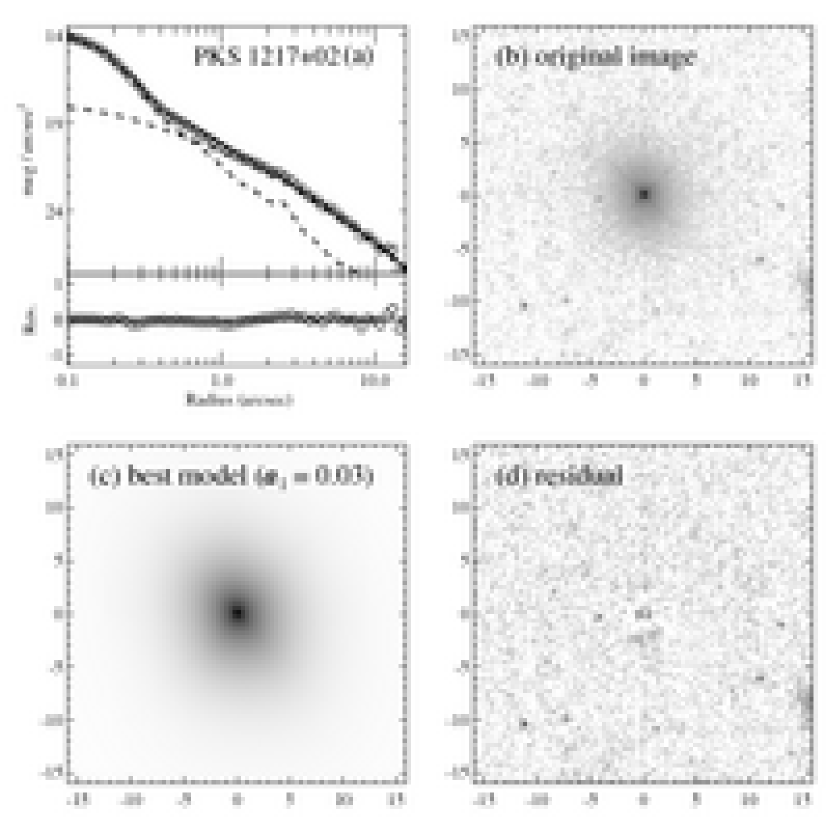
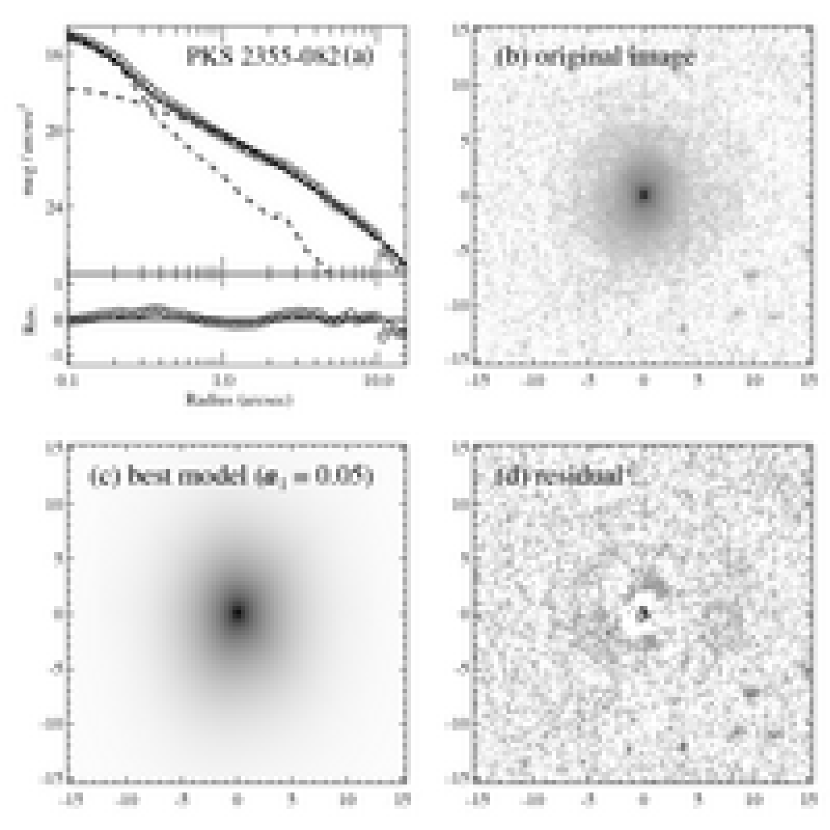
Several different fits are done for each object. We determine the sky value from a growth curve analysis of the image. We begin with the simplest possible option of modeling the host with a single Sérsic component, allowing the index to be free as well as fixing it to and . Our simulations show that when the AGN is much brighter than the bulge allowing to be free can sometimes lead to spurious results. In these situations, it is better to fix to specific values in the fit and then empirically bracket the resulting host luminosity from the range of acceptable models, as judged from the relative change of and visual examination of the model residuals. With the Sérsic index fixed, the program solves for the following free parameters: for the host galaxy, these are the position, effective radius , surface brightness at , axis ratio, and position angle; for the AGN, these are the position and nuclear magnitude, . Figure 56 gives an example of a single-component fit for PKS 2355082.
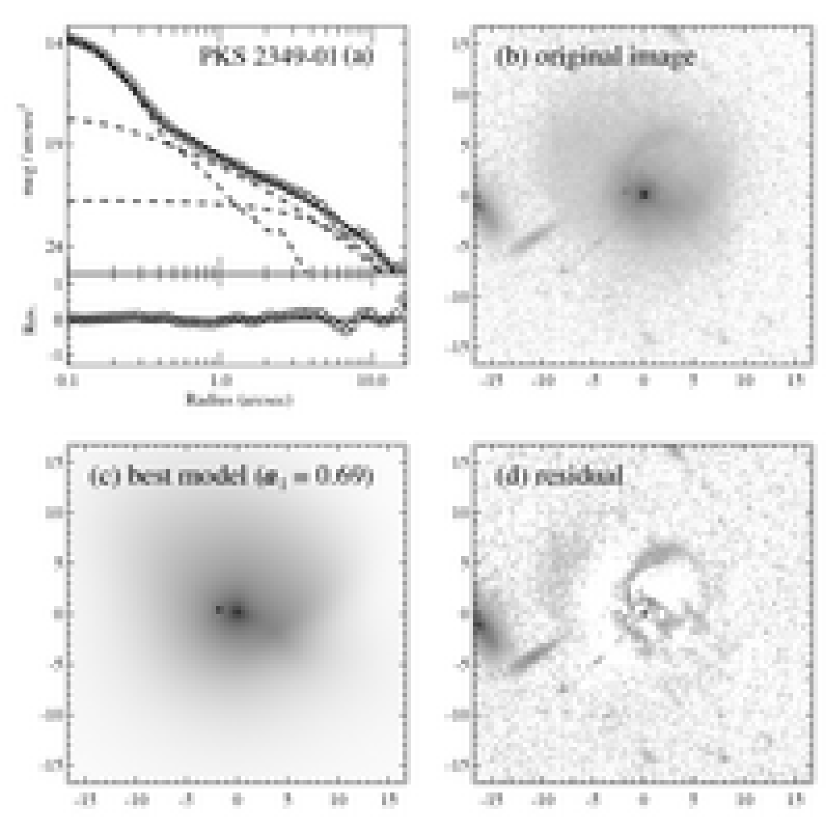
We perform two-component (bulge+disk) fits to objects that clearly have a disk component in the original image or that show significant extended structure in the residual image after subtraction of a single-component model. We try three cases: (1) for bulge and for disk; (2) = free for bulge and for disk; and (3) = free for bulge and = free for disk. We permit the bulge to have to allow for the possibility of pseudobulges (Kormendy & Kennicutt 2004), and the disk can deviate from a pure exponential profile if it is severely distorted, if it has bar or ring-like structures, or if it represents tidal features and arcs. In most cases when a disk is present, it tends to have a smaller Sérsic , a larger , and often a smaller axial ratio than the bulge. The disk component adds four additional free parameters, namely position, , , axis ratio, and position angle. Figure 24 gives an example of a bulge+disk fit for MS 1059.0+7302.
The choice between a single-component and a double-component fit for the host galaxy is not always clear. Adding extra free parameters obviously yields a better fit. The question is whether the extra component is clearly required and physically meaningful. For example, when PSF mismatch is particularly severe, the extra component might simply be attempting to account for the large residuals from the poor PSF model. In such situations the “extra” component tends to have unusual properties such as suspiciously tiny or extreme values of . In practice, complicated fits often require some degree of judgment call, but we have tried to err on the side of caution and generally invoke extra components only when they are absolutely needed. In most cases, we admit an additional component only if it is clearly visible in the original image or in the residual image.
A disk component may be present but undetectable in shallow images (e.g., Bennert et al. 2008). It is thus very useful to place an upper limit on the disk component even if no disk is required by the best-fit model of the HST image. For objects with no directly detected disks, we derive upper limits for the disk component by placing artificial (face-on) disks covering a wide range of luminosity on the science image, assuming that the host galaxy follows the relation between bulge-to-total light ratio () and the ratio of disk size to bulge effective radius derived from nearby early-type galaxies (de Jong et al. 2004). We then fit the simulated images with two-component (bulge+disk) models. The disk luminosity at which the program fails to recover the input value gives an estimate of the upper limit for the disk component. We did not attempt to derive disk upper limits for systems that are exceptionally complicated (e.g., highly distorted, close companions, etc.).
The updated version of GALFIT also has the ability to model spiral arms in the disk. The spiral structure is created by a hyperbolic tangent rotation function with the following parameters: bar length, outer spiral radius, rotation rate, sky inclination, and position angle. The details of the spiral structures are created by high-order Fourier modes. Figure 41 shows the fit for PG 1411+442, whose disk component shows two prominent spiral arms.
A unique aspect of our analysis is that we attempt to quantitatively estimate the degree to which the host galaxy exhibits nonaxisymmetric distortions. Morphological disturbances may be signatures of recent mergers or tidal interactions, which might trigger or enhance AGN fueling. While a variety of techniques have been devised to characterize morphological asymmetry in inactive galaxies (e.g., Conselice et al. 2000; Lotz et al. 2004), they cannot be readily extended to galaxies containing bright AGNs because the central point source can dominate the asymmetry signal. The latest version of GALFIT implements asymmetry parameters as an integral part of the image-fitting process. This is accomplished by introducing higher-order Fourier modes to change the shape of the host galaxy from axisymmetric ellipses into more complicated shapes. All the while the light profile of the host galaxy model would still decline as a Sérsic profile in every direction from the peak. In this scheme, the strength of an external perturbation on the host galaxy would sensitively register as high-amplitude Fourier modes, with phase angles that reflect the direction of the perturbation.
If the residual image shows significant nonaxisymmetry, we adopted a Fourier component to fit it. The Fourier mode has the following form:
| (3) |
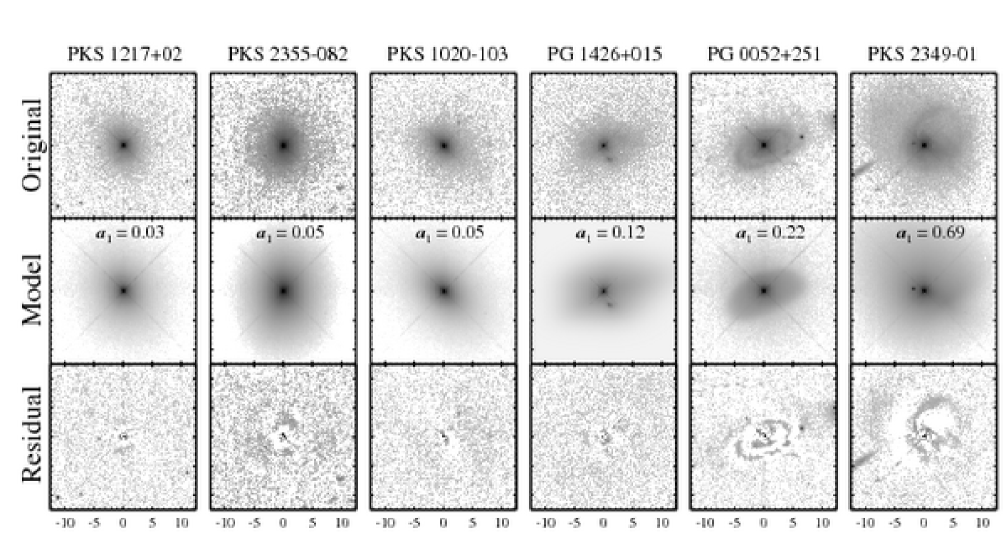
In this expression, , where () is the centroid of the ellipse, is the axis ratio, is the generalized ellipse, is the amplitude for mode , and is the phase angle for mode . The Fourier mode is always coupled with a general single (e.g., Sérsic) component and shows how much a component is perturbed from the perfect ellipsoid. Thus, the Fourier mode allows us to quantify the degree of asymmetry. In principle, we can use an infinite number of Fourier modes, but in practice we find that four modes () are enough to fit the asymmetrical structures encountered in our sample. Figure 4 illustrates a series of objects with increasing strengths in . Sources with 0.1 show little to no obvious signs of morphological perturbation, whereas those with 0.1 appear increasingly disturbed.
Despite the significant new features of the updated version of GALFIT, we note that the derived values of many standard parameters (e.g., size and luminosity) are not substantially different between the original and new versions of the code. In situations where there are differences, the new features of the code allow for better convergence, especially when it comes to multi-component decompositions. The updated version of GALFIT has been tested extensively by us, but for the sake of brevity we defer a full discussion of the technical details to an upcoming paper (C. Y. Peng et al., in preparation).
Table 2 summarizes the results of the structural decomposition. For each object, we list the best-fit nuclear and photometric parameters for the bulge, disk or tidal feature, and for the overall host galaxy; the parameter is also tabulated.
3.2 Bulge Luminosities
The error bars on the bulge measurements are influenced by a number of systematic uncertainties. Using the simulations in Kim et al. (2008) as a guide, the final error budget on the bulge luminosity was estimated as follows. For sources with , , whereas if . On top of these values, additional uncertainties are introduced if bulge-to-disk decomposition is required (), if saturation occurs (), or if the image contains substantial inner fine structure (). We also determine the error of the host luminosity () from the simulations at a given . According to Kim et al., the error on the nucleus magnitude is mag.
Because of the complexity of the GALFIT decomposition, it is worthwhile to cross-check our 2-D parametric fits with a nonparametric estimate of the host luminosity (see, e.g., Greene et al. 2008). To perform this test, we remove the nucleus from each source simply by subtracting a shifted, scaled PSF model from the peak of the AGN core. After masking out obvious companions and foreground stars, we sum up the remaining flux to estimate the total host galaxy magnitude. As a separate test, we compute the host galaxy flux after subtracting the PSF component derived from the best-fitting GALFIT model for the entire image. These two tests give the range of values tabulated as in Table 2. Comparison of these estimates with the host magnitudes obtained from the parametric fits () shows reasonably good agreement for the majority of the sources. The few cases in which is substantially brighter than can be attributed to large residuals from PSF mismatch and contamination from neighboring sources.
A significant number of the sources in our sample overlap with those studied by Dunlop et al. (2003), affording an independent, external check of our analysis. Dunlop et al. also performed 2-D decomposition of their sample, but they fitted the host galaxies with only a single component, modeled as either a classical de Vaucouleurs () bulge or an exponential () disk. After accounting for differences in the adopted cosmological parameters, we find, not surprisingly, that for bulge-dominated sources our bulge magnitudes generally agree well (to within 0.1 mag) with those given by Dunlop et al. The exceptions are objects with large, nearby neighbors and sources with multiple components. Whereas we perform a simultaneous 2-D fit of all nearby sources that could potentially affect our target of interest, Dunlop et al. simply masked them out. This could lead to systematic errors in the derived properties of the primary host.
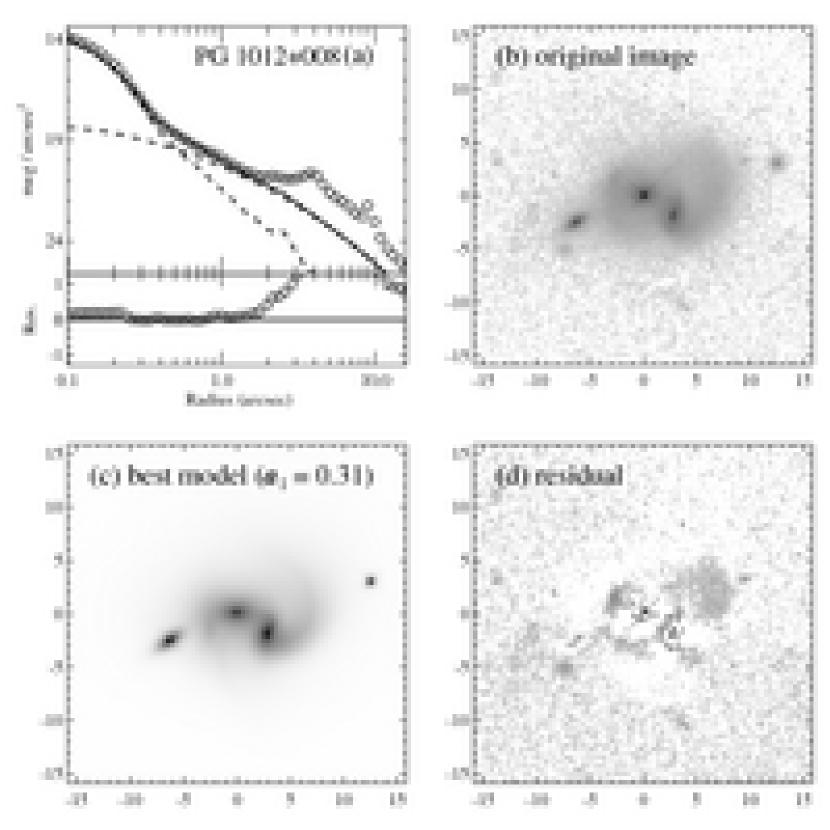
A particularly striking example is PG 1012+008, which is an obviously interacting system consisting of three galaxies. Simultaneously accounting for the subcomponents, including an off-centered disk, our best-fit model yields a bulge with = 17.1 (F675W) and an effective radius of = 296, or 9.3 kpc. By contrast, Dunlop et al. obtain = 16.4 mag and = 575, which corresponds to 18 kpc using our assumed distance of 896 Mpc. For sources that clearly contain both a bulge and a disk (e.g., PKS 234901), our two-component fits yield more robust bulge luminosities. Lastly, for completeness, we note that our final nuclear magnitudes (Table 3), converted to the band, are systematically brighter by 0.4 mag compared to those given in Dunlop et al. This difference can be traced to the different assumptions used for calculating the -correction. Dunlop et al. assumed that the AGN spectrum can be represented by a single power law (), whereas we use the empirical quasar composite spectrum of Vanden Berk et al. (2001).
Five of our objects (MS 0754.6+3928, MS 1059.0+7302, MS 1545.3+0305,
PG 1416129, and PG 1426+015) overlap with the sample studied by Schade et
al. (2000), who also performed 2-D fits to derive photometric parameters for
the host galaxies. The two studies show significant difference in the sense
that Schade et al. tend to underestimate the nuclear magnitudes on average
by 0.2 mag and to overestimate the bulge magnitudes by 0.7 mag. Some
objects show particularly striking disagreement. In our analysis, the host
galaxy of MS 1059.0+7302 is well described by a
bulge+disk model. Our best fit yields the mag and
= 038 for the bulge and mag and
= 276 for the disk. By contrast, Schade et al. find
mag and = 347 for the bulge and
mag and = 128 for the disk.
We attribute the discrepancy between our results and those of Schade et al.
to a difference in methodology. Schade et al. fitted the HST images
simultaneously with ground-based images. Although the ground-based images
are deeper, they have a much broader and less stable PSF than the HST images; it is difficult to know how this effect impacts the fitting results.
Other differences stem from the model adopted in the fit. In our work,
PG 1426+015 is best fit
![[Uncaptioned image]](/html/0807.1337/assets/x12.png)
Correlation between BH mass and absolute -band magnitude for the bulge. The BH masses are derived from reverberation mapping (red circles) or from single-epoch spectra (blue stars), and the bulge luminosities are based on the GALFIT decomposition. The values of estimated from single-epoch spectra are assumed to have a systematic uncertainty of 0.2 dex. The best fit is plotted as a solid line, and the intrinsic scatter is denoted by the dashed lines. The relation for inactive galaxies is shown by the thick hatched line.
with a two-component bulge+disk model with a significant Fourier mode, whereas Schade et al. employed only a single-component bulge for the host. If we adopt a single-component model, our results agree well with those of Schade et al.
The bulge magnitudes listed in Table 2 were derived from images taken in different filters. For our subsequent analysis, we need to convert the magnitudes to a single standard bandpass at = 0. For ease of comparison with the relation of inactive galaxies (Bettoni et al. 2003), we choose the band as the reference. We perform the color conversion of the observed magnitude in the various HST filters to the band and apply -correction using galaxy template spectra from Calzetti et al. (1994) and Kinney et al. (1996). We assume that the bulge component has the spectrum of an elliptical galaxy and that the disk component is approximated by a late-type (Sc) galaxy. For the images taken in the F814W filter, we employ the template spectrum of a starburst galaxy for the disk component because the template spectrum of a late-type galaxy is unavailable in this wavelength regime. The final -band absolute magnitudes are given in Table 3.
3.3 Black Hole Masses
The BH masses for type 1 AGNs can be estimated from the virial product , where is the radius of the broad-line region (BLR), is the line width of the BLR gas represented by FWHMHβ, the FWHM of the broad H line, and is a factor of order unity that depends on the structure, dynamics, and inclination angle of the BLR. Direct measurements of through reverberation mapping are available only for a small number of sources (Peterson et al. 2004), but fortunately this quantity can be estimated from the correlation between and luminosity (Kaspi et al. 2000, 2005). The virial product is, however, uncertain by the normalizing factor . Assuming that the BLR is spherical and has an isotropic velocity field, , and the latest radius-luminosity relation from Bentz et al. (2006) yields,
| (4) |
where is the continuum luminosity at 5100 Å (see Greene & Ho 2007b for details).
The continuum luminosity can be estimated either through spectrophotometry or through our image analysis. Spectrophotometry has the advantage that the specific continuum flux at the desired wavelength can be directly measured without making assumptions about the spectral shape. On the other hand, accurate absolute spectrophotometry is nontrivial to achieve and is rarely available for most objects in the literature. Moreover, ground-based apertures invariably blend the nucleus with at least part of the host. By contrast, our careful image decomposition yields a clean, unambiguous measurement of the nuclear continuum. Our nuclear magnitudes have a typical uncertainty (dominated by systematic effects from PSF mismatch) of 0.1 mag. We need to assume a spectrum (we choose the quasar template from Vanden Berk et al. 2001) in order to estimate the continuum luminosity at 5100 Å, but the amount of extrapolation for our filters is minimal. A more significant uncertainty comes from temporal variability between our photometric measurements and the literature-based spectral observations used to obtain FWHMHβ. Nevertheless, AGNs of the luminosity considered here usually vary by only mag on long timescales (e.g., Giveon et al. 1999). The widths of broad emission lines in type 1 AGNs typically have an uncertainty of (e.g., Marziani et al. 2003). Taking all of these factors into consideration, we estimate that they introduce a measurement uncertainty of only 0.2 dex in . The largest source of uncertainty for the single-epoch masses, however, probably comes from the intrinsic scatter of the radius-luminosity relation, which is estimated to be dex (Bentz et al. 2006). According to Peterson et al. (2004), the values of derived from reverberation mapping are accurate to %, or 0.1 dex. We note that there is an additional uncertainty on the geometrical factor (). For instance, Collin et al. (2006) argued that might be dependent on the accretion rate. We visit this issue in §5.2.
4 The Relation for Type 1 AGNs
Figure 5 shows the relation for our sample of type 1 AGNs. Objects with derived from reverberation mapping are encoded separately from those based on single-epoch spectra. We assume that the relation follows a log-log relation
| (5) |
The thick hatched line represents the relation for inactive galaxies from Bettoni et al. (2003). Converted to our cosmology (see Peng et al. 2006a), the best-fitting relation for inactive galaxies is described by and , with a scatter of 0.4 dex.
We estimate and for the active sample by minimizing , defined as
| (6) |
![[Uncaptioned image]](/html/0807.1337/assets/x13.png)
Dependence of the relation on Eddington ratio. Blue stars and solid line represent the correlation and the best fit for high-Eddington ratio objects (/). Red circles and dashed line represent low-Eddington ratio objects (/). We fixed the slope to , as derived for the inactive galaxies, whose relation is denoted by the thick hatched line. Measurement uncertainties of 0.1 and 0.2 dex are adopted for estimated from reverberation mapping and single-epoch spectra, respectively.
where , , and and are the measurement errors of and , respectively (Tremaine et al. 2002). This method treats both and as independent variables and accounts for asymmetric uncertainties for each.
The estimation of the relation depends on , the choice of errors for . If we adopt an uncertainty of 0.4 dex for the masses based on single-epoch spectra, the value is practically dominated by the reverberation-mapped objects because their uncertainties are a factor of 4 smaller, resulting in a relation strongly biased toward the reverberation-mapped subsample. For concreteness, we assume that uncertainties on the single-epoch masses are 0.2 dex, which is a typical measurement error (§3.3). As Figure 5 shows, our sample of AGNs cluster around the fiducial relation of inactive galaxies with significant scatter. The formal fit for the AGNs has a slope of , flatter than for inactive galaxies (), but because of the limited dynamic range in , we do not regard the AGN fit to be robust. A more meaningful exercise is to fix the slope of the relation to the value for inactive galaxies and then examine the offset and scatter of the AGN sample. Fixing to , the AGN sample has and an rms scatter of 0.4 dex.
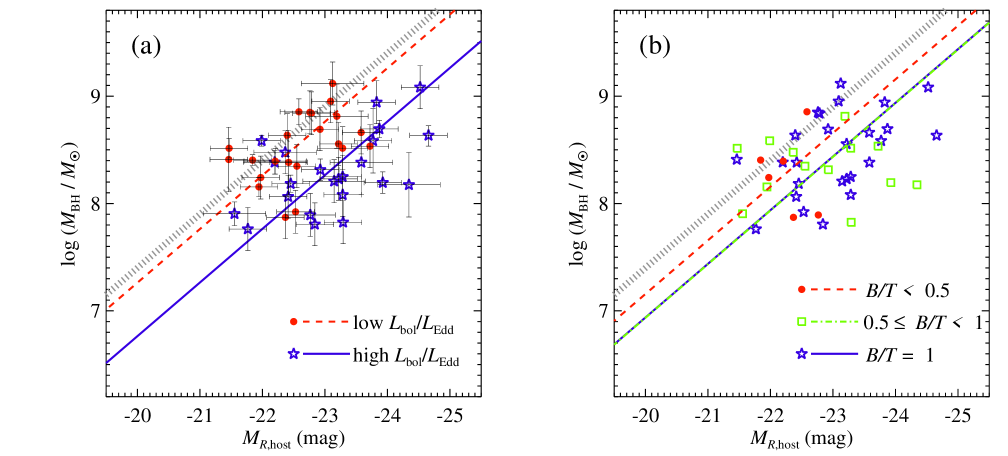
4.1 Dependence on Eddington Ratio
To understand the physical origin of the intrinsic scatter in the relation, we divide the sample into two bins in Eddington ratio, at / =
0.1. The Eddington luminosity is defined as ergs s-1, and the bolometric luminosity is estimated assuming
(Kaspi et al. 2000).
Figure 6 shows a clear offset between the two subsamples.
At a given , objects with high Eddington ratios tend to be hosted by more
luminous bulges, or, alternatively, at a given bulge luminosity they tend to
have less massive BHs. In order to quantify the offset between the two
subsamples, we fix the slope to that of the relation for inactive
![[Uncaptioned image]](/html/0807.1337/assets/x14.png)
Similar to Figure 6, except that here we show the dependence on galaxy morphology: elliptical galaxies (; blue stars and solid line), bulge-dominated systems (; green squares and dash-dotted line), and disk-dominated systems (; red circles and dashed line).
galaxies. At a fixed , the offset in is dex; at a fixed , the offset in is mag. We note that these offsets are much larger than the measurement errors. Performing a Kolmogorov-Smirnov test to evaluate how in the two subsamples is distributed, we find that the null hypothesis that the two subsamples are drawn from the same parent population can be rejected with a probability of 97.3%. As discussed in §5.2, the segregation between the two subsamples really do reflect intrinsic differences in Eddington ratios rather than uncertainties in the determination of BH mass.
4.2 Dependence on Morphological Type
The availability of robust structural decomposition gives us an opportunity to
examine possible trends with morphological type. Using the measured values
of bulge-to-total luminosity ratio (; Table 2) and the correlation
between morphological type and in normal, inactive galaxies (Simien &
de Vaucouleurs 1986), we divide the
sample into three subgroups: (ellipticals),
(bulge-dominated), and (disk-dominated). Figure 7 (see also Table
4) shows that the zero point of the relation, and possibly scatter, may
depend on , although given the limited statistics we regard the evidence
as tentative. Ellipticals and early-type, bulge-dominated galaxies appear
virtually indistinguishable, but later-type, disk-dominated systems
() appear distinctly offset to larger (by dex) at a fixed . The magnitude of the offset is much larger
than possible systematic biases in bulge luminosities resulting from
uncertainties in bulge-to-disk decomposition ( mag; see Fig. 14 in
Kim et al. 2008). As discussed in §5.1, in many instances
our two-component fits may not correspond strictly to a bulge+disk
decomposition but rather to a bulge+tidal feature decomposition.
![[Uncaptioned image]](/html/0807.1337/assets/x15.png)
Similar to Figure 6, except that here we show the dependence on the degree of interaction. Non-interacting or mildly interacting objects () are denoted by blue stars and the solid line, while strongly interacting systems (), with their names labeled, are denoted by red circles and the dashed line. Four sources with probable minor companions are marked as filled blue stars. The relation for inactive galaxies is shown by the thick hatched line.
4.3 Dependence on Tidal Interaction
We make use of the quantitative measure of galaxy asymmetry, , to study the possible effect of tidal interaction. Given our small sample size, we simply divide it into two bins according to the value of . As shown in Figure 4, seems to provide a useful empirical boundary between objects that are disturbed morphologically () from those that are not (). With this threshold for , however, the two populations show no obvious segregation in the plane. But with the boundary set at a higher threshold of , Figure 8 illustrates that four out of the six objects in our sample with the clearest signs of morphological disturbance do preferentially seem to lie among the most extreme negative outliers in the relation.
4.4 Dependence on Radio Properties
The physical drivers responsible for the generation of jets and radio emission in AGNs are still unclear. Suggestions have included BH mass (e.g., Laor 2000), accretion rate (e.g., Ho 2002), and host galaxy morphology, which might ultimately be linked to BH spin (Sikora et al. 2007). Figure 9 shows that a clear separation exists between radio-loud objects and radio-quiet objects. Radio-loud sources lie preferentially below the relation of inactive galaxies and radio-quiet sources.
4.5 Dependence on Redshift
The redshift range of our objects is small (), and our sample
was not designed to test for evolutionary effects. Nevertheless, even by
Woo et al. (2006) and Treu et al. (2007) have claimed that AGNs
already show evidence of evolution in the BH-host galaxy scaling relations.
Dividing the sources into two bins in redshift (Fig. 10), it appears that the
two subsamples are offset from each other in
![[Uncaptioned image]](/html/0807.1337/assets/x16.png)
Similar to Figure 6, except that here we show the dependence on radio emission: radio-loud sources are marked with blue stars and solid line, and radio-quiet sources are marked with red circles and dotted line. The relation for inactive galaxies is shown by the thick hatched line.
the sense that lower-redshift sources have a higher at a given . This trend, however, is probably a selection effect because low-Eddington ratio, later-type galaxies tend to be closer. Indeed, the subsample has and , to be compared with and for the subsample.
5 Discussion
5.1 Which is the Primary Variable?
We have assembled a sample of local massive type 1 AGNs with reliable
spectroscopic data and host galaxy photometric measurements to investigate the
origin of
![[Uncaptioned image]](/html/0807.1337/assets/x17.png)
Similar to Figure 6, except that here we show the dependence on redshift: low-redshift sources are marked with red circles and dashed line, and high-redshift sources are marked with blue stars and solid line. The relation for inactive galaxies is shown by the thick hatched line.
the intrinsic scatter in the correlation between BH mass and bulge luminosity. Assuming a geometrical factor of for the BLR, we find that the AGNs in our sample lie systematically below the relation of inactive galaxies by an average offset of dex. Moreover, we have shown that the magnitude of the offset correlates with secondary parameters connected with the AGN (Eddington ratio and degree of radio-loudness) and host galaxy (redshift, bulge-to-disk ratio, and signs of morphological disturbance).
Among the several variables that correlate with the offset in the relation, the only one that appears unphysical is that related to redshift. As we noted in §4.5, the apparent dependence on redshift most likely reflects the selection effect that higher redshift sources tend to be biased toward higher Eddington ratios (e.g., Boyle et al. 2000) and more luminous, earlier Hubble types. If we divide the sample into two at , the relation for both the nearby and distant halves continue to exhibit the dependence on / and that we see for the full sample.
Still, among the rest of the variables that correlate with the zero point offset in the relation, which is the primary one? Given that many galaxy and AGN parameters are mutually correlated, this is not a trivial question to answer. We propose that the primary physical driver is the mass accretion rate, as reflected in the Eddington ratio. We argue that the host morphology and degree of tidal disturbance directly affect the AGN accretion rate, and that the accretion rate, in turn, is linked to the radio-loudness parameter.
Although our 2-D fits indicate that the hosts of many of our AGNs have a non-zero disk component apart from a bulge, it is important to recognize that, with few exceptions (Fairall 9, HE 03063301, MS 1059.0+7302, PG 2130+99), most of the sources in our sample do not have regular, normal disks. The vast majority of the sample—by construction when we imposed the cut—is decisively bulge-dominated. Many of the features that we attribute to a “disk,” in fact, are simply diffuse, extended features above and beyond the dominant bulge component, which we have parameterized using a single Sérsic function. There is no a priori reason why the bulge should be defined in such a manner, that it cannot have a more complex light distribution, especially at large radii. In other instances, the extra-bulge component is highly disturbed and almost certainly of tidal origin. With few exceptions (Bennert et al. 2008), these features have generally never been measured before quantitatively in AGN host galaxies. However, it is entirely debatable whether any of these structures truly belongs to or will ever settle into a normal disk component. Instead, we surmise that many of the tidal tails and extended, distorted features, in fact, should be considered as part of the bulge in formation. They are reminiscent of morphological signatures attributed to the late, advanced stages of gas-rich mergers (e.g., Barnes & Hernquist 1996; Lotz et al. 2008) or possibly even gas-poor (“dry”) mergers (e.g., van Dokkum 2005; Naab et al. 2006). Plausible examples of this phenomenon in our sample include [HB89] 0316346 (Fig. 15), HE 14341600 (Fig. 19), and PG 1012+008 (Fig. 32). In support of this hypothesis, Figure 11b illustrates that the morphological segregation seen in the relation (Fig. 7) essentially disappears when the bulge luminosity is replaced with the total luminosity of the host. The scatter also goes down slightly, from 0.40 dex to 0.36 dex in the relation. The dependence on Eddington ratio, however, remains (Fig. 11a).
The above interpretation offers a plausible explanation for the apparent link between morphological type and accretion rate, which otherwise is somewhat perplexing. Within our sample it is the apparently earlier-type, more bulge-dominated systems that actually have higher accretion rates. This runs counter to the trend normally seen in nearby AGNs (e.g., Heckman et al. 2004; Greene & Ho 2007a) and the general tendency for present-day early-type galaxies to be more gas-poor than late-type galaxies. However, if high-mass, luminous AGNs result from the aftermath of gas-rich galaxy-galaxy mergers (e.g., Sanders et al. 1988; Hopkins et al. 2006), our results imply that it is during the most advanced stages of the merger that accretion on the central BH attains its maximum rate. Some of the most highly accreting objects (those with large /) in our sample, which coincide among those with the largest offset in the relation, also happen to be among the ones that show the most conspicuous morphological signatures of tidal perturbations, as measured by the Fourier parameter (see Fig. 8). These include HE 03545500 (/= 0.57; ), PG 1012+008 (/= 0.32; ), PG 1613+658 (/= 0.44; ), and PG 1700+518 (/= 0.71; ). However, not every object with a high / has a large value of . This may imply that not all quasar episodes are triggered by major galaxy interactions, or that accretion can proceed at a substantial rate even after the tidal features have disappeared. To the extent that the peak star formation rate in the merger has already subsided during this phase, our scenario offers an additional explanation for why type 1 AGNs contain intermediate-age stars (Kauffmann et al. 2003) but generally not much concurrent star formation (Ho 2005; Kim et al. 2006).
Within our sample, four AGNs have compact sources—plausibly small accreted companions—projected close to the primary host galaxy. These may be examples of minor mergers. None has a large value of . Two of the four lie exactly on the relation of inactive galaxies (Fig. 8) and have relatively low Eddington ratios (/ = 0.05 for PG 1426+015 and / = 0.06 for PKS 213514). The other two lie offset below the relation, but only PG 1302102 has a large / (0.4); PHL 1093 has / = 0.03. Thus, within our limited statistics, we have no evidence that minor mergers play a significant role in elevating the accretion rate in AGNs.
Within this backdrop, we can offer a tentative explanation for the zero point difference between radio-loud and radio-quiet sources (Fig. 9), one that ultimately links the generation of powerful radio jets to the BH accretion rate and/or host galaxy morphology. But first we should clarify some terminology. There are two popular definitions of “radio-loud” AGNs in the literature, and it is important not to confuse them. One common usage of this term refers to sources that are classified solely by their radio-to-optical flux ratio () as defined by Kellermann et al. (1989)333Terashima & Wilson (2003) advocated a closely related radio-loudness parameter based on the radio-to-X-ray flux ratio., regardless of their radio power. On this basis, the vast majority of AGNs in the local Universe (Ho 2008), most with extremely low luminosities, qualify as being radio-loud, with the degree of radio-loudness increasing with decreasing / (Ho 2002; Terashima & Wilson 2003; Greene et al. 2006). The radio emission in most of these low-power sources is largely dominated by a compact core, and any jet-like features are confined to sub-galactic scales. The host galaxies encompass all morphological types, including spiral galaxies (Ho & Peng 2001). The Milky Way’s Sgr A⋆ is a familiar example. The second commonly used definition of radio-loudness is less clear-cut, but it involves some combination of relative () and absolute ( W Hz-1) measures of radio power. When detected, the radio jets have super-galactic dimensions and are highly collimated. The radio-loud sources in this study, with median and W Hz-1, belong to this second category. Strong radio sources of this variety invariably reside in early-type galaxies (e.g., McLure et al. 1999) and are associated with high accretion rates (e.g., Maccarone et al. 2003; Körding et al. 2006). Nevertheless, only a minority of highly accreting AGNs in massive, early-type host galaxies are radio-loud. There is no universally accepted explanation for this longstanding quandary. One possibility is that a necessary ingredient for the generation of powerful, collimated jets is the existence of a BH with a large spin (e.g., Sikora et al. 2007), which is more easily attained in merger-driven accretion events during the formation of giant elliptical galaxies than in disk or spiral galaxies (Volonteri et al. 2007).
5.2 Physical Interpretation
The principal conclusions of our study are that the zero point of the relation for AGNs is offset from that of inactive galaxies and that the magnitude of the offset correlates with several physical properties of the AGN and host ultimately connected to the accretion rate. These effects account for the bulk of the observed intrinsic scatter in the AGN relation.
Interestingly, other studies of nearby AGNs using different probes of the host galaxy have independently arrived at very similar conclusions. Onken et al. (2004; see also Nelson et al. 2004), analyzing a small sample of type 1 AGNs with available stellar velocity dispersions and BH masses determined through reverberation mapping, concluded that the active systems lie offset below the relation of inactive galaxies by dex if one assumes a spherical BLR. Greene & Ho (2006b) obtained an almost identical result using a much larger sample of type 1 AGNs with measured and estimated from single-epoch spectra. These conclusions have been reaffirmed by Shen et al. (2008) in their analysis of composite AGN spectra derived from the Sloan Digital Sky Survey. A different approach was taken by Ho et al. (2008) through 21 cm H I observations. Using the maximum rotational velocity and total dynamical mass of the galaxy as new variables to represent the gravitational potential of the host, they find that both quantities strongly correlate with . In qualitative agreement with the results from this study, Ho et al. find that the zero point in the scaling relations depends primarily on the accretion rate in the sense that, at a given galaxy rotation velocity and especially dynamical mass, AGNs with higher Eddington ratios have systematically lower than those with lower Eddington ratios.
These trends can be interpreted in one of two ways. In the first instance, we note that AGNs, by selection, have actively growing BHs. We can envision that, at a fixed bulge potential (velocity dispersion, luminosity, mass), active galaxies have less massive BHs than inactive galaxies if the bulk of the star formation precedes, and is not well synchronized with, a major accretion event. This particular time sequence, which is required in order to imprint a net negative offset in the versus host galaxy relations, seems to be supported by the prevalence of post-starburst signatures (Canalizo & Stockton 2001; Kauffmann et al. 2003) as well as the low levels of ongoing star formation (Ho 2005; Kim et al. 2006) found in type 1 AGNs. If the AGN phase lasts, say, for yrs, which is near the upper end of the currently estimated lifetimes (Martini 2004), then a BH would increase its mass by a factor of 2 ( dex) if it is radiating at / = 0.5 with a radiative efficiency of 0.1. This example is merely illustrative. In reality, the AGNs in our sample span a wider range of / and the AGN lifetimes may be shorter. Nevertheless, on average we expect luminous AGNs to lie systematically below inactive galaxies on the relation. Moreover, our study, as do those of Ho et al. (2008) and Shen et al. (2008), further shows that the magnitude of the zero point offset depends on the Eddington ratio: the BH masses of high-Eddington ratio AGNs have more catching up to do than the BH masses of lower-Eddington ratio AGNs. Such a systematic trend can only come about if the accretion rate directly relates to the evolutionary phase of the accretion event. This seems plausible, in light of the apparent association between accretion rate and the degree of tidal perturbation.
Instead of the BH being undermassive, perhaps it is actually the bulge that is overluminous, by mag. First, we dismiss the possibility that the luminosity enhancement could be due to contamination from nebular emission from the narrow-line region. Although the spatial extent of the narrow-line region in quasars can reach several kpc (Bennert et al. 2002), substantially overlapping with the bulge, the typical [O III] luminosities in our sample ( ergs s-1) contribute less than 3% to the luminosity of the bulge ( mag). Given the evidence outlined in §5.1 that the most extreme outliers in the seem to have undergone a recent merger or tidal interaction, a more likely possibility is that the bulge luminosity may be moderately enhanced by the latest episode of central star formation. Indeed, for a small sample of reverberation-mapped Seyfert 1 galaxies with stellar velocity dispersion and bulge luminosity measurements, Nelson et al. (2004) have shown that these objects are somewhat brighter ( mag) than inactive galaxies at a given velocity dispersion. They attributed this offset in the Faber-Jackson (1976) relation to younger stellar populations in AGNs. Boosting the -band luminosity by 0.5 mag requires % of the stellar mass to come from a 1 Gyr population with solar metallicity (Nelson et al. 2004). While this offers a plausible explanation for the offset in the relation seen in our sample, it cannot account for the fact that the most recent and largest samples of nearby type 1 AGNs, statistically at least, show negative offsets (with respect to inactive galaxies) when is compared to all bulge or host galaxy parameters (stellar velocity dispersion, bulge luminosity, total galaxy dynamical mass). The direction of the offset is the same (at a given galaxy parameter, is lower), and the magnitude of the offset is also similar ( dex). Although this clearly needs to be verified with a large sample that has reliable measurements of both velocity dispersion and bulge luminosities, the most recent studies suggest, contrary to Nelson et al. (2004), that local type 1 AGNs actually do not depart from the standard Faber-Jackson (1976) relation. Furthermore, for a large sample of sources with measurements of rotational velocity and total galaxy luminosity, Ho et al. (2008) show that type 1 AGNs show no obvious deviations from the Tully-Fisher (1977) relation of inactive galaxies. In light of these considerations, we favor the view that the negative offset in the relation represents a deficit in rather than an excess in .
Alternatively, we can assert that both active and inactive galaxies intrinsically should obey the same BH mass versus host scaling relations. From this standpoint, the zero point offset between AGNs and inactive galaxies, as well as the variations of the offset with /, can be viewed as a systematic underestimate of the true value of . Recall that our BH masses are based on a virial product assuming a spherical distribution of BLR clouds with isotropic velocities, for which the geometric factor is . If, for example, the BLR (or at least the portion of it that predominantly emits the Balmer lines) has a flattened, disk-like geometry with kinematics dominated by rotation, and on the scale of the BLR type 1 sources happen to be preferentially more face-on to our line of sight, then we systematically underestimate the deprojected rotation velocity and hence . Wu & Han (2001) invoked this line of reasoning to interpret the offset of type 1 AGNs on the relation and concluded that on average their BLRs are inclined by ∘. The same argument can, in principle, be applied to the observed offset in the relation. While the effect of inclination probably enters at some level (see also Collin et al. 2006), it cannot account for the fact that the magnitude of the offset depends on /. The latter is not a trivial consequence of the mass being underestimated because sources with high / truly do exhibit characteristically distinct X-ray, optical, and radio properties (Boller et al. 1996; Boroson 2002; Greene et al. 2006). Whatever the physical origin of the offset (Onken et al. 2004; Collin et al. 2006; Marconi et al. 2008), we can empirically adjust the normalization factor of the virial product by forcing the AGN sample to agree with the fiducial reference of inactive galaxies. To remove the zero point offset of to dex, then, the normalization should be increased by a factor of , from to . For the most extreme offsets of , increases to .
Without additional information, unfortunately, the above two alternative explanations—an undermassive versus an underestimated factor—are degenerate. It is easy to imagine that both effects must operate jointly. On the one hand, the BHs in AGNs are, after all, gaining mass. On the other hand, as discussed in Collin et al. (2006), there are multiple reasons to believe that the BLR has a nonspherical geometry and that the Eddington ratio may influence its structure and dynamics. The only way to resolve this degeneracy is to obtain independent estimates of for AGNs that do not rely on the BLR virial technique. To date, efforts to apply resolved stellar dynamical techniques to reverberation-mapped AGNs have yielded very rough estimates of for only a couple of sources (NGC 3227: Davies et al. 2006; Hicks & Malkan 2008; NGC 4151: Onken et al. 2007), and thus attempting to cross-calibrate the two techniques is still far too premature. BH mass estimators based on X-ray variability seem more promising. Gierliński et al. (2008; see also Hayashida et al. 1998) find that, for accreting BHs in their hard spectral state, the amplitude of their high-frequency X-ray variability scales inversely with over a very wide range of masses. For a small subset of nearby type 1 AGNs, the X-ray-derived masses show rough agreement with obtained through reverberation mapping assuming . A very similar conclusion was reached by Nikołajuk et al. (2006). From comparison of for reverberation-mapped sources with masses obtained using the X-ray excess variance method, these authors estimate , which, interestingly, lies in between the values of the factor for the two extreme alternatives discussed above.
Assuming that the X-ray-derived normalization factor truly does represent the correct normalization factor for the virial masses, then the inferred growth rates for in luminous AGNs are much more modest, from typically as little as 10%–40% (0.05–0.15 dex) to at most 280% (0.45 dex).
Still, we note that the tendency for BHs in local AGNs to be less massive than the BHs in inactive galaxies of similar type runs counter to the trend observed at higher redshift. Already by , type 1 AGNs begin to depart from the local and relations (Woo et al. 2006; Treu et al. 2007), but in the opposite direction as that seen at lower redshifts: at a given or , AGNs are offset compared to local inactive systems by dex. This trend has now been extended by Woo et al. (2008) out to using stellar velocity dispersion measurements. At even higher redshifts, direct measurements are no longer feasible, but surrogate estimates of using narrow emission lines (Salviander et al. 2007) as well as probes of the host galaxy using imaging (Peng et al. 2006a, b) and CO emission lines (Shields et al. 2006; Ho 2007) support the notion that the growth of the BHs in AGNs have been decoupled from, and outpaced, the underlying host.
6 Summary
We performed two-dimensional structural decomposition of a sample of 45 nearby ( 0.35) type 1 AGNs with available archival optical HST images and published spectroscopic data. We calculated virial BH masses assuming a spherical BLR with isotropic velocities. Using a new version of the versatile code GALFIT, we derived detailed fits to the structural components of the host galaxies, yielding not only robust measurements of the bulge luminosities with realistic error bars but also, for the first time, quantitative estimates of nonaxisymmetric features such as extended disks and tidal arms.
Our principal aim is to understand the origin of the intrinsic scatter in the of active galaxies over a restricted range of BH masses ( ). While AGNs closely follow the relation of inactive galaxies, we find that the intrinsic scatter is substantial (0.40 dex) and that the zero point of the relation is shifted by an average of dex. The magnitude of the zero point offset in the relation depends on properties of the AGN (Eddington ratio and radio-loudness parameter) and the host galaxy (morphological type and degree of tidal perturbation). We argue that the principal physical parameter responsible for the variation in zero point is the BH accretion rate, as reflected in the Eddington ratio. We suggest that galaxy mergers and tidal interactions play a substantial role in boosting the accretion rate in this sample of AGNs. A significant fraction of the zero point offset in the relation can be explained if the virial BH masses have been underestimated, as indicated from comparison with independent masses derived from X-ray variability techniques. After accounting for this change in the normalization of the virial BH mass scale, we estimate that BHs during the AGN phase experience a modest growth of 10%–40% in mass.
References
- (1) Barnes, J. E., & Hernquist, L. E. 1996, ApJ, 471, 115
- (2) Barth, A. J., Greene, J. E., & Ho, L. C. 2005, ApJ, 619, L151
- (3) Barvainis, R., & Antonucci, R. 1989, ApJS, 70, 257
- (4) Becker, R. H., White, R. L., & Edwards, A. L. 1991, ApJS, 75, 1
- (5) Becker, R. H., White, R. L., & Helfand, D. J. 1995, ApJ, 450, 559
- (6) Bennert, N., Canalizo, G., Jungwiert, B., Stockton, A., Schweizer, F., Peng, C. Y., & Lacy, M. 2008, ApJ, 677, 846
- (7) Bennert, N., Falcke, H., Schultz, H., Wilson, A. S., & Wills, B. J. 2002, ApJ, 574, L105
- (8) Bennett, C. L., Lawrence, C. R., Burke, B. F., Hewitt, J. N., & Mahoney, J. 1986, ApJS, 61, 1
- (9) Bentz, M. C., Peterson, B. M., Pogge, R. W., Vestergaard, M., & Onken, C. A. 2006, ApJ, 644, 133
- (10) Bettoni, D., Falomo, R., Fasano, G., & Govoni, F. 2003, A&A, 399, 869
- (11) Boller, T., Brandt, W. N., & Fink, H. 1996, A&A, 305, 53
- (12) Boroson, T. A. 2002, ApJ, 565, 78
- (13) ——. 2005, AJ, 130, 381
- (14) Bower, R. G., et al. 2006, MNRAS, 370, 645
- (15) Boyle, B. J., Shanks, T., Croom, S. M., Smith, R. J., Miller, L., Loaring, N., & Heymans, C. 2000, MNRAS, 317, 1014
- (16) Calzetti, D., Kinney, A.L. & Storchi-Bergmann, T. 1994, ApJ429, 582
- (17) Canalizo, G., & Stockton, A. 2001, ApJ, 555, 719
- (18) Collin, S., Kawaguchi, T., Peterson, B. M., & Vestergaard, M. 2006, A&A, 456, 75
- (19) Condon, J. J., Cotton, W. D., Greisen, E. W., Yin, Q. F., Perley, R. A., Taylor, G. B., & Broderick, J. J. 1998, AJ, 115, 1693
- (20) Conselice, C. J., Bershady, M. A., & Jangren, A. 2000, ApJ, 529, 886
- (21) Croton, D. J., et al. 2006, MNRAS, 365, 11
- (22) Davies, R. I., et al. 2006, ApJ, 646, 754
- (23) de Jong, R. S., Simard, L., Davies, R. L., Saglia, R. P., Burstein, D., Colless, M., McMahon, R., & Wegner, G. 2004, MNRAS, 355, 1155
- (24) de Vaucouleurs, G. 1948, Ann. d’Astrophys., 11, 247
- (25) Di Matteo, T., Springel, V., & Hernquist, L. 2005, Nature, 433, 604
- (26) Dunlop, J. S., McLure, R. J., Kukula, M. J., Baum, S. A., O’Dea, C. P., & Hughes, D. H. 2003, MNRAS, 340, 1095
- (27) Eracleous, M., & Halpern, J. P. 1994, ApJS, 90, 1
- (28) Faber, S. M., & Jackson, R. E. 1976, ApJ, 204, 668
- (29) Ferrarese, L., & Merritt, D. 2000, ApJ, 539, L9
- (30) Floyd, D. J. E., Kukula, M. J., Dunlop, J. S., McLure, R. J., Miller, L., Percival, W. J., Baum, S. A., & O’Dea, C. P. 2004, MNRAS, 355, 196
- (31) Gebhardt, K., et al. 2000, ApJ, 539, L13
- (32) Gierliński, M., Nikołajuk, M., & Czerny, B. 2008, MNRAS, 383, 741
- (33) Giveon, U., Maoz, D., Kaspi, S., Netzer, H., & Smith, P. S. 1999, MNRAS, 306, 637
- (34) Granato, G. L., De Zotti, G., Silva, L., Bressan, A., & Danese, L. 2004, ApJ, 600, 580
- (35) Greene, J. E., & Ho, L. C. 2005, ApJ, 630, 122
- (36) ——. 2006a, ApJ, 641, L21
- (37) ——. 2006b, ApJ, 641, 117
- (38) ——. 2007a, ApJ, 667, 131
- (39) ——. 2007b, ApJ, 670, 92
- (40) Greene, J. E., Ho, L. C., & Barth, A. J. 2008, ApJ, in press
- (41) Greene, J. E., Ho, L. C., & Ulvestad, J. S. 2006, ApJ, 636, 56
- (42) Griffith, M. R., Wright, A. E., Burke, B. F., & Ekers, R. D. 1994, ApJS, 90, 179
- (43) ——. 1995, ApJS, 97, 347
- (44) Grupe, D., Wills, B. J., Leighly, K. M., & Meusinger, H. 2004, AJ, 127, 156
- (45) Häring, N., & Rix, H.-W. 2004, ApJ, 604, L89
- (46) Hayashida, K., Miyamoto, S., Kitamoto, S., Negoro, H., & Inoue, H. 1998, ApJ, 500, 642
- (47) Heckman, T. M., Kauffmann, G., Brinchmann, J., Charlot, S., Tremonti, C., & White, S. D. M. 2004, ApJ, 613, 109
- (48) Hicks, E. K. S., & Malkan, M. A. 2008, ApJS, 174, 31
- (49) Ho, L. C. 2002, ApJ, 564, 120
- (50) ——. 2005, ApJ, 629, 680
- (51) ——. 2007, ApJ, 669, 821
- (52) ——. 2008, ARA&A, in press (astro-ph/0803.2268)
- (53) Ho, L. C., Darling, J., & Greene, J. E. 2008, ApJ, in press (arXiv:0803.1952)
- (54) Ho, L. C., & Peng, C. Y. 2001, ApJ, 555, 650
- (55) Hopkins, P., Hernquist, L, Cox, T. J., Di Matteo, T., Robertson, B., & Springel, V. 2006, ApJS, 163, 1
- (56) Kaspi, S., Maoz, D., Netzer, H., Peterson, B. M., Vestergaard, M., & Jannuzi, B. T. 2005, ApJ, 629, 61
- (57) Kaspi, S., Smith, P. S., Netzer, H., Maoz, D., Jannuzi, B. T., & Giveon, U. 2000, ApJ, 533, 631
- (58) Kauffmann, G., et al. 2003, MNRAS, 346, 1055
- (59) Kellermann, K. I., & Pauliny-Toth, I. I. K. 1973, AJ, 78, 828
- (60) Kellermann, K. I., Sramek, R., Schmidt, M., Shaffer, D. B., & Green, R. 1989, AJ, 98, 1195
- (61) Kim, M., Ho, L. C., & Im, M. 2006, ApJ, 642, 702
- (62) Kim, M., Ho, L. C., Peng, C. Y., Barth, A. J., & Im, M. 2008, ApJS, in press
- (63) Kim, M., Ho, L. C., Peng, C. Y., & Im, M. 2007, ApJ, 658, 107
- (64) Kinney, A.L., Calzetti, D., Bohlin, R.C., McQuade, K., Storchi-Bergmann, T. & Schmitt, H.R. 1996, ApJ, 467, 38
- (65) Körding, E. G., Jester, S., & Fender, R. P. 2006, MNRAS, 372, 1366
- (66) Kormendy, J., & Kennicutt, R. C., Jr. 2004, ARA&A, 42, 603
- (67) Kormendy, J., & Richstone, D. O. 1995, ARA&A, 33, 581
- (68) Krist, J. 1995, in Astronomical Data Analysis Software and Systems IV, ed. R. A. Shaw, H. E. Payne, & J. J. E. Hayes (San Francisco: ASP), 349
- (69) Kukula, M., Dunlop, J. S., McLure, R. J., Miller, L., Percival, W. J., Baum, S. A., & O’Dea, C. P. 2001, MNRAS, 326, 1533
- (70) Laor, A. 2000, ApJ, 543, L111
- (71) Letawe, G., Courbin, F., Magain, P., Hilker, M., Jablonka, P., Jahnke, K., & Wisotzki, L. 2004, A&A, 424, 455
- (72) Letawe, G., Magain, P., & Courbin, F. 2008, A&A, 480, 69
- (73) Lotz, J. M., Jonsson, P., Cox, T. J., & Primack, J. R. 2008, MNRAS, submitted (astro-ph/0805.1246)
- (74) Lotz, J. M., Primack, J., & Madau, P. 2004, AJ, 128, 163
- (75) Maccarone, T. J., Gallo, E., & Fender, R. 2003, MNRAS, 345, L19
- (76) Magorrian, J., et al. 1998, AJ, 115, 2285
- (77) Marconi, A., Axon, D. J., Maiolino, R., Nagao, T., Pastorini, G., Pietrini, P., Robinson, A., & Torricelli, G. 2008, ApJ, 678, 693
- (78) Marconi, A., & Hunt, K. L. 2003, ApJ, 589, L21
- (79) Martini, P. 2004, in Carnegie Observatories Astrophysics Series, Vol. 1: Coevolution of Black Holes and Galaxies, ed. L. C. Ho (Cambridge: Cambridge Univ. Press), 170
- (80) Marziani, P., Sulentic, J. W., Zamanov, R., Calvani, M., Dultzin-Hacyan, D., Bachev, R., & Zwitter, T. 2003, ApJS, 145, 199
- (81) Mauch, T., Murphy, T., Buttery, H. J., Curran, J., Hunstead, R. W., Piestrzynski, B., Robertson, J. G., & Sadler E. M. 2003, MNRAS, 342, 1117
- (82) McLure, R. J., & Dunlop, J. S. 2001, MNRAS, 327, 199
- (83) ——. 2002, MNRAS, 331, 795
- (84) McLure, R. J., Kukula, M. J., Dunlop, J. S., Baum, S. A., O’Dea, C. P., & Hughes, D. H. 1999, MNRAS, 308, 377
- (85) Naab, T., Khochfar, S., & Burkert, A. 2006, ApJ, 636, L81
- (86) Nelson, C. H., Green, R. F., Bower, G., Gebhardt, K., & Weistrop, D. 2004, ApJ, 615, 652
- (87) Nikołajuk, M., Czerny, B., Ziolkowski, J., & Gierliński, M. 2006, MNRAS, 370, 1534
- (88) Novak, G. S., Faber, S. M., & Dekel, A. 2006, ApJ, 637, 96
- (89) Onken, C. A., et al. 2007, ApJ, 670, 105
- (90) Onken, C. A., Ferrarese, L., Merritt, D., Peterson, B. M., Pogge, R. W., Vestergaard, M., & Wandel, A. 2004, ApJ, 615, 645
- (91) Peng, C. Y., Ho, L. C., Impey, C. D., & Rix, H.-W. 2002, AJ, 124, 266
- (92) Peng, C. Y., Impey, C. D., Ho, L. C., Barton, E. J., & Rix, H.-W. 2006a, ApJ, 640, 114
- (93) Peng, C. Y., Impey, C. D., Rix, H.-W., Kochanek, C. S., Keeton, C. R., Falco, E. E., Lehár, J., & McLeod, B. A. 2006b, ApJ, 649, 616
- (94) Peterson, B. M., et al. 2004, ApJ, 613, 682
- (95) Ridgway, S. E., Heckman, T. M., Calzetti, D., & Lehnert, M. 2001, ApJ, 550, 122
- (96) Robertson, B., Hernquist, L., Cox, T. J., Di Matteo, T., Hopkins, P. F., Martini, P., & Springel, V. 2006, ApJ, 641, 90
- (97) Salviander, S., Shields, G. A., Gebhardt, K., & Bonning, E. W. 2007, ApJ, 662, 131
- (98) Sanders, D. B., Soifer, B. T., Elias, J. H., Madore, B. F., Matthews, K., Neugebauer, G., & Scoville, N. Z. 1988, ApJ, 325, 74
- (99) Schade, D. J., Boyle, B. J., & Letawsky, M. 2000, MNRAS, 315, 498
- (100) Sérsic, J. L. 1968, Atlas de Galaxias Australes (Córdoba: Obs. Astron., Univ. Nac. Córdoba)
- (101) Shen, J., Vanden Berk, D. E., Schneider, D. P., & Hall, P. B. 2008, AJ, 135, 928
- (102) Shields, G. A., Menezes, K. L., Massart, C. A., & Vanden Bout, P. 2006, ApJ, 641, 683
- (103) Sikora, M., Stawarz, L., & Lasota, J.-P. 2007, ApJ, 658, 815
- (104) Simien, F., & de Vaucouleurs, G. 1986, ApJ, 302, 564
- (105) Spergel, D. N., et al. 2003, ApJS, 148, 175
- (106) Terashima, Y., & Wilson, A. S. 2003, ApJ, 583, 145
- (107) Tremaine, S., et al. 2002, ApJ, 574, 740
- (108) Treu, T., Woo., J.-H., Malkan, M. A., & Blandford, R. D. 2007, ApJ, 667, 117
- (109) Tully, R. B., & Fisher, J. R. 1977, A&A, 54, 661
- (110) Vanden Berk, D. E., et al. 2001, AJ, 122, 549
- (111) van Dokkum, P. G. 2005, AJ, 130, 2647
- (112) Vestergaard, M. 2002, ApJ, 571, 733
- (113) Vestergaard, M., & Peterson, B. M. 2006, ApJ, 641, 689
- (114) Volonteri, M., Sikora, M., & Lasota, J.-P. 2007, ApJ, 667, 704
- (115) Woo, J.-H., Treu, T., Malkan, M. A., & Blandford, R. D. 2006, ApJ, 645, 900
- (116) ——. 2008, ApJ, in press (astro-ph/0804.0235)
- (117) Wu, X.-B., & Han, J. L. 2001, ApJ, 561, L59
- (118) Zheng, X. Z., Xia, X. Y., Mao, S., Wu, H., & Deng, Z. G. 2002, AJ, 124, 18
Appendix A Notes on Individual Objects
Comments on the fitting results for individual objects are given here.
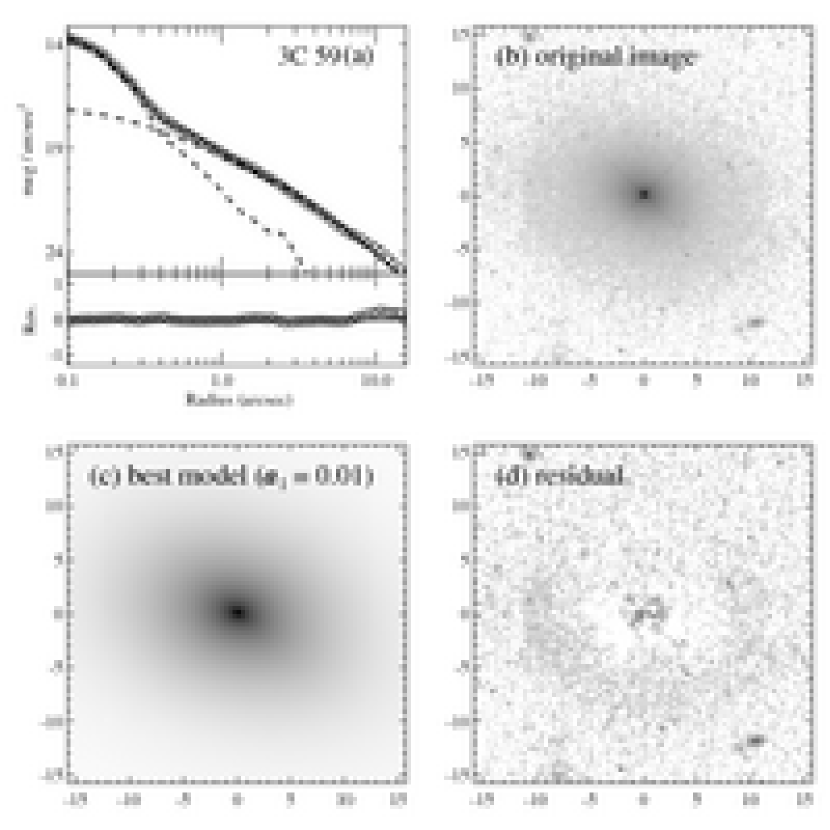
3C 59 (Fig. 12) — The host can be fit with classical bulge represented by a de Vaucouleurs () profile.
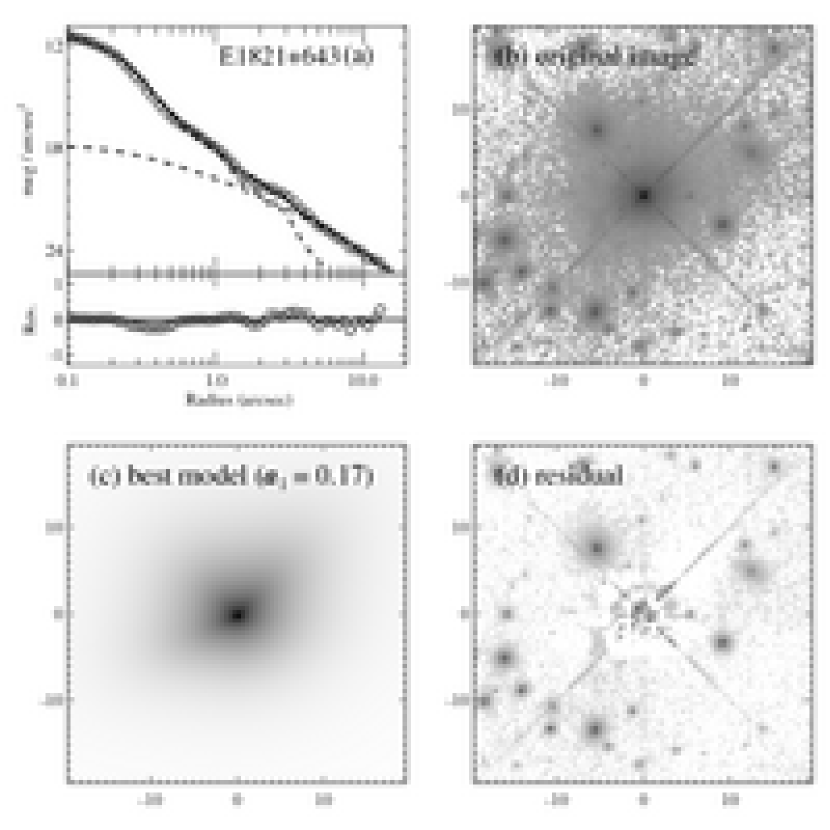
E 1821+643 (Fig. 13) — The best fit shows that the bulge is slightly disturbed (). There is no evidence of a disk.
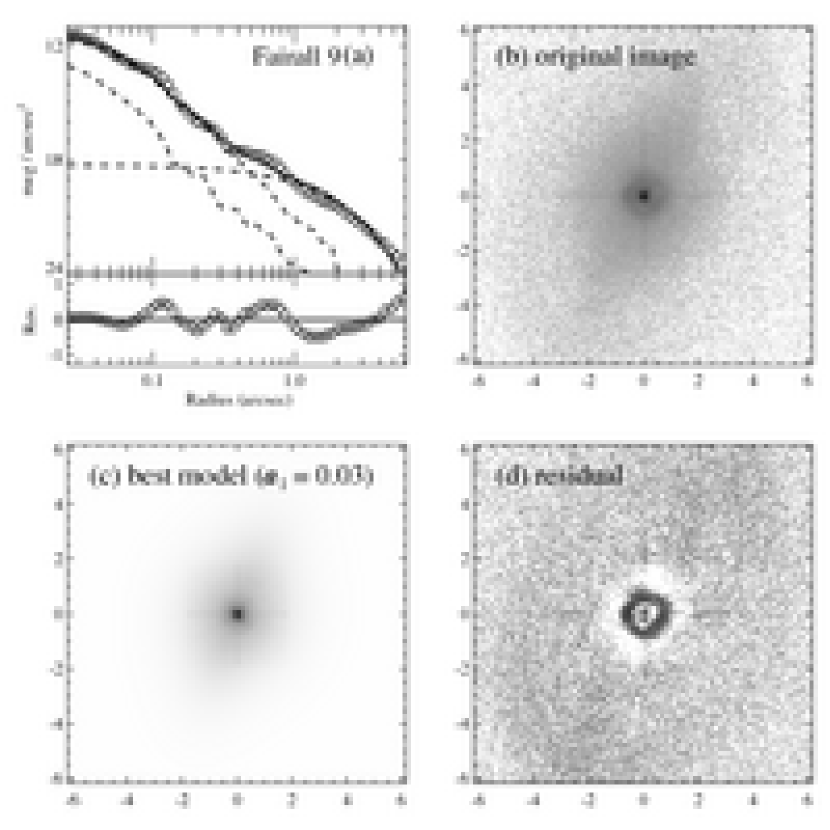
Fairall 9 (Fig. 14) — The host requires a bulge and a disk. A ring-like structure, which we do not model, is also seen in the residuals. The bulge appears be quite compact, with an effective radius of 1.6 pixels, although it is not well decomposed from the nucleus. Thus, the bulge luminosity might be highly uncertain.
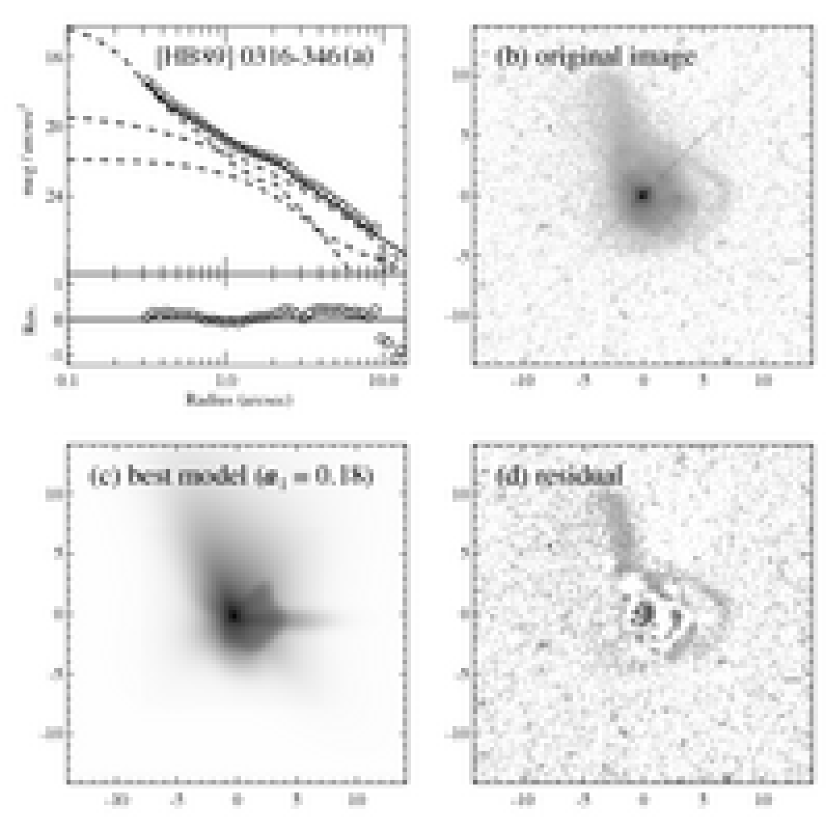
[HB89] 0316346 (Fig. 15) — Highly disturbed object with prominent tidal features. We fit the host with an bulge and two disk components with Fourier modes. One of the disk components is not centered on the nucleus.
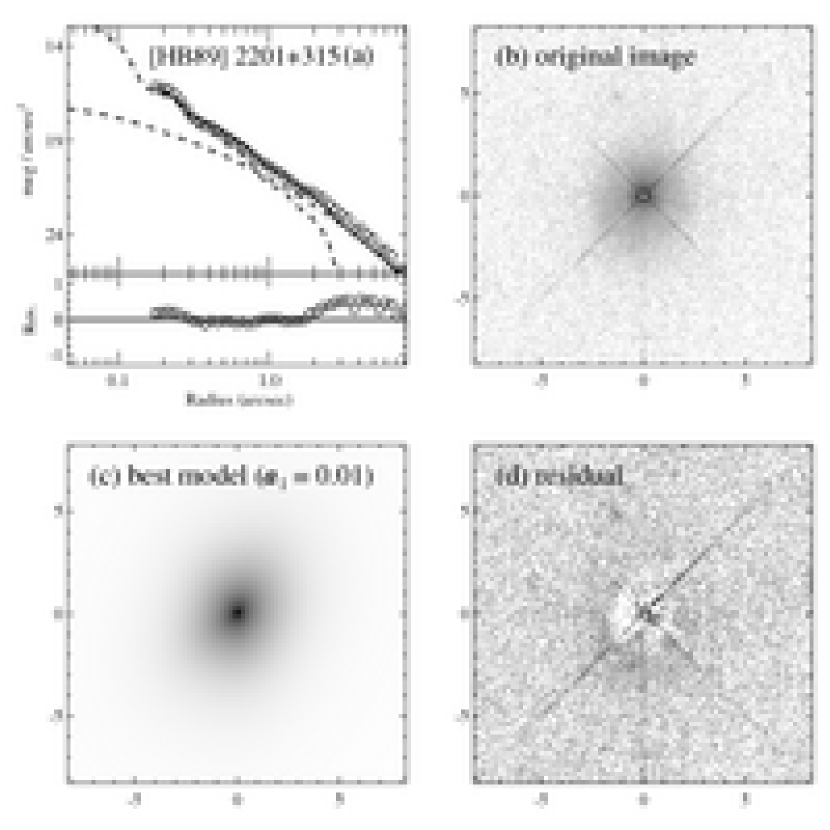
[HB89] 2201315 (Fig. 16) — This object was observed in two different filters (F555W and F702W), but both images are saturated in the core. The bulge luminosities derived from the two different images (corrected to the band) differ by 0.7 mag. We fit the host with a single bulge in both images. The residual image from the long (2700 s) exposure shows possible signs of an extended disk.
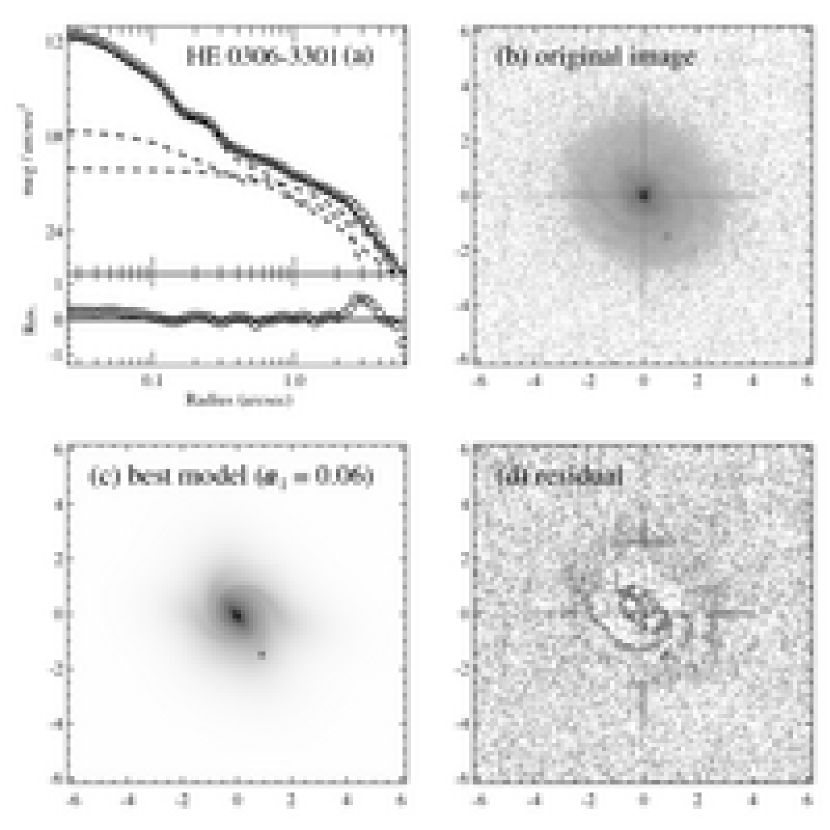
HE 03063301 (Fig. 17) — The best-fit result shows an elongated bulge component () and a disk with a spiral arm. The signal-to-noise ratio (S/N) of the observed PSF star is lower than that of the science image.
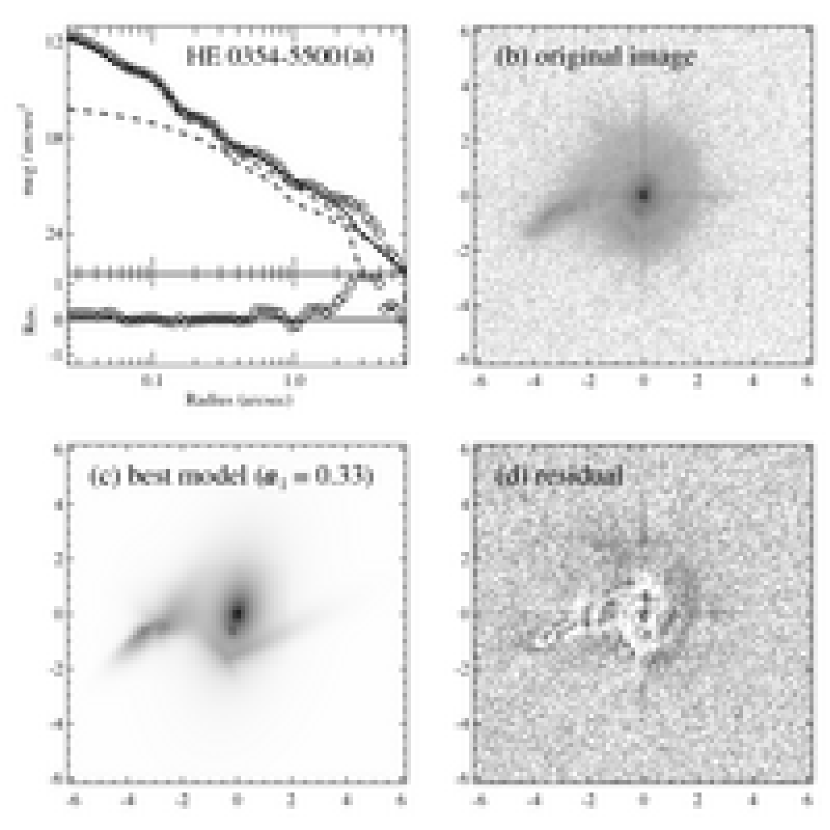
HE 03545500 (Fig. 18) — This appears to be a merging system. We fit the host galaxy with a bulge () and an off-centered tidal-like feature with a high-amplitude Fourier mode (). The S/N of the observed PSF star is lower than that of the science image.
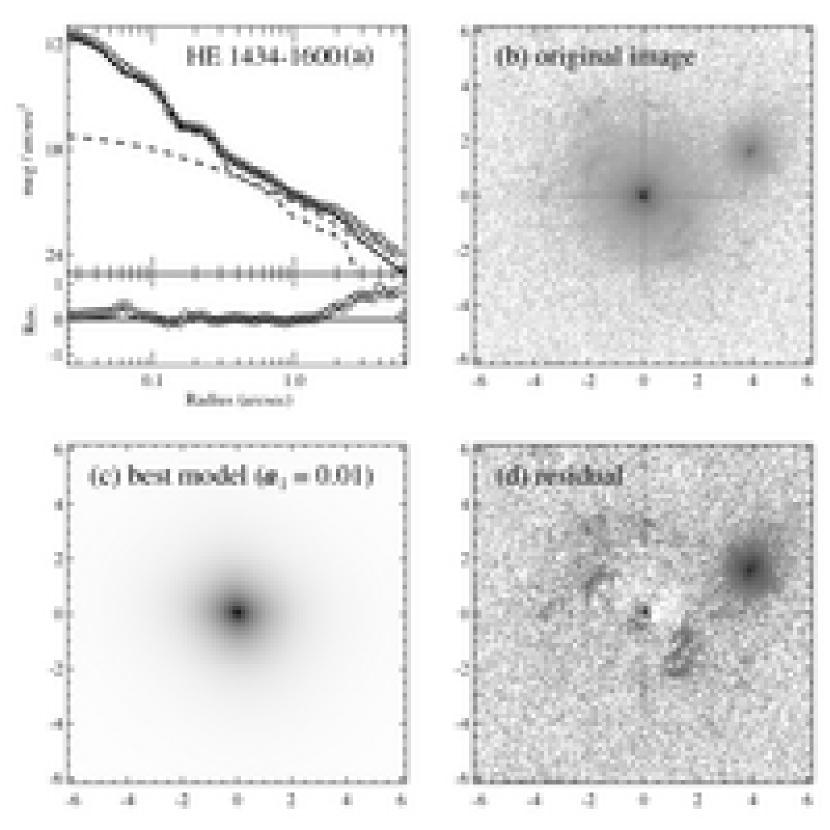
HE 14341600 (Fig. 19) — We fit the host with only a single bulge component ( mag), although the residual image shows evidence for arcs and ripples, which may be evidence of a recent collision (Letawe et al. 2004). Alternatively, if the host is fit with two components, the bulge magnitude becomes 18.6 mag. The S/N of the observed PSF star is lower than that of the science image.
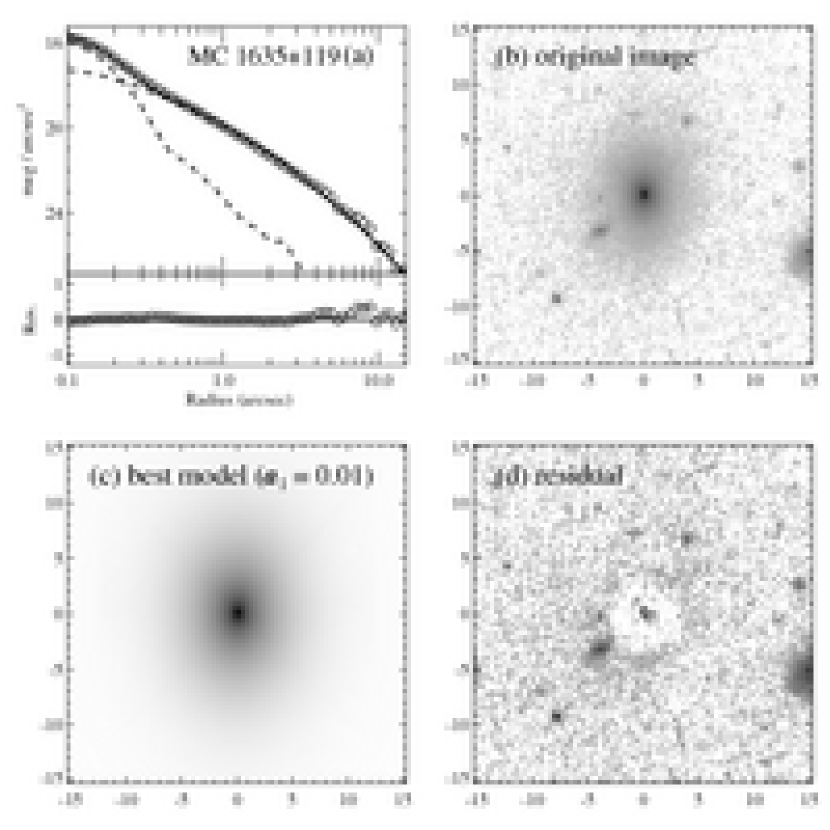
MC 1635+119 (Fig. 20) — We fit the host with a single bulge component ().
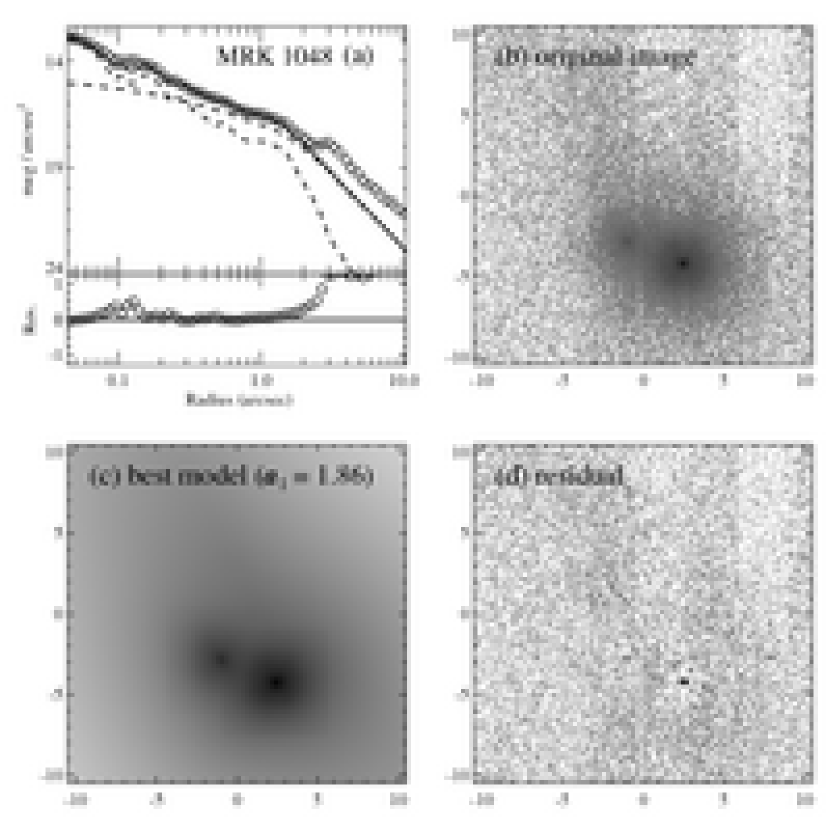
MRK 1048 (Fig. 21) — This object has a close companion and an extremely large but faint, off-center tidal feature. However, neither of these has a large effect on the fitting result. We fit the host with a classical bulge () and a tidal tail.
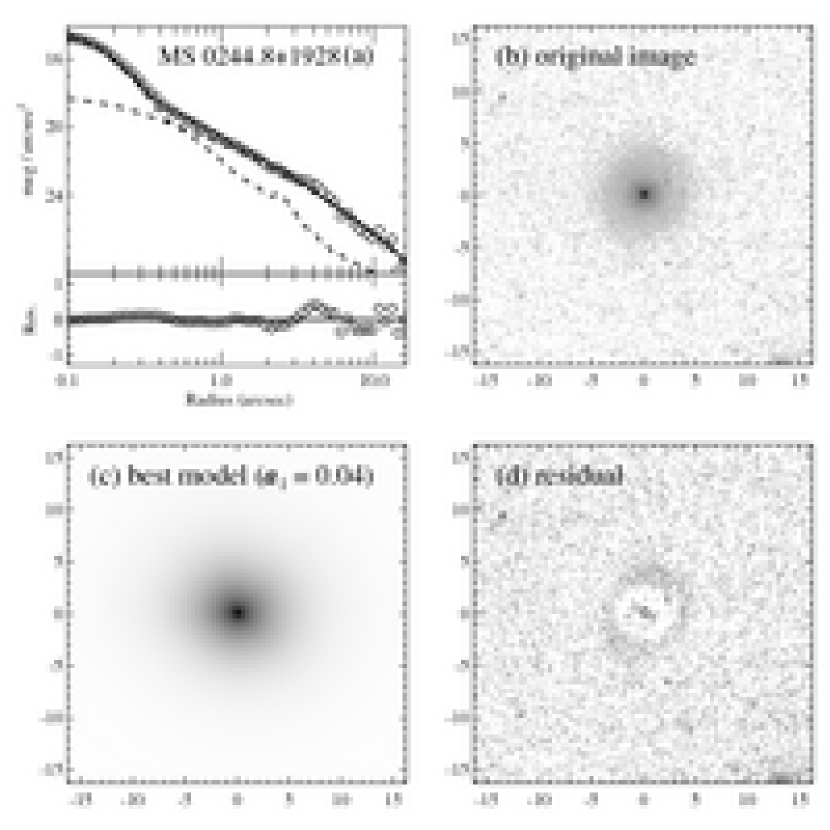
MS 0244.8+1928 (Fig. 22) — The host is reasonably well represented by an = 4 bulge, although the residuals indicate that there might be an additional faint, outer envelope.
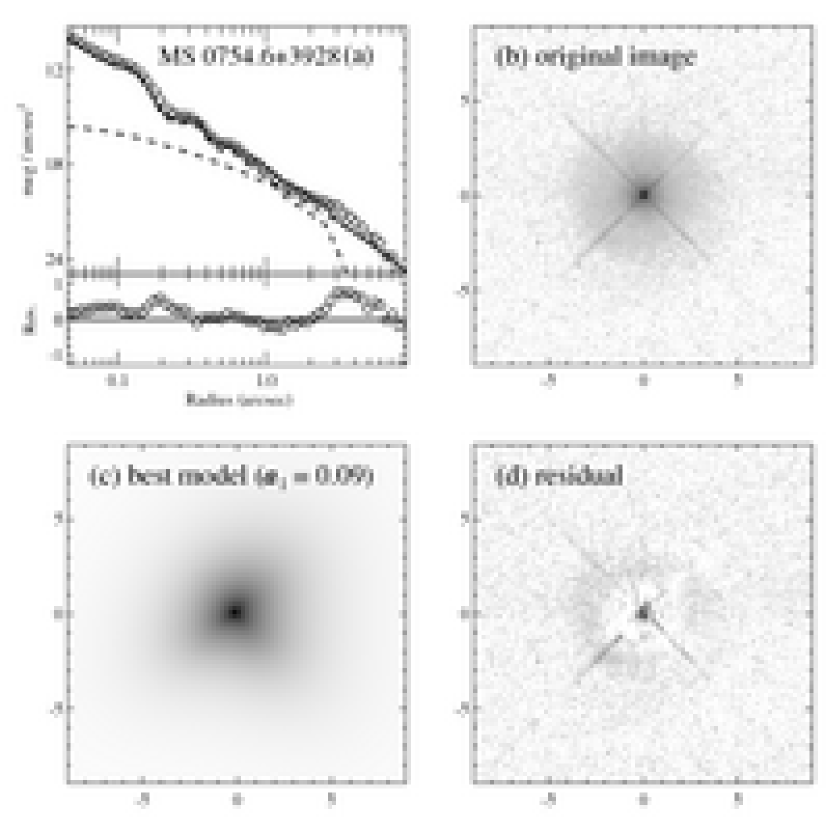
MS 0754.6+3928 (Fig. 23) — The host is reasonably well represented by an = 4 bulge, although the residuals indicate that there might be an additional faint, outer envelope.
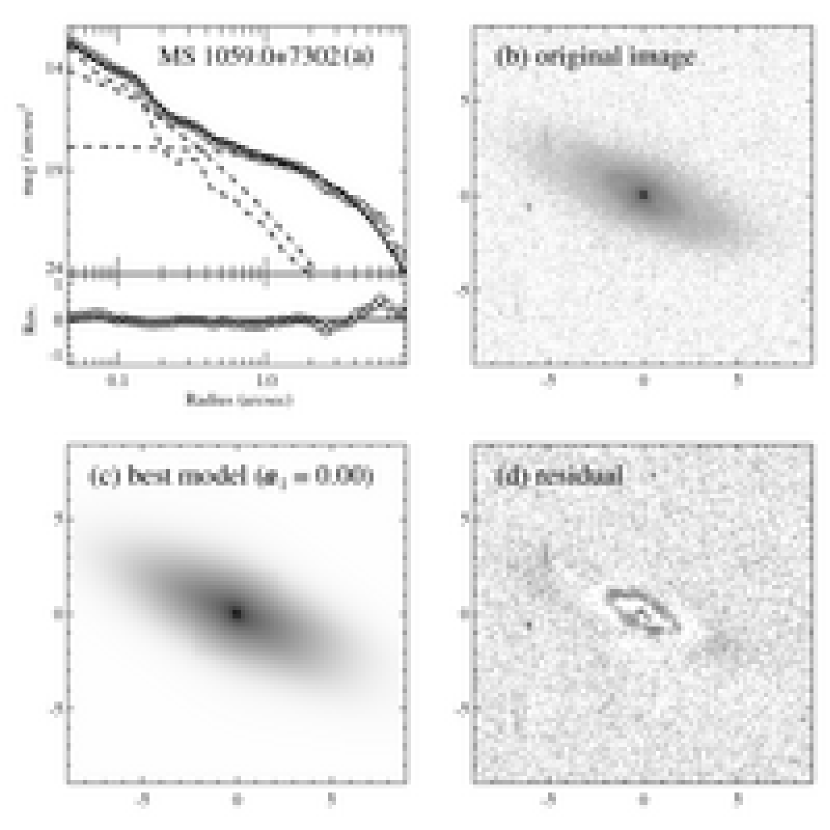
MS 1059.0+7302 (Fig. 24) — The best-fitting model requires a bulge and a disk. There is a ring-like structure in the residual image.
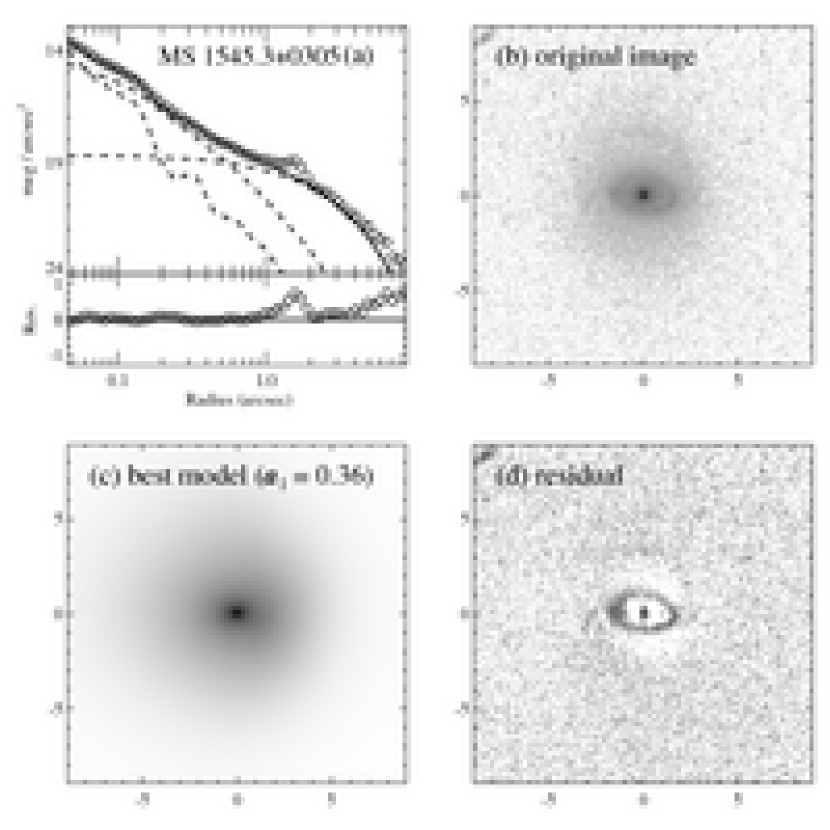
MS 1545.3+0305 (Fig. 25) — The best fit requires a bulge () and a disturbed exponential disk. A ring-like structure is prominent in the original and residual images.
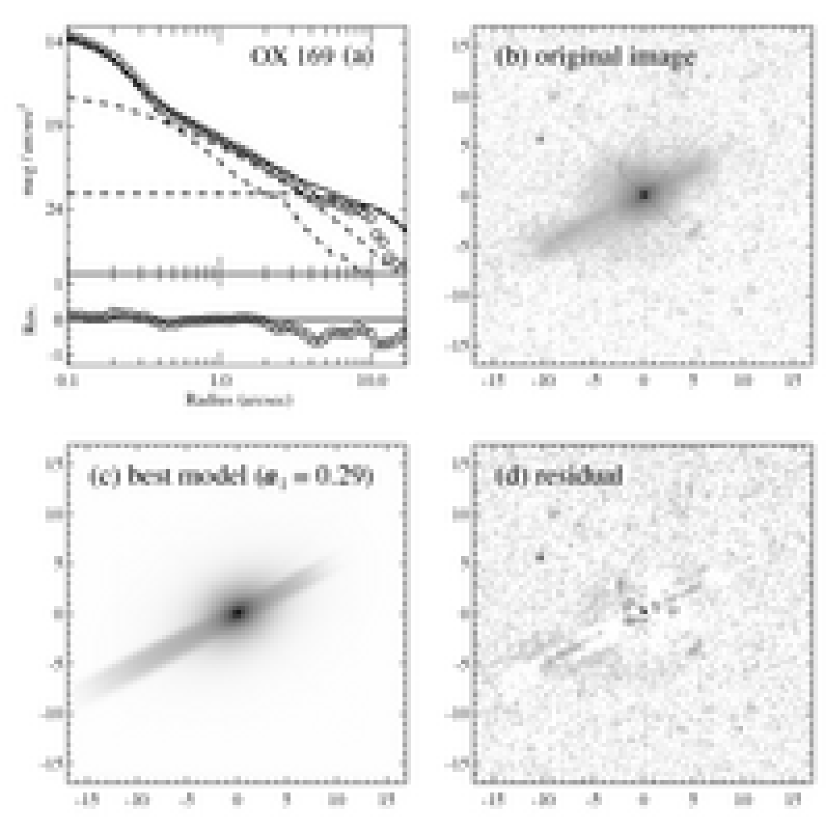
OX 169 (Fig. 26) — There are significant residuals after subtracting the best-fit observed PSF, which might be due to PSF mismatch. The fit with the TinyTim PSF results in a brighter AGN by 0.1 mag. The host contains a bulge () and a prominent, extended, asymmetric structure that is fit with a Sérsic component with a small ().
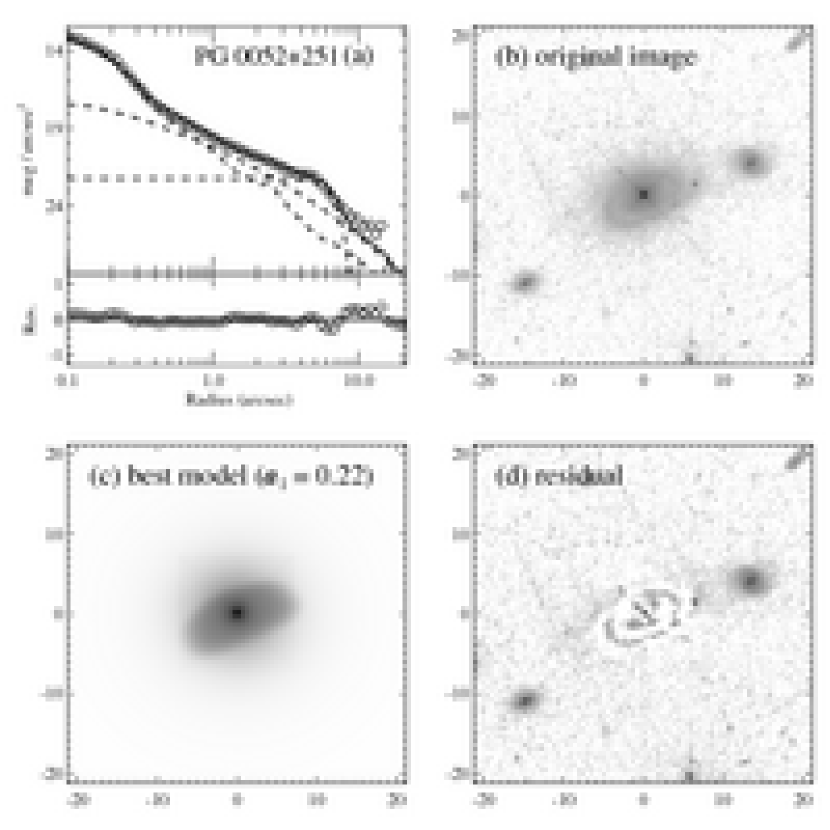
PG 0052+251 (Fig. 27) — It appears to have a tidally disturbed spiral arm, which may be related to the two small galaxies in its vicinity. We fit this object with a classical bulge () and a truncated disk with a small ().
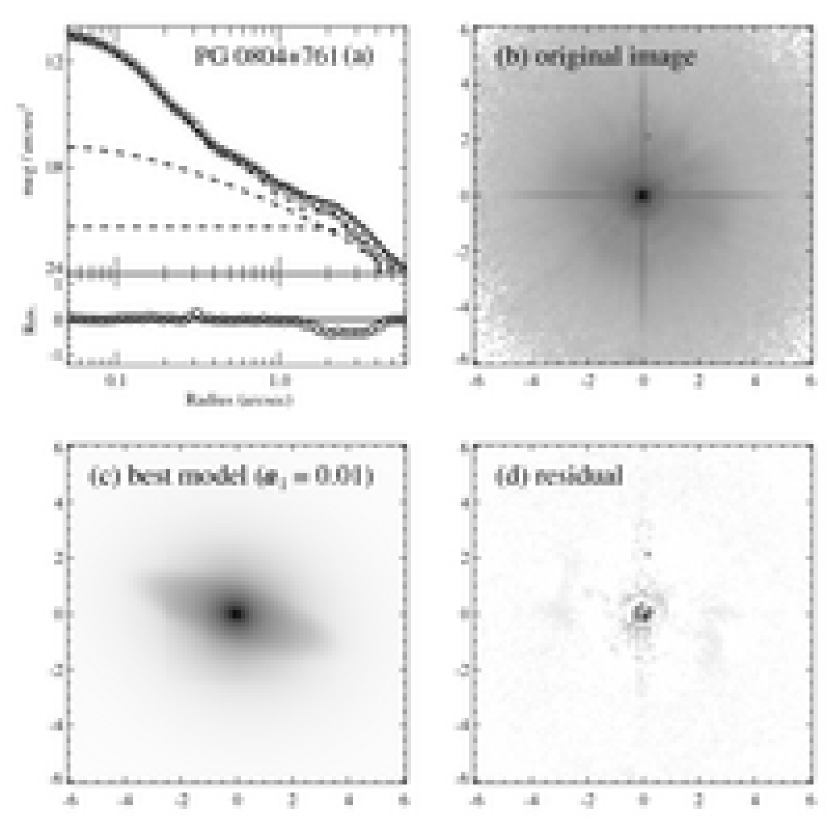
PG 0804+761 (Fig. 28) — There appears to be a faint central feature that resembles a bar or highly inclined disk-like structure. The bulge luminosity, however, is hardly affected by the bar component.
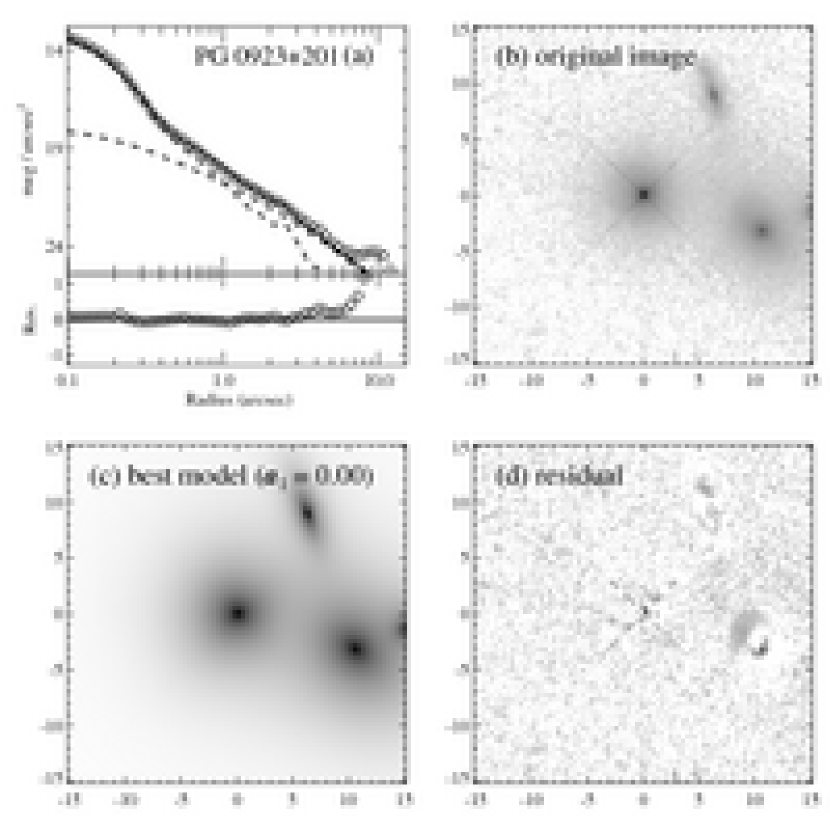
PG 0923+201 (Fig. 29) — The host is fit with a single bulge component (). There are three nearby companions that were fit simultaneously.
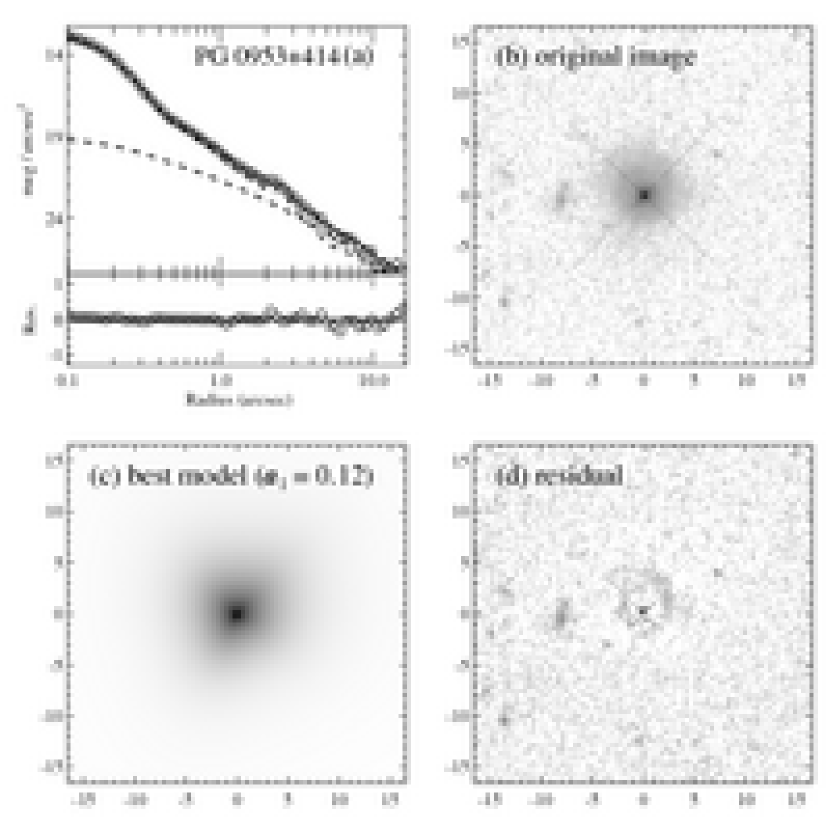
PG 0953+414 (Fig. 30) — The host is fit with a single bulge component (), which appears slightly disturbed based on the amplitude of the Fourier mode ().
PG 1004+130 (Fig. 31) — The host is fit with a single bulge component (). The residual image shows significant PSF mismatch, which might affect the fitting result.
PG 1012+008 (Fig. 32) — The image of the host shows clear evidence of interaction with a spiral galaxy and a smaller, compact neighbor. The primary host can be fit with a single bulge component (), but the residual image shows significant structure.
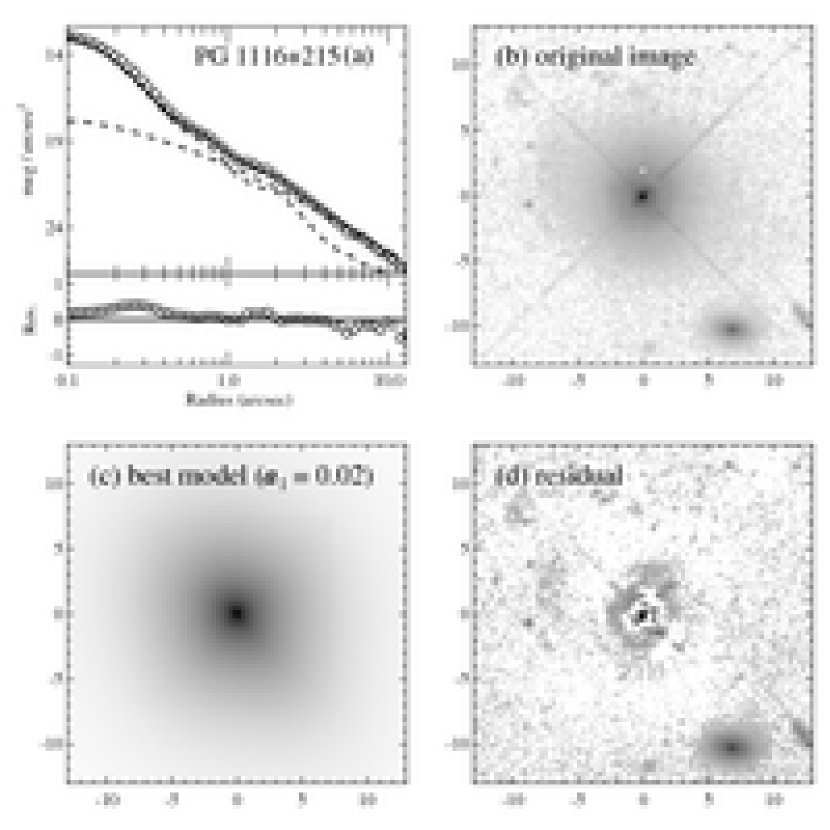
PG 1116+215 (Fig. 33) — The residual image indicates that the central core is slightly affected by PSF mismatch. The host galaxy, however, is well-represented by a single-component bulge with fixed to 4. If we allow to be free, the best-fitting value of yields a bulge luminosity that is 0.3 mag fainter.
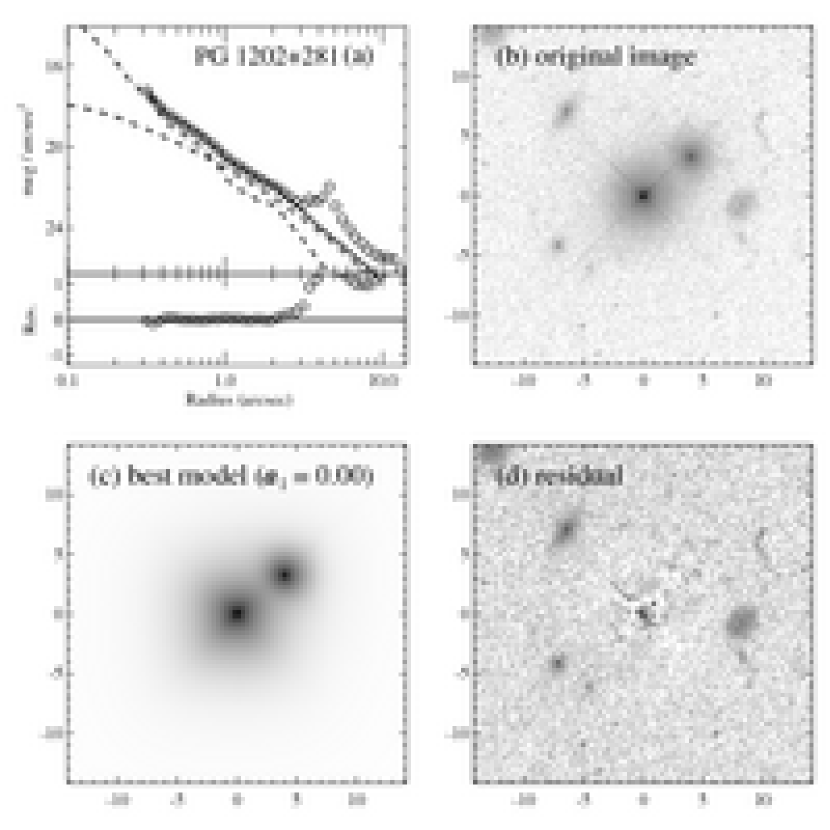
PG 1202+281 (Fig. 34) — This source has a number of nearby galaxies, the brightest and nearest of which we fit simultaneously. The primary host is well described by a single-component bulge ().
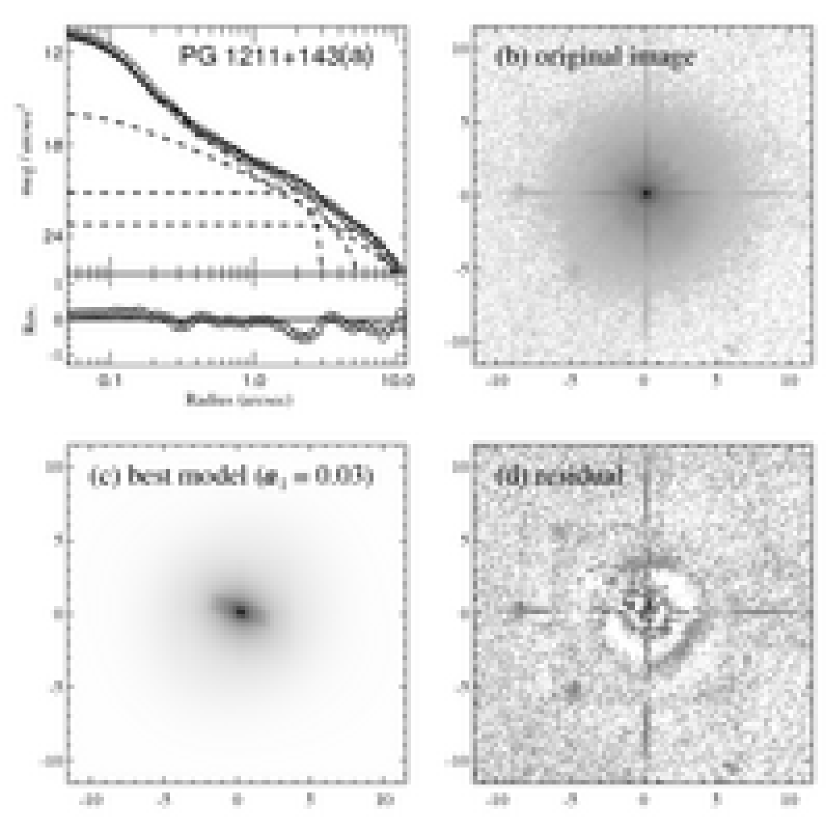
PG 1211+143 (Fig. 35) — Like PG 0804+761, there appears to be a faint central feature that resembles a bar or highly inclined disk-like structure. It is unclear if this is an artifact due to PSF mismatch. Depending on whether this extra component is included, the bulge luminosity ranges between 16.7 and 17.2 mag, with a best-fit value of 16.9 mag.
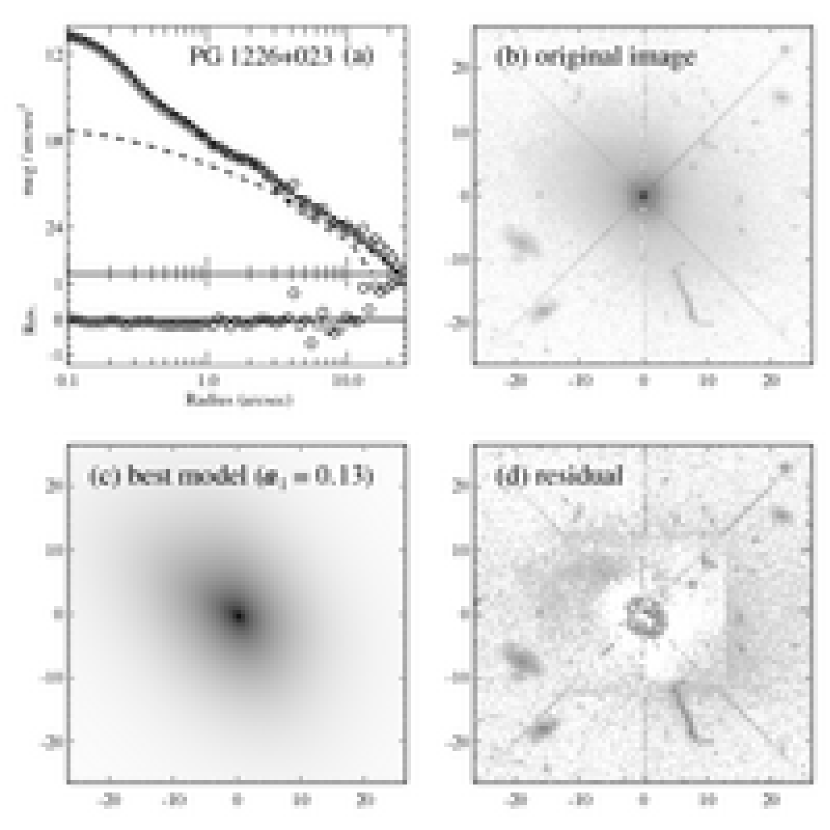
PG 1226+023 (Fig. 36) — Because of the strong bleeding regions from the saturated core, we did not perform nonparametric aperture photometry. The host is reasonably well fit with a single bulge component (). The residual image shows the well-known jet of this source (3C 273), as well as some diffuse, extended emission. The box-like imprint in the residual image results from the PSF image being smaller than the science image.
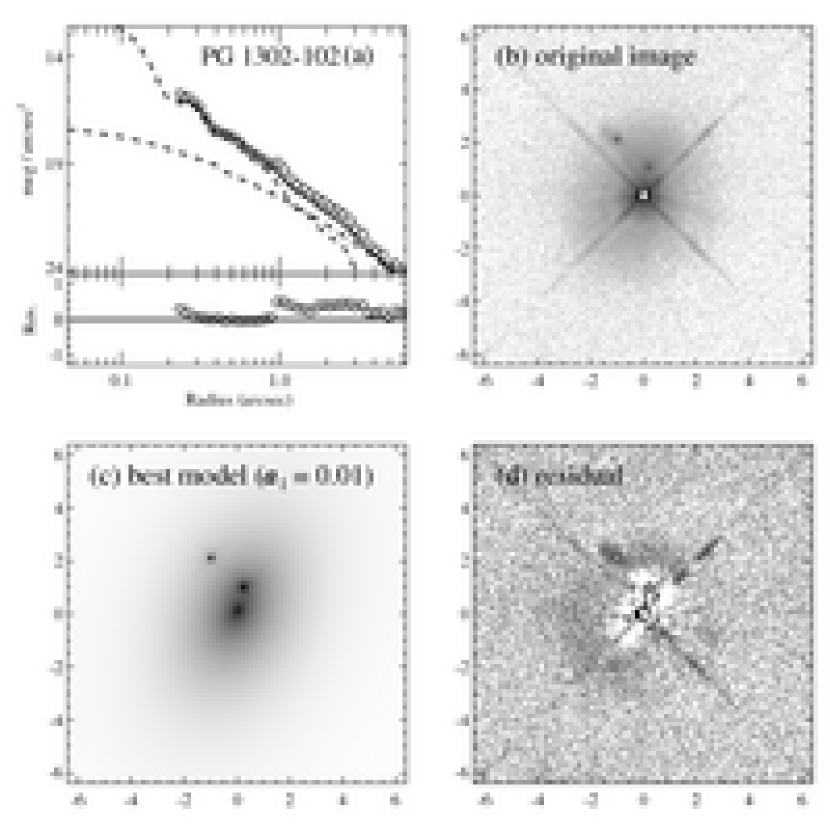
PG 1302102 (Fig. 37) — This object was observed in two different filters (F606W and F702W), but both images are saturated in the core. The image contains two compact sources superposed on the main host, which we fit simultaneously. The host can be fit with a single bulge component, although significant structure on large scales remain in the residual image. The fits from both filters are in good agreement to within the uncertainty.
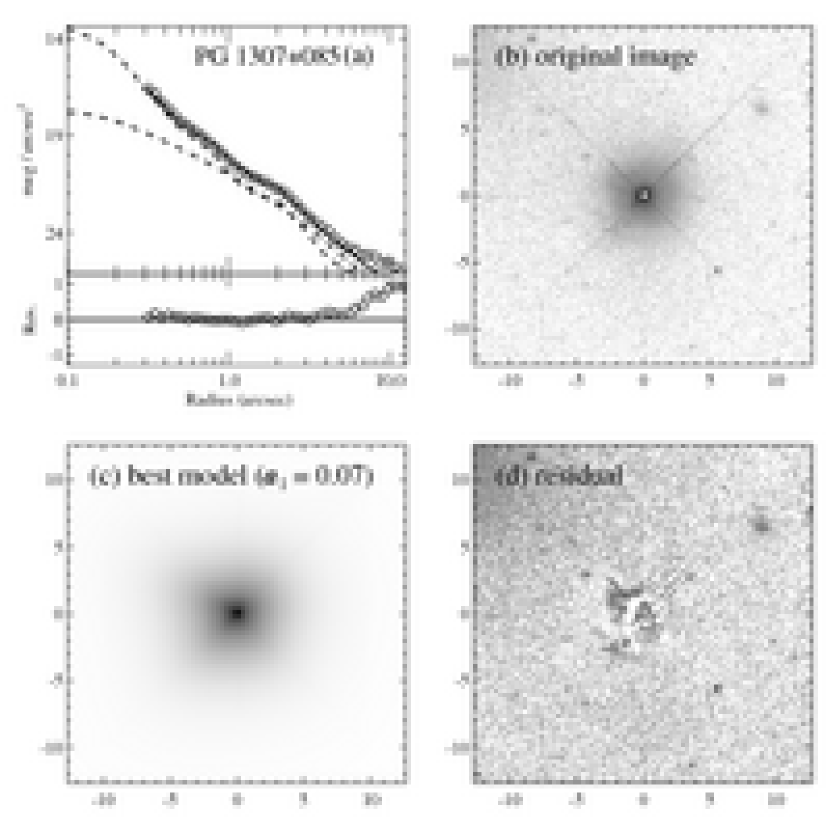
PG 1307+085 (Fig. 38) — Although the core of the image is saturated, the host is well-described by a single bulge component ().
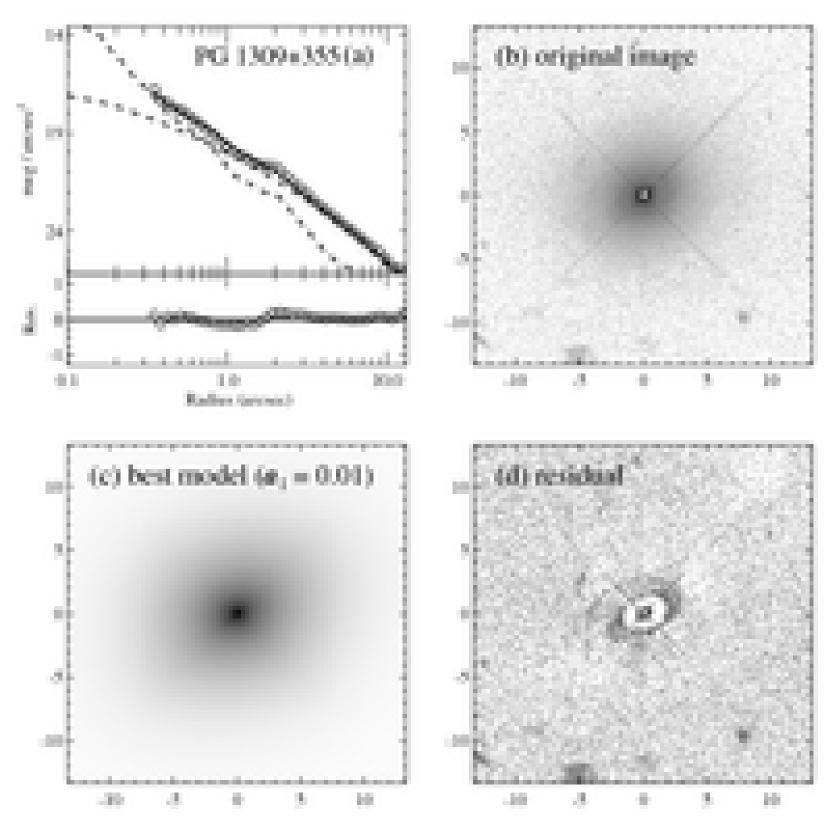
PG 1309+355 (Fig. 39) — The core of the image is saturated. We fit the host with a single bulge component (). The residual image shows evidence of spiral-like substructure, but we did not attempt to model it.
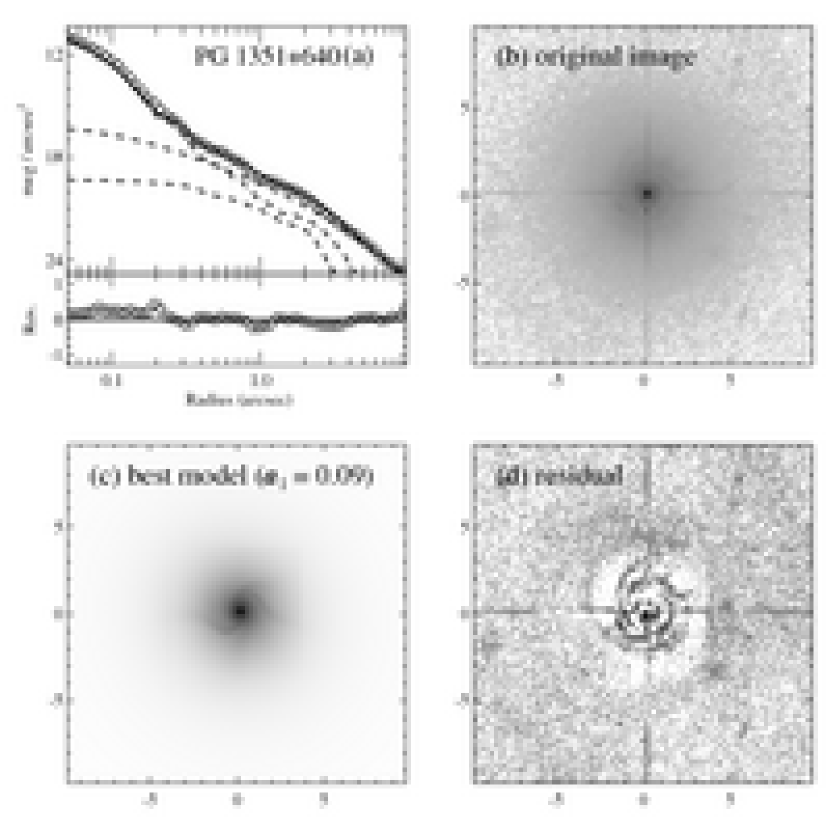
PG 1351+640 (Fig. 40) — This is an almost face-on system with spiral arms. The fit is done with a classical bulge () and an exponential disk.
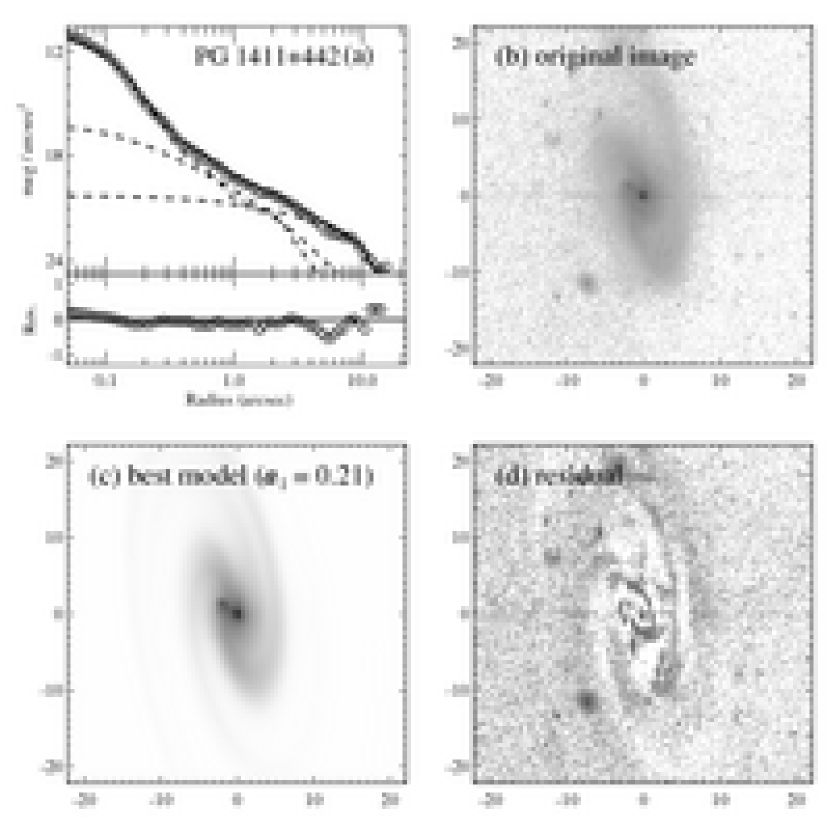
PG 1411+442 (Fig. 41) — This is an extremely disturbed object that appears to have a nearby companion. We fit this object with a classical bulge () and a spiral disk with Fourier modes.
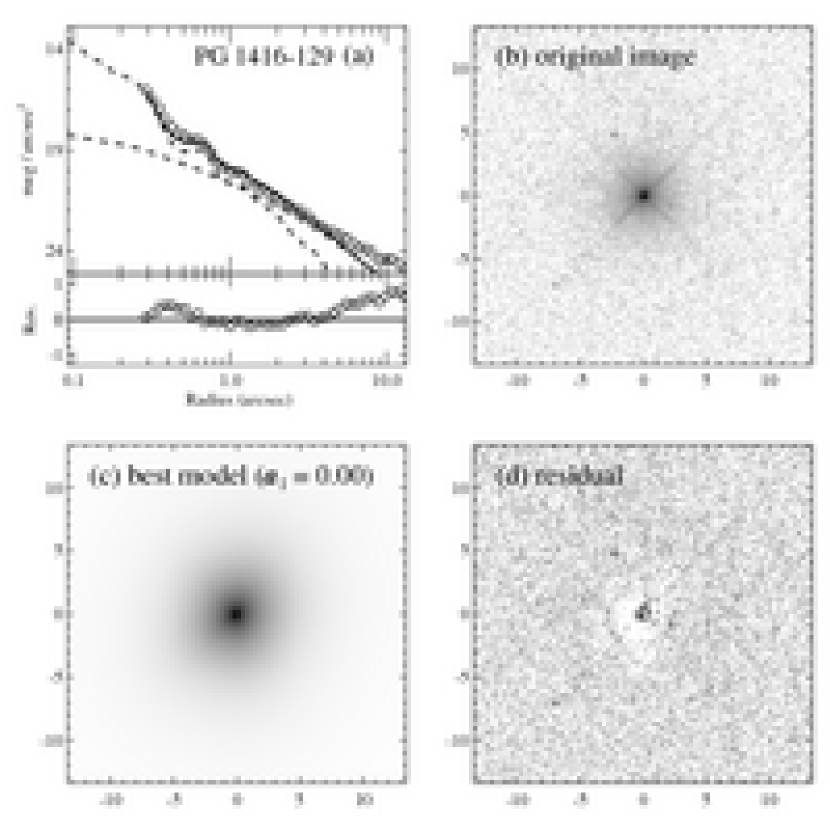
PG 1416129 (Fig. 42) — The host is well-described by a single bulge component ().
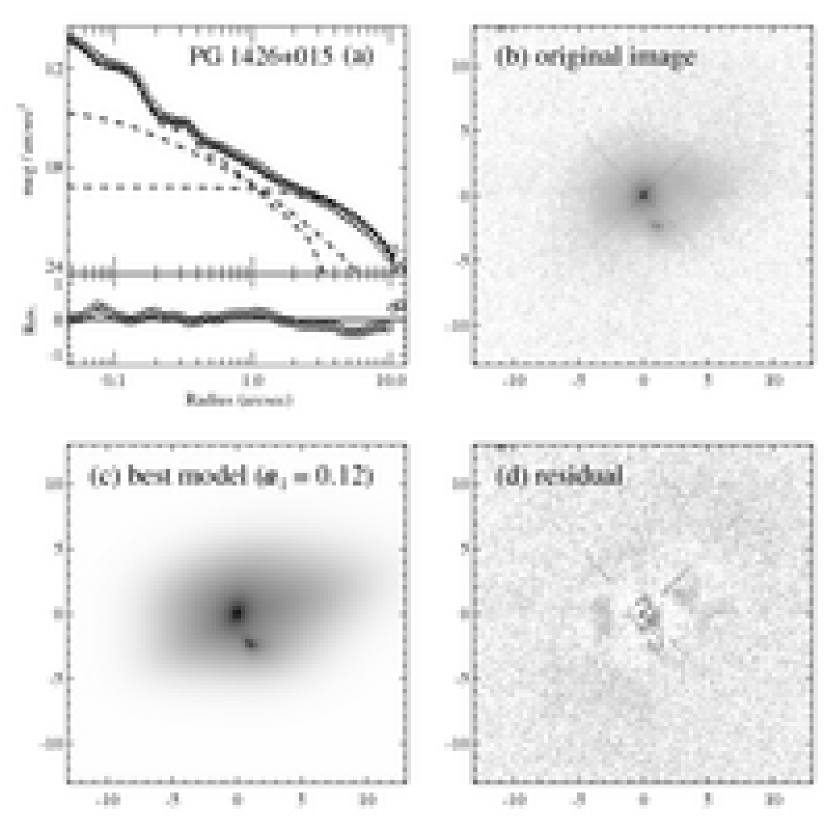
PG 1426+015 (Fig. 43) — This object has a tidal tail and a small companion. The best-fitting model for the host consists of a pseudobulge () and a disk with Fourier modes. Modeling the host with only a single component yields a much brighter bulge (14.2 vs. 16.08 mag), but the residuals of the fit are significantly worse than those of the two-component fit.
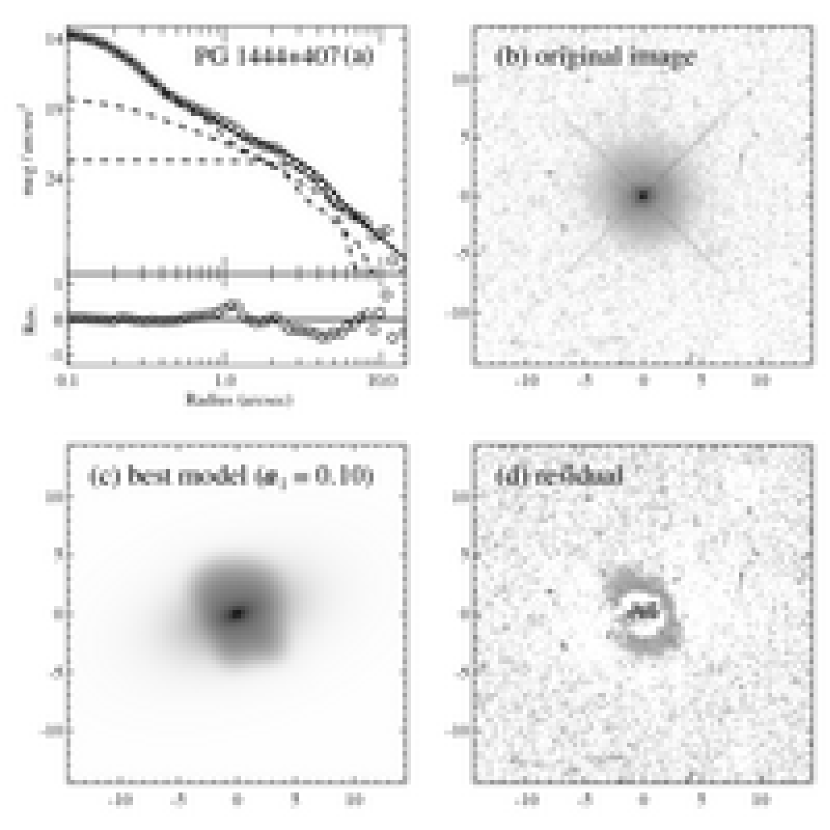
PG 1444+407 (Fig. 44) — The host is fit with a bulge () and a somewhat disturbed disk component (, ). The residuals suggest that a ring-like component might be present.
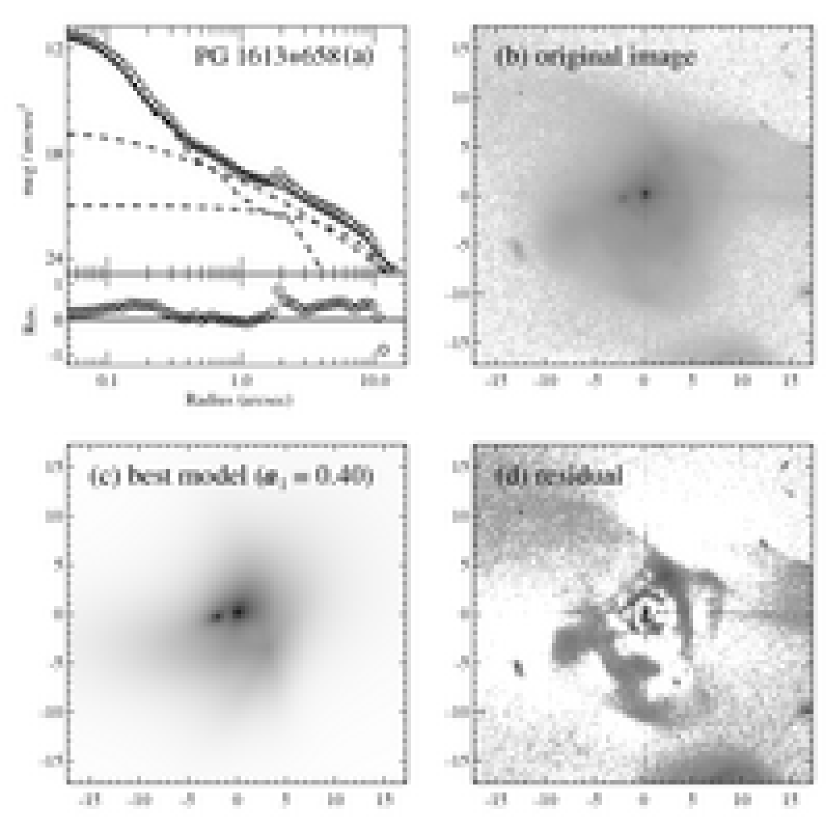
PG 1613+658 (Fig. 45) — This is a highly disturbed object in a merging system. The fit is ambiguous. The best-fitting model for the host consists of a classical bulge () and a disturbed disk () with Fourier modes. The bulge is 0.7 mag fainter than the best-fitting case if the fit is done with a single bulge component (), but the residuals of the fit are significantly worse than those of the two-component fit.
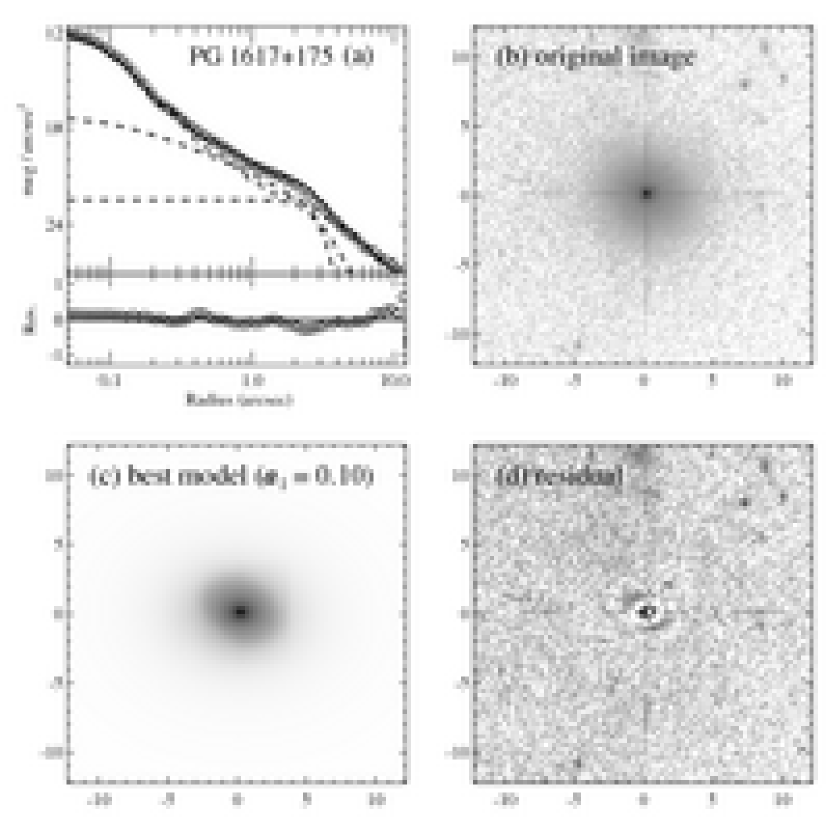
PG 1617+175 (Fig. 46) — Although the best-fitting model for the host contains a bulge and a disk, a single-component model also works reasonably well. In the two-component fits, the bulge luminosities range from 17.7 mag () to 17.9 mag ().
PG 1700+518 (Fig. 47) — The host is well-represented by a single bulge component () plus a tidal tail, which is fit with Fourier modes.
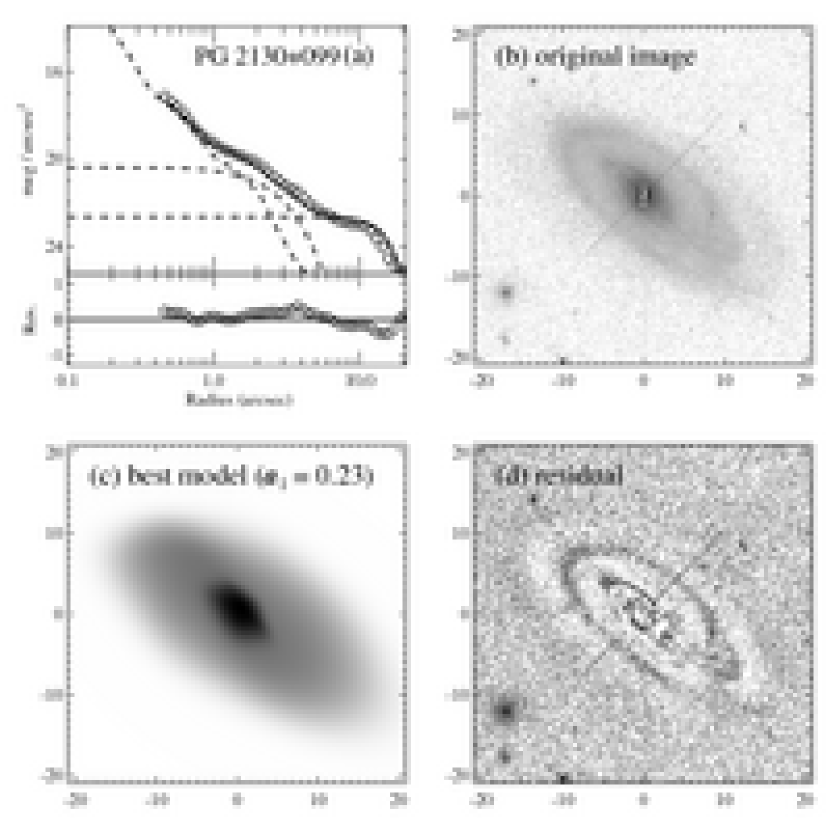
PG 2130+099 (Fig. 48) — This object is very similar to PG 0052+251; both have ring-like spiral disk. Since the central few pixels are saturated, the fit is slightly uncertain. The model for the host consists of a pseudobulge () and a disk () with Fourier modes.
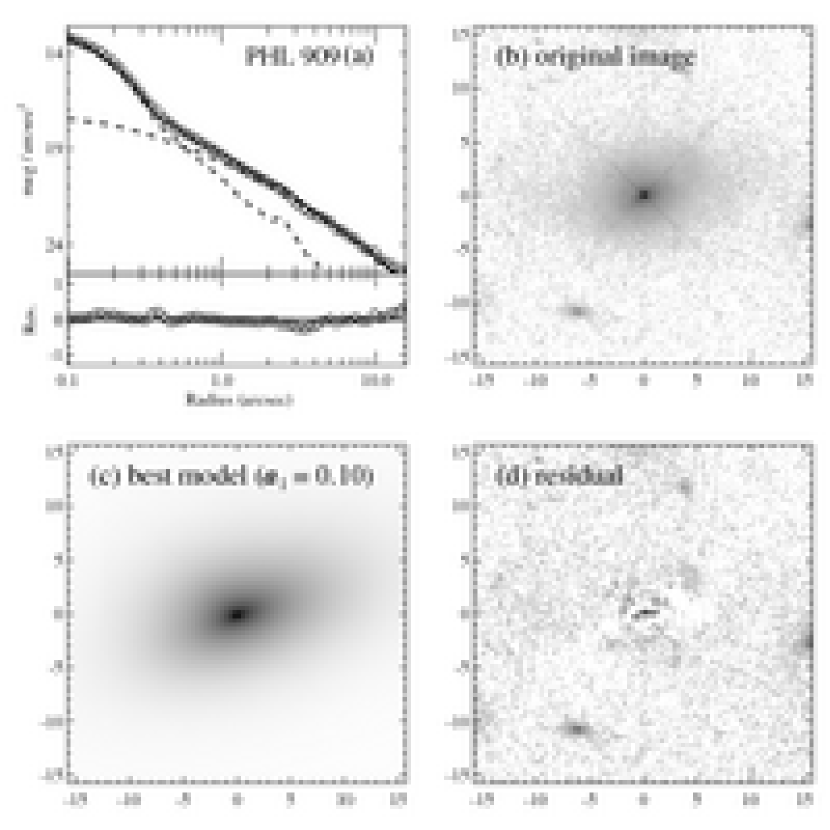
PHL 909 (Fig. 49) — The host is fit with a classical bulge (), but the residual image shows a faint central feature that resembles a tiny bar or highly inclined disk-like structure. The host galaxy is slightly disturbed.
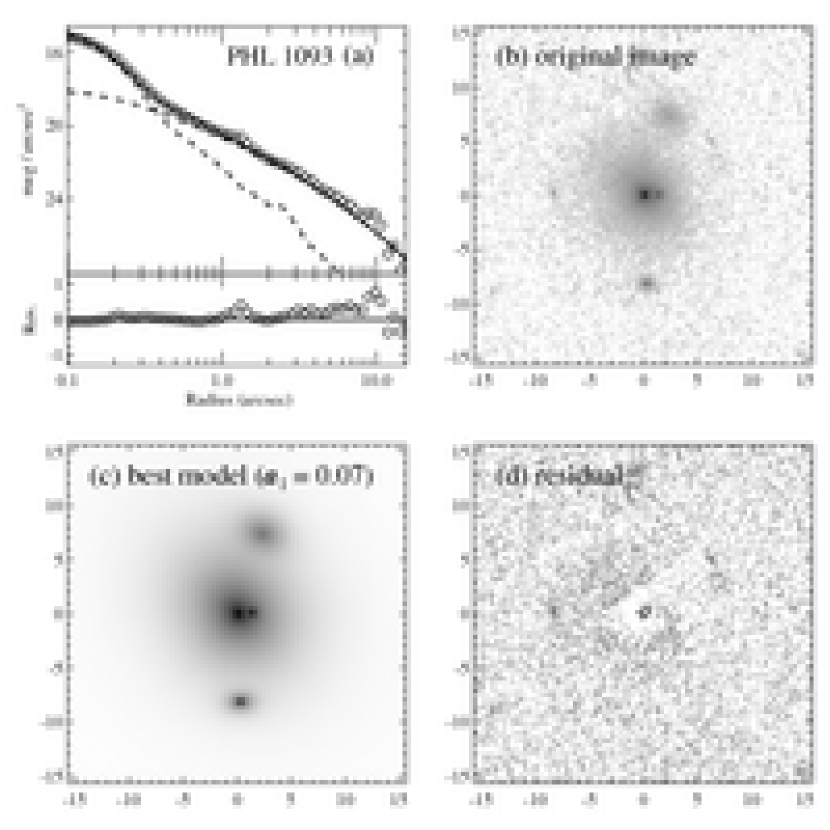
PHL 1093 (Fig. 50) — The host is well fit with a single bulge component (). Three small nearby companions are included in the fit simultaneously.
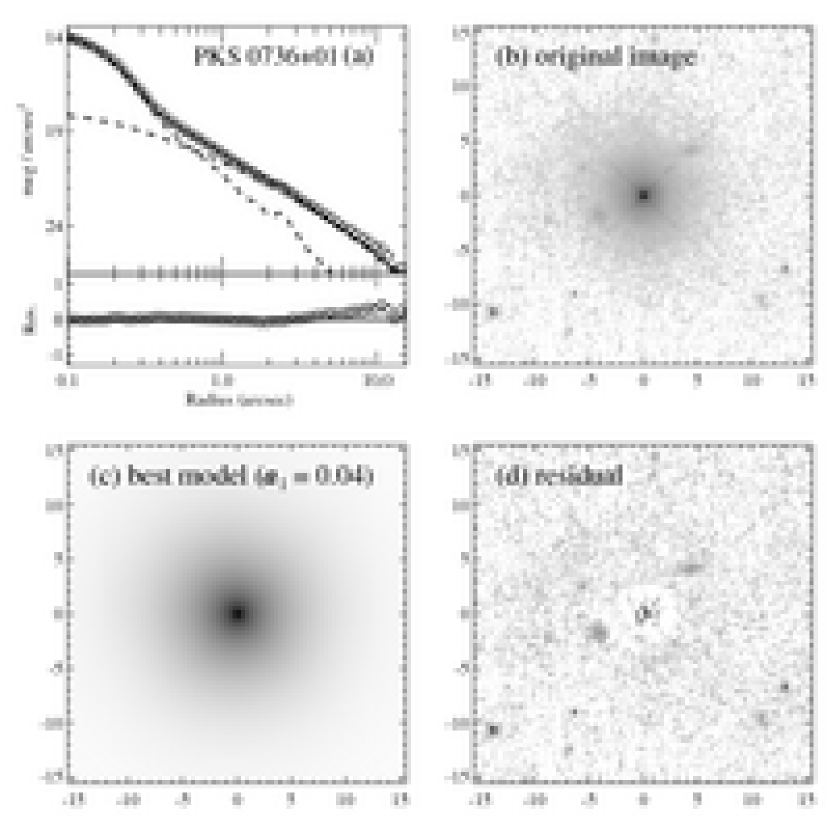
PKS 0736+01 (Fig. 51) — The host is well fit with a single bulge component (). There are several faint blobs nearby, but it is unclear whether these are associated with the primary host.
PKS 1020103 (Fig. 52) — A single bulge component () is enough to describe the host.
PKS 1217+02 (Fig. 53) — The host is well fit with a single bulge component ().
PKS 213514 (Fig. 54) — We fit the host with a single bulge component (). Two nearby objects are included simultaneously in the fit.
PKS 234901 (Fig. 55) — There are two curved tidal tails. The best-fit model for the host consists of a classical bulge () and a highly distorted disk with .
PKS 2355082 (Fig. 56) — The host is well fit with a single bulge component ().