Stellar disks of Collisional Ring Galaxies I. New multiband images, Radial intensity and color profiles, and confrontation with N-body simulations
Abstract
We present new multi-band imaging data in the optical ( and H) and near infrared bands () of 15 candidate ring galaxies from the sample of Appleton & Struck-Marcell (1987). We use these data to obtain color composite images, global magnitudes and colors of both the ring galaxy and its companion(s), and radial profiles of intensity and colors. We find that only nine of the observed galaxies have multi-band morphologies expected for the classical collisional scenario of ring formation, indicating the high degree of contamination of the ring galaxy sample by galaxies without a clear ring morphology. The radial intensity profiles, obtained by masking the off-centered nucleus, peak at the position of the ring, with the profiles in the continuum bands broader than that in the H line. The images as well as the radial intensity and color profiles clearly demonstrate the existence of the pre-collisional stellar disk outside the star-forming ring, which is in general bluer than the disk internal to the ring. The stellar disk seems to have retained its size, with the disk outside the ring having a shorter exponential scale length as compared to the values expected in normal spiral galaxies of comparable masses. The rings in our sample of galaxies are found to be located preferentially at around half-way through the stellar disk. The most likely reason for this preference is bias against detecting rings when they are close to the center (they would be confused with the resonant rings), and at the edge of the disk the gas surface density may be below the critical density required for star formation. Most of the observed characteristics point to relatively recent collisions ( Myr ago) according to the N-body simulations of Gerber et al. (1996).
Subject headings:
galaxies: photometry — galaxies: interactions1. Introduction
Ring galaxies are a class of objects whose optical appearance is dominated by a ring or a ring-like structure. In one of the earliest discussions of ring galaxies, Burbidge & Burbidge (1959) suggested that these objects may be the aftermath of a close collision between an elliptical and spiral galaxy. On the other hand, Freeman & de Vaucouleurs (1974) suggested that the ring is probably the result of a collision between a spiral galaxy and an intergalactic cloud of Hi. Theys & Spiegel (1976, 1977) systematically studied the basic observational properties of a sample of ring galaxies and suggested that rings are formed when an intruding galaxy passes nearly through the center of a normal disk galaxy. Lynds & Toomre (1976) used numerical simulations and settled the issue regarding their origin. They demonstrated that ring galaxies are formed as a result of an on-axis collision between an intruder galaxy and a gas-rich disk-galaxy. In this scenario, the collision sets off an expanding ring wave, which in turn triggers star formation in its wake. Due to the expanding nature of the wave, the ring of star formation also advances successively to larger radii with time. This scenario has stood the test of the multi-band data those have become available since then (Appleton & Struck-Marcell 1996 and references therein).
Many of the predictions from theoretical models have been tested observationally in the Cartwheel, the prototype ring galaxy. The ring in this galaxy is expanding (Fosbury & Hawarden, 1977), and is forming massive stars (Higdon, 1995). A radial color gradient was also noticed by Marcum et al. (1992), which was found to be in agreement with the sequential ordering of stellar ages (Korchagin et al., 2001; Vorobyov & Bizyaev, 2001). Appleton & Marston (1997) established the color gradient in some other ring galaxies. Marston & Appleton (1995) carried out H imaging observations of eight ring galaxies and found that majority of the star-forming regions are located exclusively in the ring.
In the collisional scenario proposed by Lynds & Toomre (1976), a stellar density wave is set off as the collective response of the stars that were present in the pre-collisional disk of the target galaxy. However, we know very little about the underlying stellar disk of the target galaxy. It is generally believed that the observed rings, especially in the near infrared continuum bands, trace the location of the stellar density waves. The stellar disk outside the ring should carry important information on the nature of the pre-collisional disk. However, such a disk has not been traced even in the Cartwheel. Appleton & Marston (1997) tried to infer an outer disk using radial profiles of surface brightness and color in four galaxies, and found such a disk in two cases (IIHz4 and VIIZw466). Their images were not deep enough to study the azimuthal structure of the outer disks.
Korchagin et al. (2001) have developed a method to estimate the contribution of the newly formed stars in different wavelength bands as the density wave expands in the target galaxy. The density wave in the underlying stellar disk can be recovered by subtracting the contribution of the newly formed stars. Availability of H and continuum images are fundamental in achieving this objective. The continuum images should reach at least 2 magnitudes deeper than the brightness of the ring in order to register the stellar disk on either side of the star-forming ring. With this goal in mind, we carried out new imaging observations of a sample of 15 candidate ring galaxies in the broad bands and in the emission line of H. Some of the candidate galaxies may not have formed by the scenario proposed by Lynds & Toomre (1976), and these galaxies were included in our observing list with the hope that the new observations would allow us to filter out contaminating galaxies. The data and detailed surface photometric analysis of all sample galaxies are presented in this paper. In a forthcoming paper (Paper II), we will discuss the results obtained from the extraction of the underlying stellar density wave in galaxies that are most likely formed by the classical collisional scenario.
Sample and the details of our observations are discussed in § 2. Morphological descriptions and one dimensional profiles of individual galaxies are presented in § 3. In § 4, we compare the photometric properties of ring galaxies with that of normal galaxies. Results obtained from the new data are discussed in the context of N-body simulations in § 5. Conclusions from our study are presented in § 6. Gray scale maps in the H and -bands and one dimensional surface brightness and color profiles for each galaxy are presented in the Appendix. Throughout this paper, all distance scaling assumes a value for the Hubble Constant of 75 km s-1 Mpc-1.
2. Observations and Reductions
Ring galaxies from the sample of Appleton & Struck-Marcell (1987) were selected for optical and NIR photometric study. A total of 15 galaxies that were north of declination were observed in the broad bands and in the emission line of H. The sample galaxies are listed in Table 1. The equatorial coordinates, radial velocities (V0), ring diameters and total -band magnitudes in the table were taken from Appleton & Struck-Marcell (1987).
Three of our program galaxies (IIZw28, IIHz4 and VIIZw466) were common with the and H imaging study by Appleton & Marston (1997) and Marston & Appleton (1995), while three other galaxies (Arp143, NGC985 and NGC5410) were mapped in H by Higdon et al. (1997), Rodriguez-Espinosa & Stanga (1990) and Marston & Appleton (1995), respectively. For the remaining galaxies, the present study is the first attempt in obtaining uniform multi-band digital quality images. Our images reach surface brightness levels of mag arcsec-2 (3–4) in the -band and 0.2–2 erg s-1 cm-2 arcsec-2 (5) in the H band.
2.1. Optical imaging in the and H bands
All optical observations were carried out with the Observatorio Astrofísico Guillermo Haro 2.1-m telescope at Cananea, Mexico. We used a Tektronics CCD of pixel format at the Cassegrain focus of the telescope with pixel binning, resulting in an image of pixel-1 and a field of view of .
Table 2 contains a detailed log of the observations. The observing runs for each galaxy are given in column 2, followed by the exposure times in the broadband filters. These broadband filters correspond to the standard Johnson-Cousins system. The central wavelength of the H filter for each galaxy is given in column 7, followed by a column containing the exposure times in these filters. The H filters were of square-shape with typically a width of 100Å, and include both the [Nii] lines flanking the H. For five galaxies, observations were carried out in emission-line free narrow bands to facilitate subtraction of the in-band continuum from the H-filter images. The central wavelength of the off-band continuum filters used for these galaxies are given in column 9. For the rest of the galaxies, the -band images were used for the purpose of continuum subtraction. Twilight sky exposures were taken for flat-fielding purposes. Several bias frames were obtained at the start and end of each night.
2.2. Near infrared imaging
All near infrared observations were carried out in the and bands with the Observatorio Astronomico Nacional 2.1-m telescope at San Pedro Martir, Mexico. The CAMILA instrument (Cruz-Gonzalez et al., 1994), that hosts a NICMOS 3 detector of 256256 pixel format, was used in the imaging mode with the focal reducer configuration . This results in a spatial sampling of pixel-1 and a total field of view of . Each observation consisted of a sequence of object and sky exposures, with the integration time of an individual exposure limited by the sky counts, which was kept well below the non-linear regime of the detector. A typical image sequence consisted of 10 exposures, six on the object and four on the sky. NIR observations could not be carried out for three of the sample galaxies. Though of lesser sensitivity, we used the 2MASS111This publication makes use of data products from the Two Micron All Sky Survey, which is a joint project of the University of Massachusetts and the Infrared Processing and Analysis Center/California Institute of Technology, funded by the National Aeronautics and Space Administration and the National Science Foundation. images of these three galaxies for the sake of completeness. A series of twilight and night-sky images were taken for flat-fielding purposes. Observing runs and exposure times in the bands are given in the last 4 columns of Table 2.
The sky conditions for both optical and NIR observations were generally photometric and the seeing FWHM was in the range 1–2 on different nights. Typical sky brightness was 21.14, 20.72, 20.18 and 12.27 magnitude arcsec-2 in the and bands, respectively. The sky brightness in the band also includes the background emitted by the warm optics.
2.3. Image data reduction and Calibration
The technique used to carry out the image data reduction and calibration is the same as that followed for the analysis of a sample of lenticular galaxies observed during the same runs as the present observations (Barway et al., 2005). The basic data reduction for both the optical and NIR images involved subtraction of the bias and sky frames, division by flat field frames, registration of the images to a common coordinate system and then stacking all the images of a given galaxy in each filter. Night-to-night variations of the optical bias frames were negligible, and hence bias frames of an entire run were stacked together using the median algorithm to form a master bias frame, which was then subtracted from all object frames. Preparation of the optical flat fields followed the conventional technique, wherein bias subtracted flats were stacked and the resultant frame was normalized to the mean value in a pre-selected box near the center of the frame, to form a master flat in each filter. Bias subtracted images of the program galaxies were divided by the normalized flat field in the corresponding filter. The optical images suffered from a stray light problem that resulted in a gradient in the sky background, which roughly ran through one of the diagonals of the CCD chip. The gradient was found to be stable throughout each run and the mean counts scaled linearly with exposure time. After several experiments, we found that the best way to get rid of the gradient was to subtract a mean blank sky image from the data images. For this purpose, special blank fields were observed in each filter with exposure times matching the typical exposure times of the object frames. The adopted procedure eliminated any systematic gradient in the sky background, but still resulted in non-negligible residual sky values, which were taken into account in the error estimation (see § 2.5).
For the images, a bias frame taken immediately before an object exposure was subtracted as part of the data acquisition. A master NIR flat field in each filter for each night of observing was prepared as follows. The night-sky flats were first stacked and then subtracted from stacked twilight flats. The frames obtained in this fashion for each run were then combined and normalized to the mean value of the resultant frame to form a master flat. The sky frames of each sequence of observations were combined and the resultant image was subtracted from each of the object frames to get a sky-subtracted image. Flat fielding was done by dividing the sky subtracted images of the object by the normalized master flat. The resulting images were aligned to a common co-ordinate system using common stars in the frames and then combined using the median operation. Only good images (as defined in the CAMILA manual — see Cruz-Gonzalez et al. (1994)) were used in the combination. The resulting combined images were aligned to corresponding images from the Digitized Sky Survey (DSS). As a final step of the reduction procedure, the mutually aligned optical images were aligned to the NIR image coordinate system. The transformed star positions in the images agreed to within as judged from the coordinates of common stars.
All image reductions were carried out using the Image Reduction and Analysis Facility (IRAF222IRAF is distributed by National Optical Astronomy Observatories, which are operated by the Association of Universities for Research in Astronomy, Inc., under cooperative agreement with the National Science Foundation.) and the Space Telescope Science Data Analysis System (STSDAS).
2.4. Photometric calibration
Dipper Asterism stars in the M67 field were observed to enable accurate photometric calibration of our optical observations. The stars in this field span a wide color range (), that includes the range of colors of the program galaxies, and hence are suitable for obtaining the transformation coefficients to the Cousins system defined by Bessell (1990). The transformation equations used are:
| (1) | |||||
| (2) | |||||
| (3) | |||||
| (4) | |||||
| (5) |
where and are standard magnitudes, and are the extinction corrected instrumental magnitudes, and are the zero points and and the color coefficients in bands and respectively. Typical extinction coefficients for the observatory (0.20, 0.11, 0.07 and 0.03 for and bands respectively) were used. Considering that the objects and the standard stars were observed as close to the meridian as possible, and in none of the cases the air mass exceeded 1.3, the error introduced due to possible variation in the extinction coefficients is less than 0.02 magnitude. The coefficients and were obtained by using the standard magnitudes of Chevalier & Ilovaisky (1991). Calibration coefficients for H filters were obtained using the monochromatic magnitudes at 6660 Å, obtained using intermediate-band ( Å) filters, of five M67 standard stars given by Fan et al. (1996) for the 2000-February and 2002-February runs. For the 2002-October run, spectroscopic standard star BD28+4211 was observed in all the H filters. The spectrum of this star from Oke (1990) was integrated to obtain the flux inside each of the H filters. In the 2001-December run, the photometric standard star PG0231+051 was observed. The -band magnitude of the stars in this field were used to calibrate the H filter, following the method described by Mayya (1991). The coefficient is the conversion factor between the observed count rate () and the flux ( in erg s-1 cm-2). Typically, the values obtained from different observations agree within 1–3%. The color coefficient for this conversion is found to be negligible (i.e. =0.0) for all the H filters.
The values of and for different observing runs are given in Table 3. The color coefficients are reasonably small for all filters except for the -band. This is understandable given that our -band is centered around 500 Å to the blue and lacks the red tail as compared to that recommended by Bessell (1990). We found negligible variation of the color coefficient during the two-year span when most of these observations were carried out, and hence used the same values for all the runs. The stability of on different nights was checked using at least two standard fields from the Landolt Selected Areas (Landolt, 1992). The standard fields observed during our runs are PG0231+051, SA110232, PG2336+004, Rubin 149 and PG1323086. The rms errors on the transformation coefficients represent the variation of zero points obtained using all the stars observed in a run that typically consisted of five consecutive nights.
The detector and filter system combination that we used for the NIR observations is identical to that used in the observations of standards by Hunt et al. (1998), and hence the color coefficients are expected to be negligibly small. We verified this by observing fields AS17 and AS36, which contain stars spanning a wide range of colors. We observed at least 2 standard fields each night, each field containing more than one star and some fields such as AS17 containing 5 stars. NIR zero points are found to be stable not only for a run, but also over all the runs required to complete the observations. The resulting zero points are: and in and bands, respectively.
2.5. Photometric errors
We aimed at carrying out surface photometry of galaxies up to a radius where the -band surface brightness reaches a level of mag arcsec-2. Unlike normal spiral galaxies, the ring galaxies have a very limited dynamic range (typically 2–3 magnitudes), with most of the total flux originating in low surface brightness regions. Uncertainties in the estimation of sky value is the principal source of error at these surface brightness levels both for the optical and NIR observations. We measured the typical mean sky value and its rms errors in all the filters for a galaxy. The error in magnitude for an observed sky-subtracted count rate, , was calculated using the relation:
| (6) | |||||
| (7) |
The three terms in the expression for correspond to the error due to the uncertainty in the residual sky value, rms error on the sky value, and the error due to the photon noise of the source, respectively. Boxes of pixels a side located at five different object-free regions around the galaxy of interest were used to measure the values. The is obtained as the rms of the mean residual values between the boxes, and the is the mean of the pixel-to-pixel rms value within these boxes. For NIR images , whereas for optical images and were comparable. This is due to the error involved in subtracting a gradient in the background that was present in all our optical images (see § 2.3). On the other hand, subtraction of a separate sky image in the NIR results in practically zero residuals every where in the image. The quantity is the number of pixels in the aperture (or in the azimuthal bin) used in obtaining .
The errors on colors involving the optical and NIR bands (e.g. ) were obtained by adding quadratically the errors on the V and magnitudes. The rms errors on the sky values in different optical bands are partially correlated, and the same is true for the three NIR bands. Hence errors on the colors involving only optical or NIR colors are, in general, smaller than that on the surface brightness values.
2.6. Comparison of our photometry with those in the literature
We searched the literature for previous photometric study of our sample ring galaxies or their companions. We carried out photometry of the common galaxies, using synthetic apertures that were simulated to be as close to the literature apertures as possible. Our photometry is compared with those in the literature in Figure 1, along with the estimated errors in the photometry. The error bars in the horizontal direction denote the errors in our photometry, whereas the vertical error bars are obtained by quadratically adding the errors of our and literature photometry. The literature photometry is taken from: Third Reference Catalogue (de Vaucouleurs et al. (1991)(RC3 henceforth)) and Buta (1996) (-band photoelectric aperture photometry for seven and colors for six sample galaxies; filled circles with error bars), Appleton & Marston (1997) ( photometry for four sample galaxies; error bars without any central symbol), Mazzei et al. (1995) and Bonoli (1987) ( CCD photometry for two and one galaxies, respectively; open squares with error bars), and 2MASS ( photometry for five galaxies; filled circles with error bars). The sources of H photometry are Marston & Appleton (1995) (5 galaxies) and Hattori et al. (2004) (Arp148).
From the comparison, it can be seen that there is no systematic offset between our photometry and those in the literature for , , and H photometry. The agreement between ours and literature photometry in these bands is, in general, within the quoted errors. In the case of the -band, our photometry agrees well with that of the 2MASS, whereas Appleton & Marston (1997) measurements are systematically fainter by 0.1–0.5 mag. Similarly, for those galaxies for which both the optical and NIR photometry are available, we find that literature colors (obtained by combining and measurements of different authors) are systematically redder than our colors by 0.0–0.5 mag. Agreement between the H fluxes for three galaxies is within 10% of each other. The galaxies with large departures are VIIZw466 and Arp148. The error for Arp148 is most likely because of unspecified correction for [NII] fluxes in the literature.
3. Multi-band Morphology
3.1. The color Atlas
We obtained the color images of ring galaxies by digitally combining images in
the and filters. The IRAF external package color was used for
this purpose, where the colors were represented by , , and band
filter images, respectively.
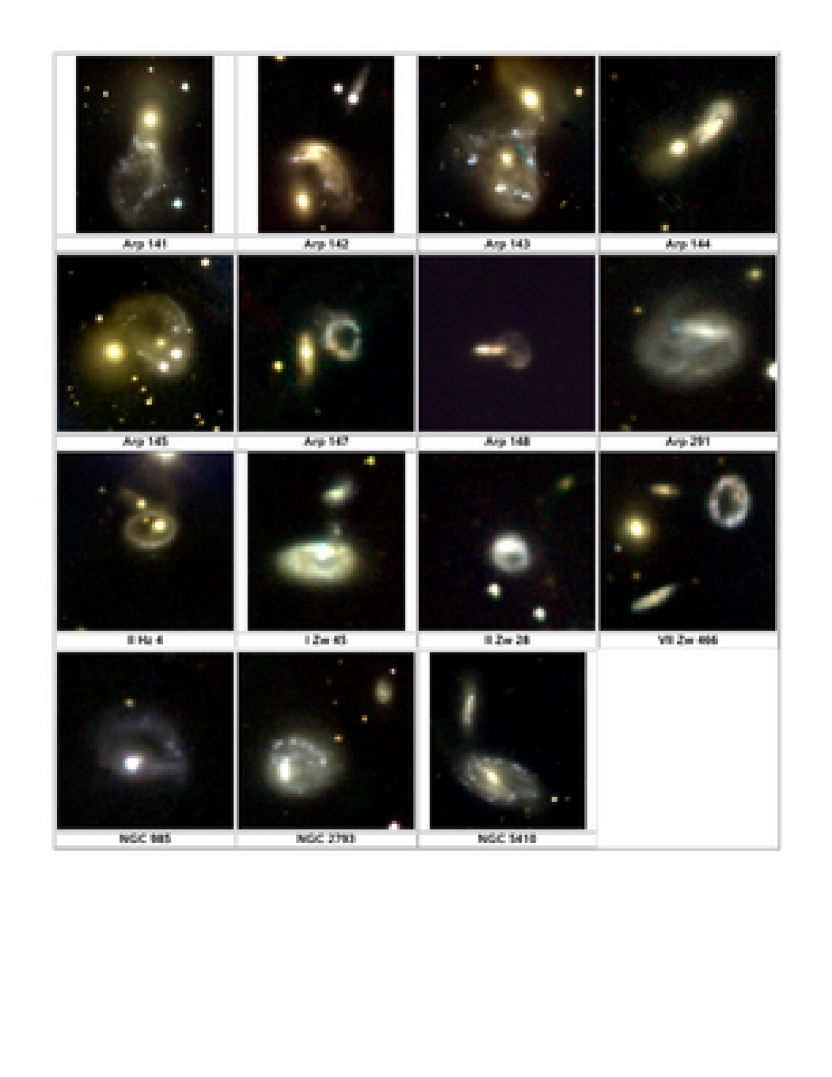
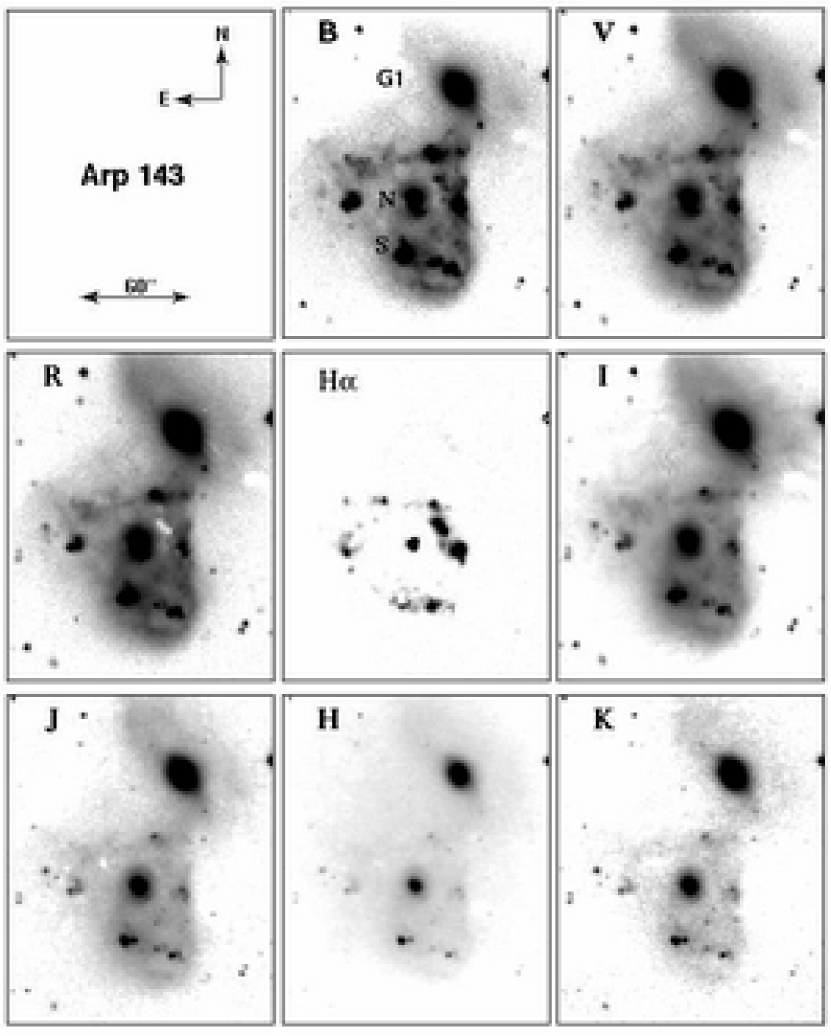
These color composite images are shown in Figure 2, where North is up and East
is to the left. Galaxies from Arp’s (1966) catalog are displayed
first, followed by IIHz4 and Zwicky galaxies, and finally galaxies with an
NGC number. This ordering sequence is maintained in all tables from Table 4
onwards.
The following characteristics of ring galaxy systems, some of
which were well-known, can be noticed in these images:
(i) The ring is delineated by bright, blue knots.
(ii) The companion galaxy (when seen) is redder than the ring galaxy.
(iii) The nucleus of the ring galaxy is off-centered with respect
to the ring, and can be easily distinguished because of its relatively
yellowish or reddish color, even when it is seen superposed on the ring.
The direction of displacement of the nucleus is usually towards
the companion.
(iv) The stars in the external parts of the companion galaxy are stripped
in at least four cases (Arp141, Arp143, Arp144, NGC5410).
In the following paragraphs, and in the Appendix, we give a detailed description of the observed characteristics for each sample galaxy.
3.2. Two-dimensional distribution of ionized gas and stars
The continuum subtracted H emission-line, and the -band images of
all the program galaxies are displayed in grey-scale in the Appendix, one figure for
each galaxy. The H emission originates from the ionized gas associated with
the massive star-forming regions, whereas the -band images trace the stellar
light of both young and old stars. In the figures, the H contours are
superposed on the -band image, which allows us to directly compare the
location of active star-forming regions with respect to the distribution of
the disk stars. Both the H and the -band images are displayed in
logarithmic scale in order to illustrate the bright knots and faint parts of
the stellar disk in the
same image. Two ellipses are drawn for each galaxy, the inner ellipse
corresponding to the ring and the outer ellipse corresponding to the intensity
level of mag arcsec-2. Every ring galaxy of our sample contains a
resolved stellar source, usually the brightest in the -band, which we
identify as the nucleus. The position of the nucleus is indicated by a small
circle on the H image. The diameter of the circle corresponds to .
The field of view of the displayed images includes the candidate companion
galaxies as well. These are identified by the letters G1, G2 etc.
Description of the individual galaxies is given as notes in the
Appendix. We describe the general characteristics that can be seen in
these images below:
(i) Majority of the H emission originates in compact knots, whose
distribution coincides with the continuum ring that had formed the basis for
them to be classified as ring galaxies. In three galaxies (Arp145,
Arp291 and NGC985), a ring cannot be traced in H in spite of a
ring-like structure
in the continuum. In these galaxies, the H emission is detected only
around the nucleus that is seen superposed on the continuum ring. In two
other galaxies (Arp142 and Arp144), a complete ring cannot be traced neither
in the continuum nor in the H line. The ring-like structure of NGC5410
resembles a two-armed spirals in a barred galaxy rather than a ring.
(ii) An H knot usually has an associated continuum knot, and vice versa.
However, there are noticeable differences ( kpc) in the positions
of the knots in the two bands. In most cases, the positional shifts are in
the azimuthal directions. In a few cases, where the shifts are in the radial
direction, continuum knots lie on the inner side of the H knot.
(iii) The width of the ring, measured as the Full Width at Half Maximum
of the radial H intensity profile, is larger than the size of the most
intense H knot, and is due to the radial spread of H knots
around the ellipse used in the construction of the radial profile.
(iv) Among the emission features not associated with the ring,
the most common is the nuclear emission. Emission knots and diffuse emission
internal to the ring are seen in Arp141 and NGC2793.
In two of the classical ring galaxies of the sample (Arp147 and
IIHz4), a couple of interesting structures in the ionized gas can be
traced outside the ring.
(v) All the sample galaxies have stellar disks extending outside the ring.
In five cases (Arp141, Arp143, Arp145, Arp147, and NGC2793),
the ellipses that best fit the disk and the ring
have different centers, orientations and ellipticities.
(vi) The stellar disk outside the ring shows considerable degree of asymmetry.
(vii) Ionized gas is detected in the companions of four of our candidate
ring galaxies (Arp142, Arp148, VIIZw466, and NGC5410).
3.3. One-dimensional surface photometry
One dimensional (1-d) radial intensity profiles of galaxies are often used to analyze various morphological components in galaxies. The 1-d profiles are obtained by fitting ellipses to the isophotes, and then averaging the intensities azimuthally along the fitted ellipse. In normal galaxies, the resulting intensities are smoothly decreasing with radius, with non-axisymmetric sub-structures such as spiral arms or bars, if any, appearing as low-amplitude perturbations. On the other hand, the ring is an axially symmetric structure, and its contribution to the radial intensity profile is significant. In fact, in majority of the ring galaxies, intensity increases away from the center, and peaks at the position of the ring. In most ring galaxies, the brightest photometric component, usually a bulge or a nucleus, is off-centered with respect to the ring. These special characteristics of ring galaxies make the surface photometric profiles to depend critically on the details of the method used to obtain them.
Appleton & Marston (1997) discussed the problems of getting physically meaningful profiles in ring galaxies. In their work, they adopted a method of nested rings in which they varied the center of the photometric ellipse smoothly between the nucleus and the ring center. The ellipticity and position angle were also varied to make sure that the ellipses corresponding to successive isophotes do not cross each other. The profiles extracted using this method critically depend on the position and the intensity of the off-centered nucleus, which complicates their interpretation. Moreover, technically it is impossible to obtain such profiles for systems where the off-centered nucleus is seen superposed on the ring.
We aim to obtain a characteristic post-collisional intensity profile of ring galaxies. Our interest in obtaining such a profile is two-fold: (i) to inter-compare the radial intensity profiles of ring galaxies, and (ii) to compare the observed profiles with the predictions of an expanding wave model. Both these studies require the construction of the intensity profiles, centered on the ring-center, and without the contaminating effect of any surviving sub-structure (e.g. nucleus/bulge). Clearly, the method of nested rings adopted by Appleton & Marston (1997) is not suitable for our purpose. Hence, we adopted a different method, the details of which are described below. We started out by setting the values of the geometrical parameters of the ellipse (center, ellipticity () and position angle (PA)) that best reproduces the shape of the ring as traced in H. In three cases where the H emission does not trace a complete ring (Arp145, Arp291 and NGC985), we obtained the ellipse parameters using the -band ring. The ellipse parameters were chosen interactively in such a way that the majority of the ring knots lie on a single ellipse. The ring galaxies are characterized by two fundamental structures — a high surface brightness ring and a low surface brightness stellar disk. We found that, in the majority of the cases, the stellar disk at mag arcsec-2 can be reconciled with the same parameters of the ellipse (fixed-center) that best fits the ring. However, in five galaxies the ellipse parameters for the two components were visibly distinct, as noted in point (v) of § 3.2, and the Appendix figures for the corresponding galaxies. Nevertheless, the differences are mainly noticeable outside the ring, whereas our primary interest is in the part interior to the ring. Hence, in all cases, we choose the geometrical parameters for the ring to obtain the intensity profiles. The Right Ascension and Declination of the ellipse center, the semi-major axis, ellipticity and the position angle of the major axis of the best-matched ellipse are tabulated in Table 4. The last two columns give the surface brightness in the H and -bands, respectively.
While extracting the intensity profiles, we masked the nucleus even when it is seen superposed on the ring. Any foreground star is also masked. In three galaxies (Arp291, IZw45 and IIZw28), the nucleus occupies more than a third of the ring perimeter, which made the profile shape depend heavily on the chosen mask. We hence show the profiles without any nuclear mask for these galaxies. Radial intensity profiles were obtained by azimuthally averaging the intensities of the unmasked pixels in concentric elliptical annuli around a fixed center. In Arp142 and Arp144, we couldn’t define an ellipse in either H or the -band image. The H image of Arp142 gives an impression that the ring in this galaxy is twisted and is seen nearly edge-on. The plotted ellipses for these galaxies do not represent any isophote, instead they are meant only to obtain representative radial intensity profiles and total magnitudes in different bands. We include these galaxies only in the discussion of global properties.
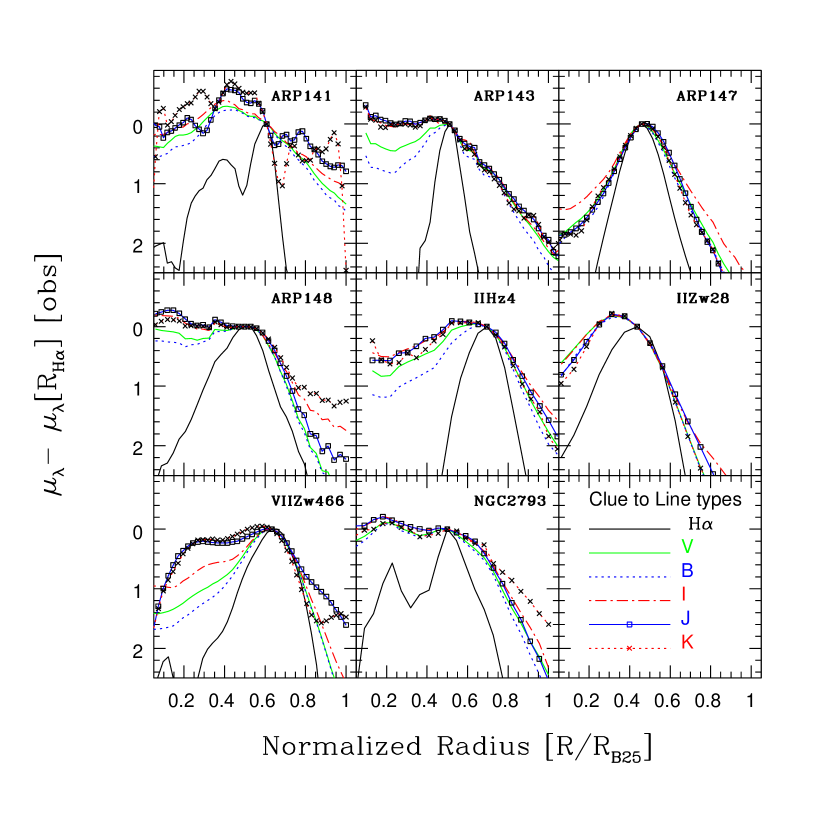
Normalized intensity profiles in the continuum bands are compared with that in the H line for 8 ring galaxies in Figure 3. Six galaxies where the ring is not well-defined are excluded from this figure. In addition, we excluded IZw45 from this figure due to the complications in the extraction of a representative radial profile given its small angular size and the dominance of the off-centered nucleus. The radius is normalized to (the radius where = 25 mag arcsec-2), whereas the intensities are normalized to their values at , the radius where the H profile peaks. The most striking feature on these plots is that the H profiles are sharper than the continuum profiles on either side of the ring. Two galaxies (Arp141 and NGC2793) show secondary peaks inside the ring, which are due to the presence of a few emission knots interior to the ring. Continuum profiles show a variety of forms on the inner side of the ring, with the extreme cases being NGC2793, where the -band intensity profiles are brighter by around 0.2 mag in the center, and Arp147, the empty ring galaxy, where the center is 2 magnitudes fainter than the ring. On the other hand, the continuum profiles outside the ring fall linearly on these plots, implying that the stellar disk outside the ring is exponential.
3.4. Integrated magnitudes and colors
We obtained the total magnitude (including the nucleus) of each galaxy in all the bands by integrating the light inside an elliptical aperture of semi-major axis length . The parameters of the elliptical aperture are the same as that used to obtain 1-d intensity profiles (see Table 4). The measured total magnitudes and optical and NIR colors along with the estimated errors for the sample galaxies are shown in Table 5. The value of is given in column 2.
We also obtained total magnitudes of the companions by integrating over polygonal apertures corresponding to the isophote = 25 mag arcsec-2. The resulting magnitudes and optical and NIR colors along with the estimated errors for the sample galaxies are given in Table 6. Photometry was obtained for all the suspected companions surrounding a ring galaxy. In cases where there were bright foreground stars within the apertures used for measurements, their contribution was subtracted both for the ring and the companion galaxies.
3.5. Global star formation rates in ring galaxies
The current star formation in galaxies is inferred using a wide variety of tracers (Kennicutt, 1998). The presence of star formation in ring galaxies was inferred from the far-infrared (FIR) (Appleton & Struck-Marcell, 1987) and the H emission (Marston & Appleton, 1995). In the current study, we calculate the SFR using the FIR fluxes and compare it with that obtained from the H fluxes. We also estimate the thermal radio continuum (RC) emission and compare it with the literature 20-cm continuum fluxes. Such a study of the Cartwheel galaxy has yielded a SFR of 18 M yr-1, and the thermal fraction at 20-cm of % (Mayya et al., 2005).
In Table 7, we present the quantities related to the current SFR. Observed H fluxes and H equivalent widths are given in columns 2 and 3, respectively. The columns 4 and 5 list the observed FIR and 20 cm RC fluxes. The latter fluxes were taken from Jeske (1986), which could be lower limit given that their observations were sensitive to only the bright regions. Observed H flux was corrected for the galactic extinction, and contribution from the [NII] lines (20% from Bransford et al. (1998)). We then used the calibration of Panuzzo et al. (2003) for estimating SFRs from the H and FIR luminosities. SFRs obtained using the H luminosities were always found to be less than that found using the FIR luminosities. In star-forming galaxies, such a difference is understood in terms of the extinction by dust, which reduces the H emission, but not the FIR emission (Hirashita et al., 2003). Under this hypothesis, the FIR luminosity gives a reliable measure of the total SFR. We hence derived the SFR using the FIR and calculated the effective visual extinction in such a way that the SFRs derived using the extinction-corrected H luminosities match these values. The resulting extinction is applied to the H fluxes, which were then used to estimate the thermal RC flux at 20 cm (Osterbrock, 1989). The SFR, and the estimated thermal flux as a fraction of the detected flux are given in the last three columns of Table 7.
The median value of SFR for our sample of galaxies is 7 M yr-1, which is more than a factor of two lower than that in the Cartwheel. Two sample galaxies have SFRs exceeding that of the Cartwheel. One of them is known to have a Seyfert nucleus (NGC985), while the emission from the other (Arp148) is most likely originates from its companion (see the H image in Figure 13). The observed median H equivalent width is 44 Å, which is close to the median value obtained by Kennicutt et al. (1987) for around 40 spiral galaxies in the Arp (1966) sample. Thus, ring-making collisions lead to similar enhancements of star formation as that from other kinds of collisions leading to peculiar morphological structures.
The median value of the effective extinction for our sample is mag, with two galaxies (Arp145 and Arp148) having mag. The median value is marginally higher than the values found from optical spectroscopy of individual bright HII regions in ring galaxies studied by Bransford et al. (1998). This difference between the effective global extinction and extinction towards the bright HII regions suggests the presence of star-forming regions that are faint or completely obscured in the H images. There is independent indication of high extinction in Arp145: the observed colors and magnitudes at diametrically opposite points suggest that the northeastern segment of this galaxy suffers high extinction. In Arp148 system, the companion nucleus is the most likely location of high extinction.
The median value of the thermal fraction at 20 cm is 43%, with only three galaxies (Arp144, IZw45, NGC985) having values less than 15%, the mean value observed in the normal spiral galaxies. Hence, the sample galaxies have more than the normal share of the thermal flux at 20 cm. For some of the bright knots, Jeske (1986) obtained the spectral indices combining 20 cm, 6 cm and 2 cm observations. These indices are flatter than the value expected for a non-thermally dominated region. Given that the thermal and non-thermal emission are related to the present and past star formation activity, respectively, this relative excess in our sample galaxies is consistent with enhanced levels of current star formation in our sample galaxies, inferred independently from the observed H equivalent widths.
The H emission is detected in companions of four of our sample galaxies. The H fluxes (in erg s-1 cm-2 and log units) and the SFRs (in M yr-1) in these galaxies are: Arp142 (, 0.65), Arp148 (, 1.87), VIIZw466 (, 1.90) and NGC5410 (, 0.20).
3.6. Sample of well-defined ring galaxies
A galaxy was included in the sample of ring galaxies listed by Appleton & Struck-Marcell (1987)
if it was classified as such historically. These classifications
were based on the visual inspection of photographic plate material.
The presence of a ring-like structure (or an arc in a few cases),
accompanied by a companion
preferentially along the minor axis of the ring within
a few ring radii, were sufficient conditions to be classified as a ring
galaxy. Modern digital data allow us to examine structures of the rings
in much more detail as compared to the photographic images.
We hence used our data-set to define a sub-sample of well-defined ring
galaxies, that are most likely to be formed under the scenario presented
by Lynds & Toomre (1976). We considered a galaxy to be a well-defined ring galaxy
if:
(i) a complete ring is traced in both the H and the continuum images, and
(ii) the observed structure cannot be interpreted as a part of a spiral arm
or an arc.
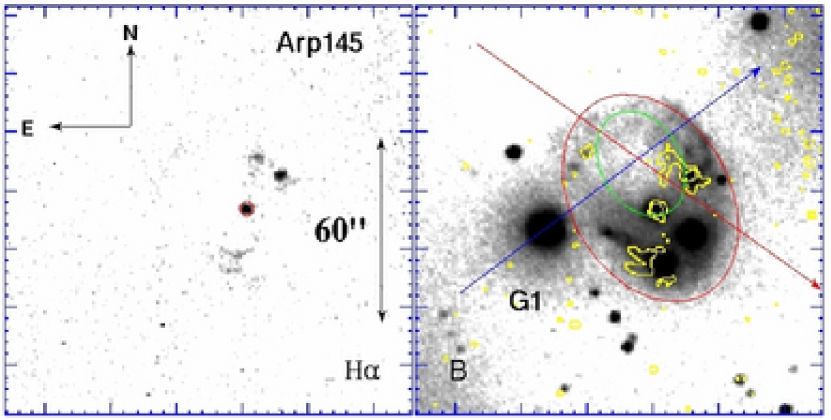
The first criterion ensured that the selected galaxies have on-going star formation in the ring. Nine of the sample galaxies satisfied these criteria. A morphological description of the remaining six galaxies that are rejected is given in Table 8. Three of these galaxies are disturbed barred spiral galaxies — when the winding arm meets the other end of the bar, the structure resembles a ring. The other two are galaxies with an arc-like structure. The sixth galaxy (Arp145) is a marginal case, as the reason for its rejection is the absence of an H ring. The continuum ring is traceable, but is broader and of lower contrast with respect to those in the well-defined ring sample. It is possible that this is a ring galaxy, but we are witnessing the ring at a later phase as compared to those classified as well-defined ring galaxies. Alternatively, it can be a normal ring galaxy, except that its star-forming ring is hidden from the optical view, resulting in a non-H-emitting, low-contrast redder continuum ring (see the description of this galaxy in the Appendix).
Interaction definitely had a role in creating the presently observed structure of the galaxies in Table 8. Probably, the companion only flew close to the target galaxy without really passing through it. We exclude the mis-classified ring galaxies (including Arp145) from the discussions in the rest of this paper. Hence, we are left with nine galaxies that show well-defined rings in both the continuum and H. Among these galaxies, Arp141 is a unique case where the companion is seen along the major axis of the ring.
4. Photometric properties of ring galaxies compared to the spiral galaxies
Integrated magnitude and color of a galaxy carry important information on the total mass and mean age of the dominating population in that galaxy. In this section, we compare the photometric properties, both local and global, of ring galaxies with those of normal spiral galaxies.
4.1. Surface brightness-color relation in ring galaxies
In normal spiral galaxies, intensity decreases and colors become bluer as one moves from the center to the outer parts. This systematic radial change gives rise to a correlation between these two quantities. On the other hand, neither the intensity nor the color change monotonically in a ring galaxy. Hence, it is interesting to know the intensity-color relation for ring galaxies and compare it to that of the spiral galaxies. Such a comparison is shown in Figure 4. The relation for the early and late-type spiral galaxies from the sample of de Jong (1996) is shown by two straight lines: at a given , late type galaxies are 0.4 mag bluer in as compared to the early types.
Ring galaxies distinguish themselves from spiral galaxies in having a characteristic double-valued locus resembling a slanted “” in this plane. The points on the bluer and redder branches correspond to the regions external and internal to the ring, respectively. The point where the two branches intersect pertains to the ring, and is often the brightest and the bluest. This is quite different from that seen in spiral galaxies, where the brightest regions, normally the central regions, are the reddest. In the last panel of the figure, we compare the average color and surface brightness of the ring in different galaxies. Majority of the rings are bluer than even the late-type galaxies at the same surface brightness levels (22–23 mag arcsec-2). This suggests that recently formed stars contribute significantly to the -band light of the ring.
Several interesting aspects of ring galaxies can be noted in Figure 4. Colors of external parts ( mag arcsec-2 on the bluer branch) are comparable to that of spiral galaxies at similar surface brightness. Thus the external part of the disk seems to be unaffected by the collision and has preserved the pre-collisional disk properties. However, the disks do not show the tendency for the color to become bluer as the surface brightness decreases, which is most likely due to relatively large errors on the colors () at magnitudes fainter than in the present observations. Future high signal-to-noise deep images would help in addressing this issue. The colors of IIZw28 are bluer than the typical colors of late-type galaxies, everywhere, including the faint external parts of the disk. Among the 86 galaxies in the sample of de Jong (1996), we found two galaxies (UGC06028 and UGC07169), where the sequence of points in the color-magnitude plane coincides with the parts external to the ring of IIZw28. This is illustrated in the panel corresponding to IIZw28, where we plot the profiles corresponding to UGC06028 (or NGC3495) and UGC07169 (dashed curves almost coinciding with the observed points outside the ring). The galaxies UGC06028 and UGC07169 are classified as PSABb and SABc, respectively in RC3 and do not exhibit obvious signs of interaction, though both have extended blue multiple arms dominating their morphologies in their external parts.
The color at the ring-center, the point of impact of the intruder, (the reddest color on the redder branch) also follows the color-surface brightness relation seen in spiral galaxies. However, the central surface brightness is more than a magnitude fainter than 21.7 mag arcsec-2, the central surface brightness of the disks of spiral galaxies (Freeman, 1970). The nuclear colors, on the other hand, compare well with that of the central parts of the rings even when they are seen superposed on the ring (with the exception of Arp147 and IIZw28). This is illustrated by the solid circle that is placed at 21.7 mag arcsec-2, the central brightness expected for a Freeman disk.
The angle of intersection of the blue and red branches is different in different galaxies. The extreme cases are Arp147, where the two branches are parallel, and Arp148, where they are almost perpendicular to each other. The color and intensities of the bluer branch, which corresponds to the disk external to the ring, are barely affected by the post-collision star formation. On the other hand, many physical parameters related to the expanding wave control the slope of the redder branch. The most important among them are the velocity of the expanding wave, metallicity of the ring galaxy, and the fractional contribution of the underlying disk stars to the observed profiles. A comprehensive analysis of the observed profiles in terms of these physical parameters will be carried out in Paper II of this series.
In summary, the ring is the bluest and the brightest part of the galaxy. The disk external to the ring seems to maintain the pre-collisional disk properties. On the other hand, the ring-center is found to be fainter and bluer than the values expected at the center of the disk of normal spiral galaxy. The blue colors are easily understood in terms of star formation following the collision. Such a star formation is also expected to increase the disk brightness, and hence the observed low brightness implies that a lot of disk stars have escaped from the central regions. We will come back to this issue in §5.3. An alternative scenario to explain the faint and blue inner disks is that the progenitors of ring galaxies were low surface brightness galaxies, rather than normal spiral galaxies.
4.2. Color-color relation in ring galaxies
Color-color relation is traditionally used to illustrate the sequential aging of stellar populations in ring galaxies (Marcum et al., 1992). In Figure 5, we show the locus of points for each ring galaxy in the vs plane. Only the points interior to the ring are plotted. Note that the points corresponding to successive radii are connected by a solid line and hence the observed correlation implies sequential ordering in both the colors, with the colors systematically redder in the inner parts. Thus, our sample of ring galaxies follows the locus seen in other samples of ring galaxies. The nuclei (filled circles) of Arp147 and IIHz4, which do not have H emission, occupy the reddest end of the color-color sequence. Star-forming nuclei, on the other hand, have colors intermediate between that of the ring-center and the ring.
In Figure 5, we also plot the locus of points for normal early and late type galaxies. It is easy to see that the sequential ordering of colors is not a property unique to ring galaxies, instead colors of normal galaxies are also sequentially ordered in radius. In fact, ring galaxies show smaller range of colors, occupying only the blue end of the color-color sequence. Hence, the characteristic property that distinguishes ring galaxies from normal galaxies is their bluer position in the color-color sequence, rather than the sequence itself.
5. Results and comparison with N-body simulations
In this study, we have comprehensively demonstrated the existence of a stellar disk outside the ring in all our sample galaxies. The study has enabled us to photometrically characterize both the disk and the ring, and compare the properties of the disk of ring galaxies to those of normal spiral galaxies. We use this data-set allows us to test in detail some of the predictions of collisional scenario of ring formation. We begin this section by summarizing the results from the N-body simulations that can be confronted with our data-set.
5.1. Testable results from N-body simulations
The most comprehensive set of models that investigate the formation and evolution of ring galaxies, and that can be compared with our observational results comes from the work of Gerber et al. (1996). Using a three-dimensional, combined N-body/hydrodynamical computer code, they studied the dependence of ring structure and its temporal development as a function of the mass ratio of the two colliding galaxies. In their models, the target (that transforms into a ring galaxy) is a gas-rich disk galaxy, and the intruder is a gas-free spheroid galaxy. They presented figures illustrating the evolution of the surface density profiles at several epochs after the impact for both the stellar and gaseous components in a form that can be directly compared with our observations. The target galaxy had properties similar to the Milky Way (M, , ). Three values for intruder galaxy mass were chosen: equal-mass (C-1), one forth (C-4), and one tenth (C-10) of the target galaxy total mass. The disk density and morphology were calculated out to 17.6 kpc, which corresponds to 4.4 disk scale lengths.
In this paragraph, we summarize some of the important results from this simulation, that can be directly confronted with our observations. For collisions involving lower mass galaxies (C-4 and C-10), they found that the stars essentially behave like those in the classical work of Lynds & Toomre (1976). However, the classical picture breaks down in detail in a collision of equal-mass galaxies: e.g. there is bulk motion of material over distances large compared to the initial disk dimension. Further, a ring structure is identifiable only for times Myr after the collision, with the stars and gas expanding to distances twice the initial disk size for later times. In comparison, in experiments C-4 and C-10, the ring has not reached the edge of the original disk up to the end of the run (140 Myr). In all the three experiments, an inner ring forms at the same radius at the same time, but the location of the outer ring is sensitive to the mass ratio. However, the inner ring is noticeable only after Myr, by which time the outer ring has already diffused in the equal-mass collisions. The behavior of gas is also qualitatively different in equal-mass collisions, as compared to the unequal-mass collisions. The gaseous ring lags behind the stellar ring in C-1, whereas in the other two experiments it is embedded inside, with the density maximum lying at the outer edge of the broad stellar ring. The contrast of the ring (compared to the surface density of the unperturbed disk) is expected to be higher for collisions involving higher relative mass intruders. Considerable off-planar structures, both in stars and gas, in the direction of the intruder were found in the C-1 experiment. The vertical spread is more in the center than it is in the ring. In particular, the nucleus is dislodged from the plane of the ring. These effects were found to be only mild in C-4 and C-10 experiments. The vertical movements of gas and stars make the surface densities to be very different from the volume densities, with the maximum differences expected at the central regions. This would also make the observable surface densities heavily dependent on the line-of-sight projection angle of the disk of the ring galaxy.
5.2. Relevant observational quantities
Mass of the ring galaxy, and its ratio to that of the intruder galaxy, are the most important quantities for comparing observations with the models. In most cases, the intruder can be identified with certainty. However, the identification becomes a non-trivial task when a ring galaxy is surrounded by more than one companion galaxy: e.g. in the case of the Cartwheel, one of the two galaxies along its minor axis was long believed to be the intruder, but the detection of a H I plume connecting the Cartwheel to a fainter galaxy farther out has opened up the discussion on the identity of the intruder (Higdon, 1996). Among the 9 well-defined ring galaxies of our sample, VIIZw466 is the only one having more than one companion. In this case, we have considered G2 as the intruder, following the detection of an H I bridge connecting the ring and G2 by Appleton, Charmandaris & Struck (1996). On the other hand, there is no confirmed companion to IIZw28. However, there is a disturbed object within two optical diameters of this galaxy, which we have tentatively identified as the intruder galaxy. We have calculated mass of this candidate companion assuming it is at the same distance as the ring galaxy, and use this mass as an upper limit to the companion mass. In the remaining 7 cases, the only companion that is seen within a few galaxy diameters is taken as the intruder. The majority of these companion galaxies is dominated by the spheroidal component, a fact consistent with the assumptions of N-body simulations.
The dynamical masses of galaxies are usually determined using rotation curves, or in its absence the Hi line widths with single-dish telescopes. Such masses are available only for six of our ring galaxies, and none of the companion galaxies (Jeske, 1986). On the other hand, the stellar masses of galaxies can be determined by combining the -band photometry with an appropriate value for the mass-to-light ratio. The use of the -band ensures that the observed light originates predominantly in stars that contribute to the stellar mass of galaxies. Bell et al. (2003) have presented empirical relations between mass-to-light ratio and colors of galaxies, that allows an estimation of the stellar masses of galaxies taking into account the contamination to the observed light from recently formed stars. We used their relation between and color to determine stellar masses for our sample of ring galaxies and their companions.
In Figure 6a, we show the location of ring galaxies (filled circles) and their companions (open triangles) in color-magnitude plane. Quantities are corrected for the galactic extinction, but not for the internal extinction. The size of the filled circle is proportional to the relative mass of the companion galaxy. The relation between the color and magnitude for galaxies of fixed masses is shown by the dashed lines. The stellar masses calculated using this relation along with other physical quantities for our sample of ring galaxies are presented in Table 9. In column 2, the -band absolute magnitude , corrected for the galactic extinction, is given. The photometric masses obtained using the relation of Bell et al. (2003) are tabulated in column 3. The gas masses, taken as the sum of H I and H2, with a correction factor of 1.4 to take into account the Helium content, and the dynamical masses are tabulated in columns 4 and 5, respectively. The H I and dynamical masses were compiled from Jeske (1986) for 5 galaxies and Appleton, Charmandaris & Struck (1996) for one galaxy (VIIZw466). The H2 masses were taken from Horellou et al. (1995). All the masses used from the literature are homogenized to the distance used in our work. It can be seen that the baryonic mass, taken as the sum of the stellar and gaseous masses is less than the dynamical mass, in all but one case, the exception being VIIZw466. In column 6, we give the ratio of the baryonic masses of the ring galaxy to that of the companion. In calculating this ratio, we have neglected the presence of any gas in the companion galaxy, which is reasonable given that the companion galaxies are redder and bulge-dominated. Other quantities of interest are the ring radius, and disk size usually taken as the radius, , measured at 25 mag arcsec-2. The values of and / are given in the last two columns of Table 9.
In order to facilitate comparison with Gerber et al. (1996) model, we use the mass ratios of the ring galaxy to that of its companion to identify each of our galaxy with one of their C-1, C-4 and C-10 groups. The galaxies belonging to each group are listed in Table 10.
5.3. High mass intruder galaxies and N-body simulations
The photometrically derived baryonic mass ratios presented in Table 9 are expected to represent their dynamical mass ratios, as there is no reason to believe different ratio of stellar to dark matter in ring and companion galaxies. The mass of the companion is smaller than that of the ring galaxy in four cases (IIHz4, IZw45, IIZw28 and NGC2793), whereas it is higher in three cases (Arp141, Arp147, Arp148). In Arp143, the masses are almost equal. In VIIZw466, the mass ratio depends on the identification of the companion. With the late-type galaxy G2 as the companion (Appleton, Charmandaris & Struck, 1996), the ring galaxy is around 2.5 times massive. However with G1, the compact companion along the minor axis, as the intruder, the ring galaxy mass is around half of that of the companion, a value similar to that found in other three galaxies with massive companions. Hence at least in three cases, the intruder seems to be more massive than the target galaxy. This is unlikely to be due to mis-identification of the companion, as there are no other candidates in the neighborhood. In addition, in two of the companion galaxies (Arp141 and Arp148), we can see clear signs of interaction in the form of tidally stripped stars. Thus, the current mass of these ring galaxies is indeed less than that of the companion.
It is not clear whether a gas-rich disk galaxy could survive a head-on collision with a higher mass, but compact, companion, a case not considered in most of the simulations. Recent simulations by Namboodiri et al. (2006) show that such collisions result in large (up to 30%) amount of mass being lost from the disk galaxy. Even in the simulations of Gerber et al. (1996), where the companion mass at the most equaled the target galaxy mass, considerable fraction of stars from the central part of the ring galaxy were found to escape out of the plane in the 1:1 collisions. If these stars lie outside our photometric apertures, then it is possible that we have underestimated the ring galaxy mass. In the following paragraphs, we discuss this issue.
Gerber et al. (1996) presented projected radial intensity profiles for their on-axis 3-D simulations by summing stellar contributions perpendicular to the plane. Thus, the escaped stars still contribute to the radial intensity profile, resulting in a profile that is almost similar to that of the pre-collisional disk. On the other hand, the observed intensity profiles at the central parts are qualitatively different from those of the 3-D simulations: e.g. observed central surface brightness (e.g. ) is systematically lower than that at the ring, whereas Gerber et al. (1996) models always suggest higher stellar densities at the center than at the ring. Thus the escaped central stars do not seem to contribute to the observed radial profiles. The reasons for this may be that the collisions in the observed galaxies are slightly oblique, and the disk orientation is not exactly perpendicular to the line-of-sight.
If the collisions are oblique, then the off-planar stars, most of which belonged to the central regions, will not be seen projected on to the central regions on the 2-D images. Instead they are more likely to be seen projected at a larger radius. Can some of the observed light outside the ring be attributed to these stars? The fact that the colors at the external parts of our sample galaxies (see the radial color profiles in the appendix) are typically bluer than that in the central regions, and that they compare well with the colors of external parts of normal galaxies, suggests that the escaped stars do not dominate the light outside the ring. Thus, the escaped stars seem to be spread out to much larger radii, and our photometric apertures do not include them, leading to an under-estimation of photometrically derived masses. Deep wide-field infrared band imaging of ring galaxies would be required to detect the missing stellar mass.
In summary, we believe that the ring galaxies with apparently higher mass intruders have lost as much as half of their masses during the passage of the companion, and that the two galaxies had comparable masses at the time of collision.
5.4. The disk size-absolute magnitude relation
In Figure 6b, we plot the disk radius, , against for our sample of ring galaxies (filled circles) and for normal spiral galaxies from the sample of de Jong (1996) (thin dots). In three ring galaxies with massive companions, an arrow is drawn with the tip of the arrow indicating the magnitude of the ring galaxy if it had the same mass as that of the companion. As expected, brighter galaxies are larger and vice versa. What is intriguing, however, is that the relation shown by the ring galaxies is exactly the same as that for normal spiral galaxies. represents the total magnitude from the underlying disk stars and is not heavily affected by the contribution from recent stars. Hence it is a good approximation to assume that the present is the same as that of the pre-collisional galaxy. Thus, the observed relationship implies that the size of the stellar disk is unchanged because of the passage of the intruder. Under the collisional scenario of ring formation, ring galaxies are expected to be larger than normal spiral galaxies of the same mass, especially in those with large relative companion masses, and late stages of collision. Our observations do not show any dependence of size on the relative mass of the companion. Hence, the only way to reconcile our observations with the results of N-body simulations of Gerber et al. (1996) is that the collisions occurred less than 80 Myr ago. The absence of an inner ring in any of our sample galaxies is consistent with these relatively recent collisions.
5.5. The disk scale length-companion mass relation
The propagation of a circular stellar density wave in the disk of a ring galaxy results in the re-distribution of its stars. As a result, the radial intensity profile deviates from the intrinsic exponential form, showing a bump at the position of the ring. N-body simulations of Gerber et al. (1996) show that the profile outside the ring continues to be exponential, but steeper than the original profile, especially for galaxies with high-mass companions. At a fixed age, the steepness of the profile depends on the companion mass, with higher the relative mass of the companion, steeper is the profile. Outer disk profiles of ring galaxies with relatively low-mass companions become steeper at later times as compared to the ones with high-mass companions. In order to measure the steepening using the observed profiles, we need to know first the intrinsic pre-collisional scale length of the disk. The observed relation between the disk scale length, , and the and the baryonic mass of a galaxy for the normal spiral galaxies can be used to infer the disk pre-collisional scale length for each galaxy. In Figure 6c, we plot the disk scale length measured outside the ring, against the stellar mass of the ring galaxies (filled circles; in 3 galaxies where the estimated ring galaxy mass is smaller than that of the companion, we draw the arrows indicating the amount by which masses have to be increased to match that of the companion). The expected relation for normal spiral galaxies from de Jong (1996) is shown by small dots. It can be seen that the derived scale lengths are systematically smaller than that for normal spirals of equivalent mass in all the ring galaxies, except one (Arp143). Thus, in general, the observed results support the predictions of the simulations of Gerber et al. (1996). However, the steepness of the profile is not found to depend on the relative mass of the companion, which probably indicates that the rings with low-mass companions in the sample are on the average older than those with high-mass companions.
5.6. The ring size-disk size relation
The physical size of the ring in our sample of galaxies varies between 2–12 kpc in radius. In Gerber et al. (1996) simulations, rings reach these values in less than 60 Myr for 1:1 models, and less than 140 Myr for 10:1 models. However, when normalized to the disk radius (), all the rings are located between 0.3 and 0.7, with a mean value . These are illustrated in Fig. 6d. Considering the possible broad range of the expansion velocities and ring ages, it is surprising that the rings preferentially occur at around half-way in the optical disk. Reasons for this apparent preference could be the following: the first is regarding the bias against classifying a galaxy as a ring galaxy when the ring is in its very inner part — such rings are often associated with resonance phenomenon, and are excluded from the catalogs of ring galaxies. Also, at early times the intruder would be still seen projected on the disk, inhibiting the detection of the ring. Secondly, in the very external parts of the galaxies, gas density is usually low, and is below the critical density required for star formation. Martin & Kennicutt (2001) found the density of HII regions in normal spiral galaxies falls sharply slightly inside the optical radius, and the radius of the sharp decrease corresponds to the regions where the gas density drops below the critical density. Using their data for 32 spiral galaxies, we calculated the threshold radius to be 0.8, which is shown by a dashed horizontal line in Figure 6d. Another reason for the absence of rings at large disk radii is that the expanding wave would have decayed so much by the time it reaches these parts of the disk that it won’t be efficient enough to trigger star formation. Hence, star-forming rings are not expected to be found at the very external parts of the optical disks. Bizyaev, Moiseev, & Vorobyov (2007) implemented these ideas in their numerical model for Arp 10, and found that the H surface brightness reaches its maximum value when the ring has expanded to a radius of about , the inner ring radius observed in that galaxy. Hence, both the physical and observational selection effects favor the detection of rings when they are located at about half-way through the optical disk.
6. Conclusions
We have carried out an analysis of the optical and NIR images of 15 galaxies in the northern hemisphere from the sample of Appleton & Struck-Marcell (1987). The images are used to establish a variety of characteristics common to these systems. These characteristics are summarized below.
All the 15 galaxies studied show evidence for recent star formation in the form of detection of FIR and H emission. In general, the SFR derived using the FIR is higher than that derived using the H, with the differences suggesting a median visual extinction of mag. Arp145 and Arp148 are the two galaxies where the observed FIR and H fluxes suggest effective visual extinction in excess of 4 mag. The median SFR (7 M yr-1) and H equivalent width (44 Å) suggest that their current star formation activity is similar to that found in other kinds of interacting galaxies. The observed 20 cm fluxes of the sample galaxies seem to be having a higher thermal fraction as compared to that in normal spiral galaxies.
All the 15 galaxies studied show morphological signs of having suffered an interaction in the recent past. However, only nine of the galaxies have morphologies consistent with a ring-making collision of the type described by Lynds & Toomre (1976).
Our sample of ring galaxies shows the sequential color-color relation found in other ring galaxies by Marcum et al. (1992). However, we found that the relation for ring galaxies is not very much different from that seen for the normal spiral galaxies — and that the characteristic that distinguishes the ring galaxies from the normal galaxies in a color-color plot is that the ring galaxies occupy only the blue end of the relation for the normal spiral galaxies.
We were able to trace the underlying stellar disk well beyond the ring in all our sample galaxies. The outer extension of the stellar disk is in general symmetric around the ring, with noticeable asymmetries present in Arp141, Arp143, Arp147 and NGC2793. The disk colors in the external parts are redder than the ring, but are in general bluer than that at the ring-center.
The ring-center of our sample galaxies is fainter (at least by a magnitude in ), and bluer (by around 0.2 mag in ) as compared to the values at the disk centers of normal spiral galaxies. Recent star formation in the wave is expected to make the inner disk bluer (as is observed) and brighter (contrary to what is observed). Thus, the observed low surface brightness of the ring-center implies either considerable fraction of the inner disk stars have splashed out of the disk or that the pre-collisional galaxy was of low surface brightness.
The outer disk scale lengths of ring galaxies are found to be systematically smaller than that of normal galaxies of comparable mass. On the other hand, the disk radius , measured at the 25 mag arcsec-2 on azimuthally averaged -band profiles, seems unchanged due to collisions. Under the N-body simulations of Gerber et al. (1996) these results imply time elapsed since the collision less than 80 Myr.
The physical sizes of the ring in our sample varies from 2–12 kpc. However, the observed rings seem to be systematically located around half-way through the disk. This is most likely due to the difficulties in identifying a ring galaxy in its initial phase of evolution. The outer parts of the galaxies may not have sufficient gas surface densities to form stars.
APPENDIX
7. NOTES ON INDIVIDUAL GALAXIES
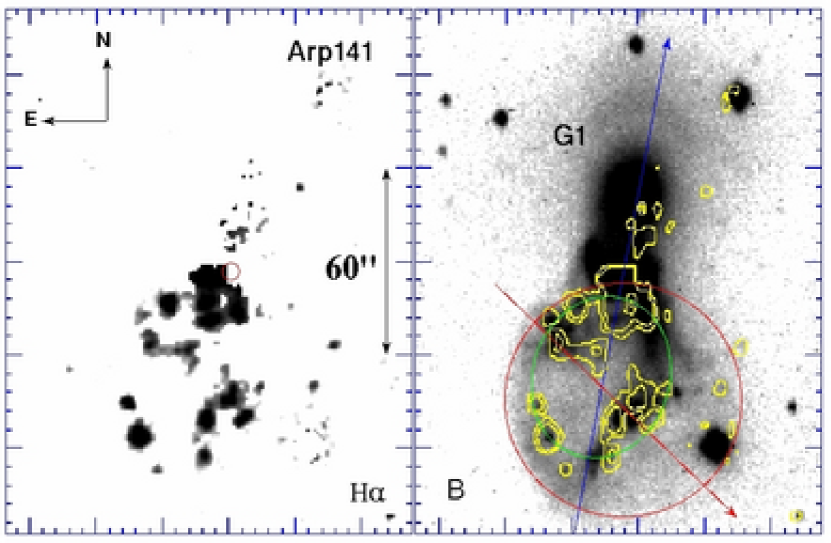
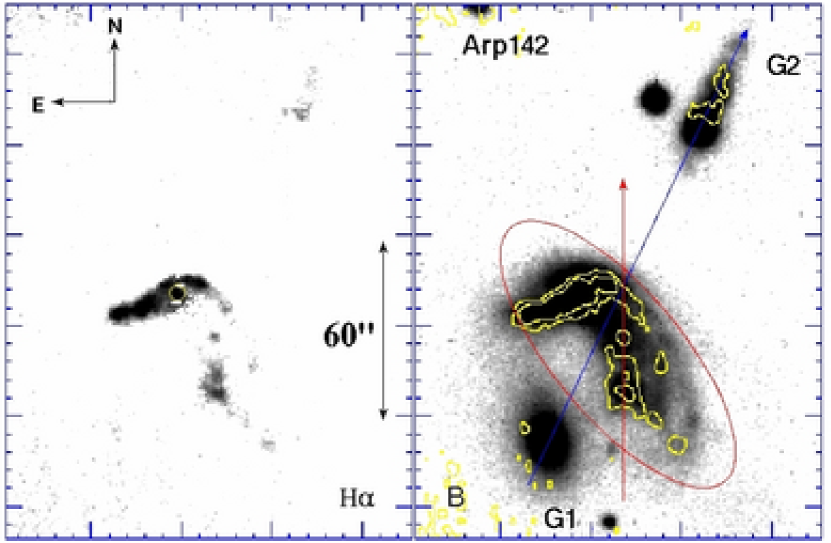
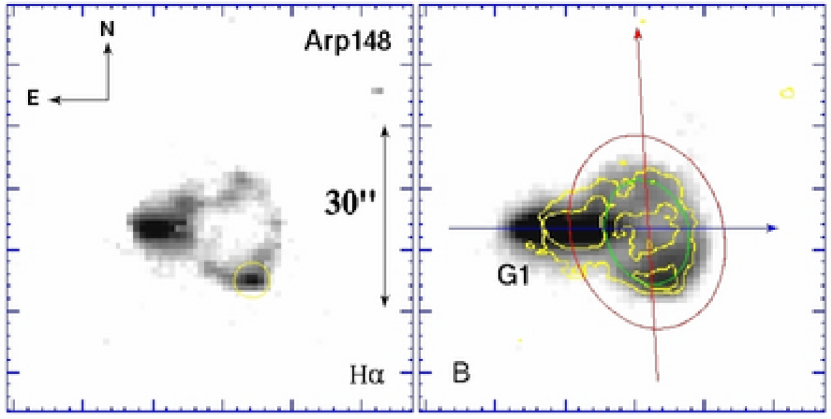
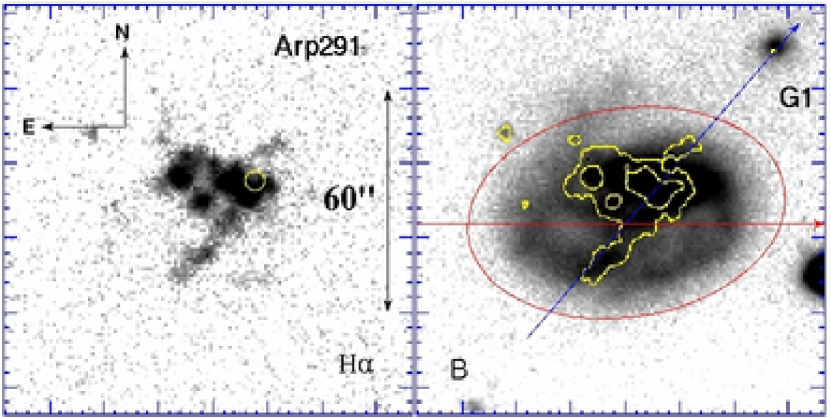
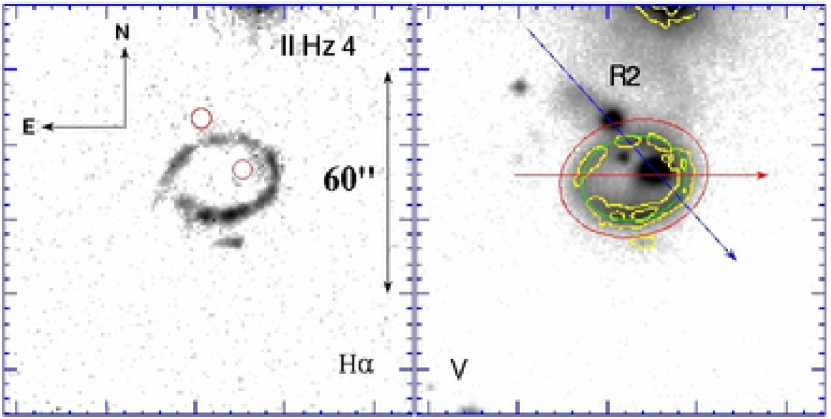
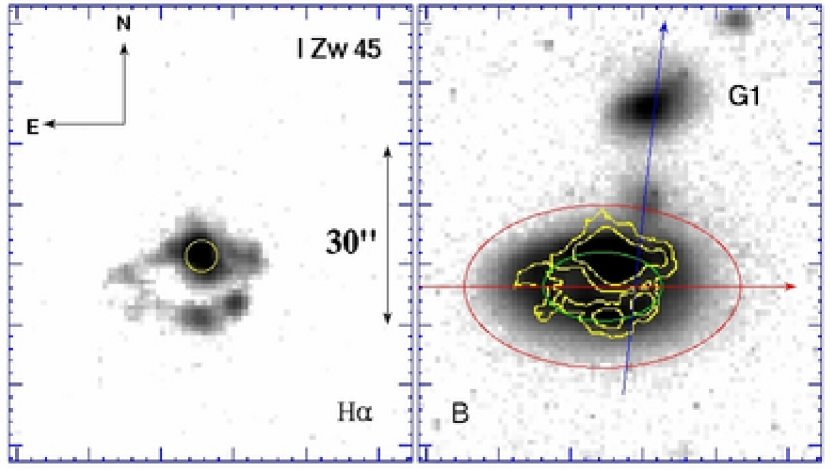
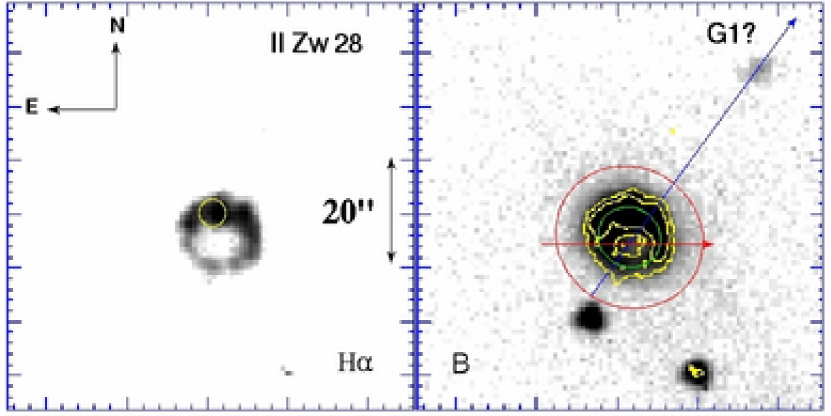
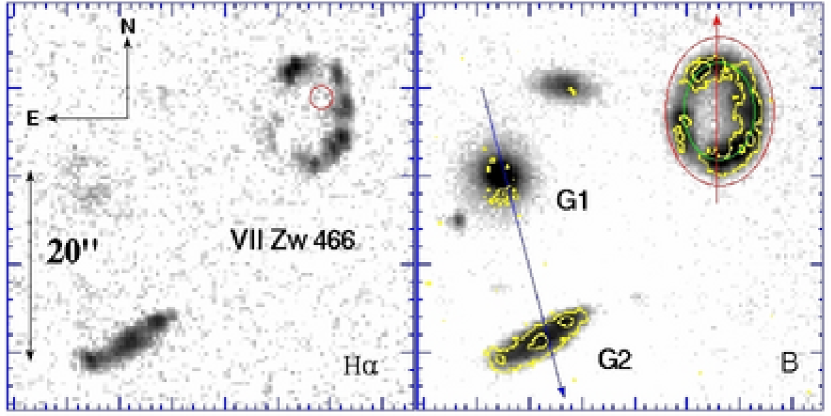
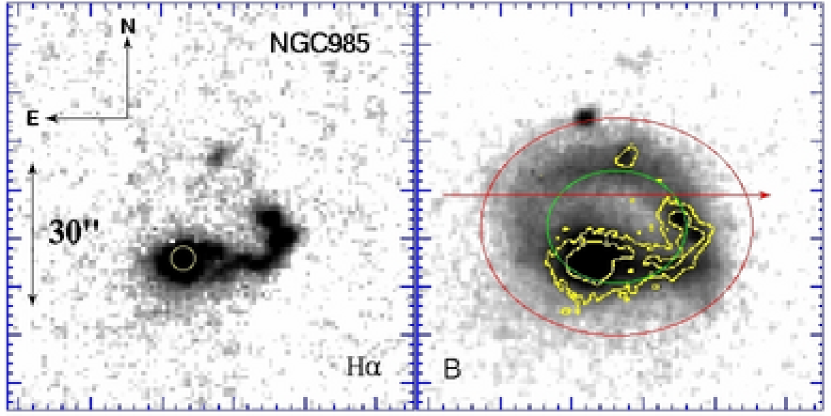
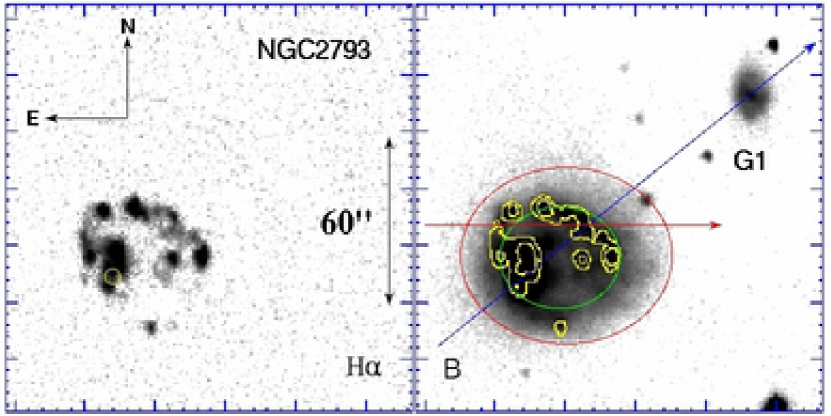
In this Appendix, we discuss structural properties of each galaxy, based on their multi-band appearance and radial profiles of intensity and colors. The discussions are centered around (i) the morphology of the ionized gas, (ii) the underlying stellar disk, (iii) the nature of the nucleus, and (iv) the morphology of the candidate companion galaxies. We present one composite figure for each galaxy (Figures 7–21). Each figure has three parts: top part, gray-scale images in H and -bands; bottom left part, azimuthally averaged radial intensity and color profiles; and bottom right, the intensity and color profiles along two representative position angles, illustrated on the gray-scale -band image, one of them passing through the companion.
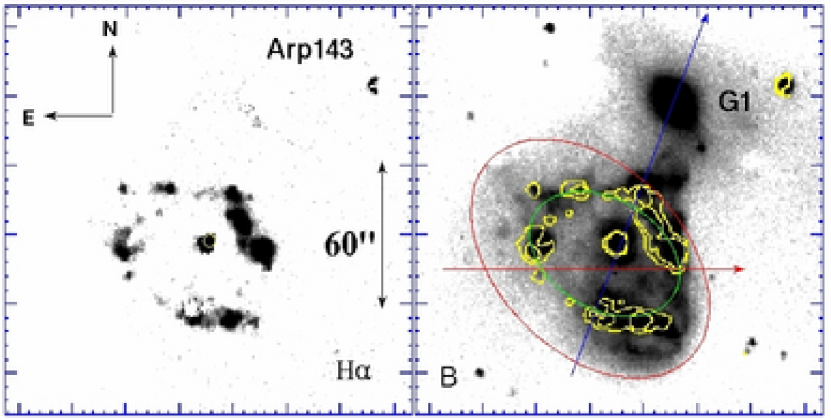
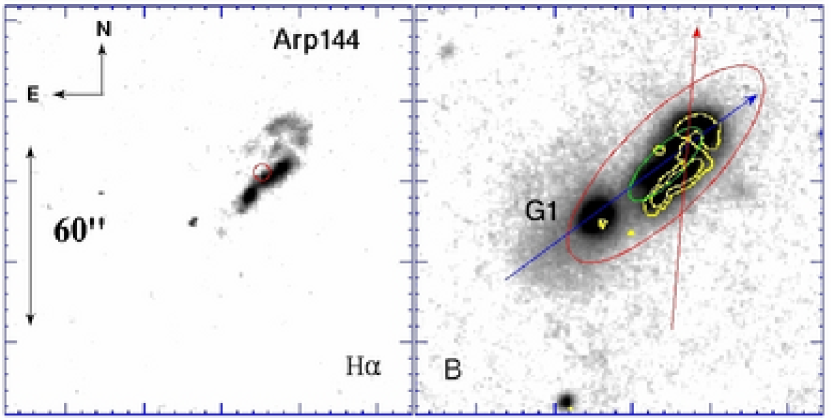
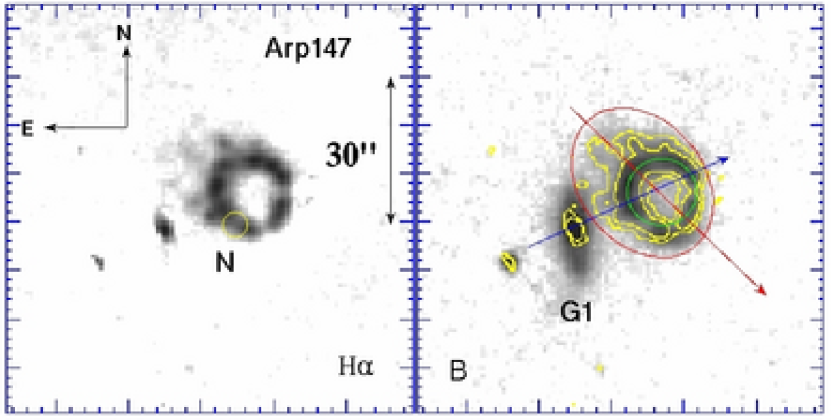
Top: Intensities on the gray-scale images are shown on a logarithmic scale, with the specific purpose of illustrating the faint ionized gas on the H images, and the disk external to the ring on the -band images. Some of the bright structures that are saturated on these plots can be visualized clearly on the color composite images in Figure 2. The contours of H intensities are superposed on the -band image, with the outermost contour corresponding to levels (see the column 7 of Table 4), and the subsequent contours brighter by factors of 4. Best-matched ellipses to the ring (green; inner ellipse) and the disk (red; outer ellipse) are shown. A small open circle superposed on the H image, indicates the position of the nucleus. The most likely intruder galaxy is identified by G1. When a second companion galaxy is seen, it is identified by G2. The orientation, as well as the image scale are indicated on the panel corresponding to the H image. The two arrows on the -band image indicate the direction of the cuts corresponding to the plots on the bottom right.
Bottom left: Azimuthally averaged radial profiles of intensity and colors, along with errors on them. Azimuthal averaging is done along the ellipse that best represents the ring (displayed in green on the -band image; see Table 4 for the ellipse parameters). The ring radius (the position of the peak in the H profile), and disk radius (the position where mag arcsec-2) are shown by the inner and outer vertical dotted lines, respectively. Note that the nucleus and companions were masked in obtaining these radial profiles (see text for details). In three cases (IZw45, IIZw28 and Arp291), masking could not be implemented in a meaningful way because the nuclear light affects more than half of the ring. We hence display the profiles taken on the unmasked images for these galaxies.
Bottom right: Cuts in intensity and color along two representative position angles. One of these cuts (shown by the red arrow on the -band image) is carefully chosen to pass through the faint parts of the ring (i.e. avoiding any bright H ii regions), with the intention of illustrating the characteristics of the faint diffuse parts of the ring, that do not contribute much to azimuthal profiles. The top three panels show the corresponding profiles. The radius of the ring as measured on the azimuthally averaged H profile is shown by the vertical dotted lines on these plots. Note that the cuts do not necessarily pass through the ring-center, and the origin of the x-axis is chosen to be the point closest to the ring-center, and the distance increases towards the tip of the arrow. The second cut passes through the ring and the nucleus of the companion. The -band and color profiles corresponding to this cut are shown by the solid and dotted lines, respectively, in the bottom most graph. These intensity and color cuts allow us to appreciate the actual gradients without the effects of azimuthal averaging. Note that the ring is relatively blue, and emits in the H line even in the parts where there is no bright H ii regions. The last plot also enables us to compare the relative colors, sizes, and separation of the disk, ring and the companion.
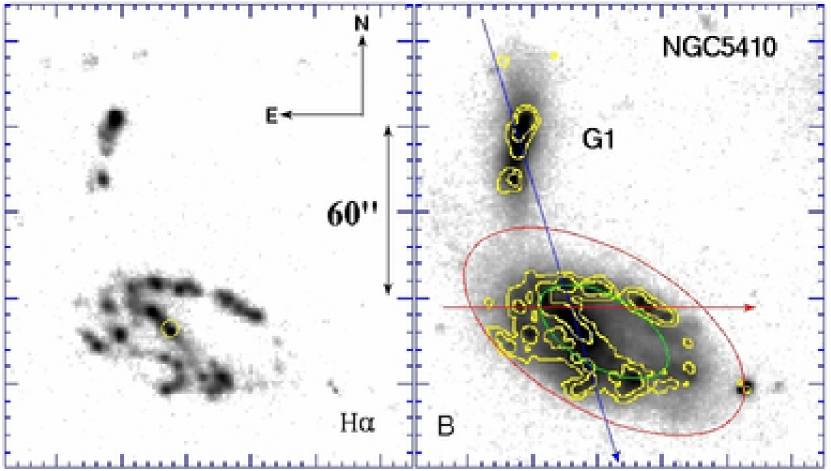
In Figure 22, we show the gray-scale maps of Arp143 in H
bands. Gray-scale maps for the rest of the galaxies are available
at the website http://www.inaoep.mx/ydm/rings/.
Fits files in all these bands will also be made available at this site.
We have obtained the -band images for three galaxies (Arp147, IIHz4,
NGC2793) which also form part of the gray-scale maps and our dataset.
Arp141: The ring in this galaxy is defined by compact knots of H emission. Several regions of extended emission are seen inside this ring, which also have corresponding continuum emission. The underlying disk is circular, whereas the ring is clearly elliptical (eccentricity=0.16). The ring on the eastern side almost coincides with the edge of the disk, whereas it is only half way through the disk on the western side. The nucleus is seen outside the ring, along the line joining the ring with the companion. The companion galaxy has tidal streams, and is clearly participating in the collision. Note that the companion is seen along the major axis of the ring — a unique case among the known ring galaxies.
Arp142: No ring structure can be defined in this arc-like galaxy. Hence, the plotted ellipse is not a match to the ring, and is used only to obtain azimuthally averaged profiles. Note that the nucleus is located at the northern part of the arc, from where most of the H emission originates. The position of the 20 cm radio continuum emission mapped by Mollenhoff et al. (1992) coincides with the bright H emitting zone. At longer wavelengths, a two-armed spiral structure is clearly seen emanating from the nucleus. Faint H emission is detected from the edges of the arc seen in the continuum bands. There is a second candidate for the intruder (G2), which shows faint H emission, and is bluer than the ring galaxy. The bright object along the major axis of G2 is a foreground star.
Arp143: Ring is very well defined by the distribution of H ii regions, with most of the H emission originating from the northwestern arc. The H emission is also detected from the nucleus. The stellar disk can be clearly traced outside the ring, and has similar ellipticity as the ring. However, the ring is offset both in center and P.A. with respect to the disk. The nucleus is not exactly located at the ring center and is pulled towards the companion. The farther side of the companion shows tidal streams. There is considerable azimuthal asymmetry in the disk brightness outside the ring in all the bands. Our multi-band images confirm the sharp decrease of intensity on the western side of the galaxy that was reported by Appleton et al. (1992).
Arp144: A clear ring is not seen either in H or in continuum bands and the definition of the ellipse was based on the partial ring that can be traced in the H. The companion galaxy shows signs of interaction, in the form of stripped stars on the side opposite to the ring galaxy. The system does not appear to belong to the classical Lynds & Toomre (1976) scenario, and is often considered to be the result of stripping of the gaseous disk from a spiral galaxy during the collision with an intergalactic HI cloud (Higdon, 1988) following a proposal by Freeman & de Vaucouleurs (1974).
Arp145: The ring is broad in the continuum, especially on the southwestern side, where it is also considerably brighter and bluer and than the opposite side. The H emission is weak, and is confined to the nucleus and a few other knots in the ring. A visual extinction value of mag is inferred for this galaxy by comparing the SFR derived by H and FIR. Color profiles suggest that most of this dust lies on the northeast side of the ring. Two bright objects to the southwest of the nucleus are foreground stars.
Arp147: This classical empty ring galaxy is the brightest H emitter in our sample (leaving out NGC985, where the Seyfert nucleus is responsible for the emission), with the emitting compact knots more or less uniformly distributed in the ring. The space between the knots in the ring is also filled with diffuse H emission. Note that there is no compact H knot associated with the nucleus, which is extremely red and gives a crescent shape to the ring in the -band. Several filamentary structures on the northeastern segment can be noticed in the H image. The observed crescent structure and the displaced nucleus have been reproduced by Gerber et al. (1992), using stellar and gas dynamical models, with G1 as the intruder. The H emission associated with the companion G1, and a foreground star to its southeast, is not significant given the errors expected in the subtraction of continuum image from these bright continuum sources.
Arp148: H emission is uniformly distributed in the ring, with the only knot coinciding with the brightest knot on the -band image. We identify this knot as the nucleus. The H emitting knot eastward of the ring is most likely associated with the companion. The companion is elongated along the east-west direction, splitting into two objects separated by 7″ in the -band. The -band and H fluxes are maximum between the two -band knots. A visual extinction value of mag is inferred for this system by comparing the SFR derived by H and FIR. The observed multi-band morphology of this galaxy suggests that most of the dust is associated with the H emitting region of the companion. The double lobe structure of the companion at shorter wavelengths is due to the obscuration caused by this dust cloud.
Arp291: H emission in this galaxy is not associated with the ring that is seen in the continuum bands. Most of the H emission comes from regions surrounding the nucleus, and extends along a filament along the minor axis of the ring. The H emission at the nucleus itself is weak. A faint spur seen on the northeastern side of the nucleus on the continuum images gives this galaxy an appearance of a tightly-wound one-armed spiral, and hence this galaxy may not be a classical ring galaxy. There is no spectroscopically confirmed companion for this galaxy. We identify the most likely companion by G1.
IIHz4: Ring is very well defined both on the H and continuum images of this classical double ring galaxy. The faint second ring can be seen to the north of the main ring on the continuum images, and is denoted by R2. H emission is not detected from the second ring. Nucleus of both the rings is identified. There is an H emitting region without noticeable continuum emission, outside the ring, just south of it. A bright blue star is responsible for the glare seen to the north of the ring galaxy. This glare didn’t permit us to show the second ring on our -band image and hence the -band image is displayed.
IZw45: H emission traces most of the ring, with the brightest H emitting region coinciding with the nucleus. The continuum ring is slightly flatter and bigger than the H ring. The continuum images show a bridge that connects the nucleus of the ring galaxy to the companion. This is the only galaxy where the colors at the center of the ring are bluer than at the ring itself. This is most likely due to the contamination of the radial profiles by the presence of the nucleus that extends all the way to the center of the ring..
IIZw28: The ring can be traced both in the H and continuum bands of this galaxy. Most of the H emission comes from the northern segment that includes the nucleus. There is no spectroscopically confirmed companion to this galaxy. We identify the most likely companion by G1.
VIIZw466: Most of the H emission originates from the western half of the ring, with hardly any emission detected from the red nucleus. Comparable H emission is also detected from the edge-on companion G2. This detection confirms the earlier suggestion of star formation activity in this galaxy by Appleton et al. (1999) based on mid infrared emission. Appleton, Charmandaris & Struck (1996) had confirmed G2 as the intruder galaxy responsible for the ring in VIIZw466. The object to the northwest of G1 is a background galaxy.
NGC985: The nucleus of this ring galaxy is known for its Seyfert activity (Rodriguez-Espinosa & Stanga, 1990), and is bright on both the H and continuum images. The H emission traces only the western segment of the ring. No companion can be identified within a few disk diameters of this galaxy.
NGC2793: The ring in this galaxy is traced by the H emitting knots. The nucleus is located at the southern end of a bar-like elongation. Patchy H emission is detected all along the bar. A compact knot of emission appears on the southern part of the disk outside the ring. Faint diffuse H emission can be detected throughout the internal part of the ring.
NGC5410: In morphology, this galaxy resembles a disturbed barred spiral galaxy, rather than a ring galaxy. H emission is detected from throughout the galaxy and its companion. The companion shows clear signs of interaction.
References
- Appleton, Charmandaris & Struck (1996) Appleton, P. N., Charmandaris, V., & Struck, C. 1996, ApJ, 468, 532
- Appleton et al. (1999) Appleton, P. N., Charmandaris, V., Horellou, C., Mirabel, I. F., Ghigo, F., Higdon, J. L., & Lord, S. 1999, ApJ, 527, 143
- Appleton & Marston (1997) Appleton P. N., & Marston, A. P. 1997, AJ, 113, 201
- Appleton & Struck-Marcell (1987) Appleton, P. N., & Struck-Marcell, C. 1987, ApJ, 312, 566
- Appleton & Struck-Marcell (1996) Appleton, P. N. & Struck-Marcell, C. 1996, Fundamentals of Cosmic Physics, 16, 111
- Appleton et al. (1992) Appleton, P. N., Schombert, J. M., & Robson, E. I. 1992, ApJ, 385, 491
- Arp (1966) Arp, H. 1966, ApJS, 14, 1
- Barway et al. (2005) Barway, S., Mayya, Y. D., Kembhavi, A. K., & Pandey, S. K. 2005, AJ, 129, 630
- Bell et al. (2003) Bell, E. F., McIntosh, D. H., Katz, N., & Weinberg, M. D. 2003, ApJS, 149, 289
- Bessell (1990) Bessell, M. S. 1990, PASP, 102, 1181
- Bizyaev, Moiseev, & Vorobyov (2007) Bizyaev, D. V., Moiseev, A. V., Vorobyov, E. I., 2007, ApJ, 662, 304
- Bonoli (1987) Bonoli, C. 1987, A&A, 174, 57
- Bransford et al. (1998) Bransford, M. A., Appleton P. N., Marston, A. P., & Charmandaris, V. 1998, AJ, 116, 2757
- Burbidge & Burbidge (1959) Burbidge, E. M., & Burbidge, G. R. 1959, ApJ, 130, 12
- Buta (1996) Buta, R. 1996, AJ, 111, 591
- Chevalier & Ilovaisky (1991) Chevalier, C., & Ilovaisky, S. A. 1991, A&AS, 90, 225
- Cruz-Gonzalez et al. (1994) Cruz-Gonzalez, I., Carrasco, L., Ruiz, E., Salas, L., et al. 1994, RMxAA, 29, 197
- de Jong (1996) de Jong, R. S. 1996, A&A, 313, 377
- de Vaucouleurs et al. (1991) de Vaucouleurs, G., de Vaucouleurs, A., Corwin, H. G., et al. 1991, Third Reference Catalogue of Bright Galaxies Springer-Verlag: New York (RC3)
- Fan et al. (1996) Fan, X. et al. 1996, AJ, 112, 628
- Fosbury & Hawarden (1977) Fosbury, R. A. E., & Hawarden, T. G. 1977, MNRAS, 178, 473
- Freeman (1970) Freeman, K. C. 1970, ApJ, 160, 811
- Freeman & de Vaucouleurs (1974) Freeman, K. C., & de Vaucouleurs, G. 1974, ApJ, 194, 569
- Gerber et al. (1992) Gerber, R. A., Lamb, S. A., & Balsara, D. S. 1992, ApJ, 399, L51
- Gerber et al. (1996) Gerber, R. A., Lamb, S. A., & Balsara, D. S. 1996, MNRAS, 278, 345
- Hattori et al. (2004) Hattori, T. et al. 2004, AJ, 127, 736
- Higdon (1988) Higdon, J. L. 1988, ApJ, 326, 146
- Higdon (1995) Higdon, J. L. 1995, ApJ, 455, 524
- Higdon (1996) Higdon, J. L. 1996, ApJ, 467, 241
- Higdon et al. (1997) Higdon, J. L., Rand, R. J., & Lord, S. D. 1997, ApJ, 489, L133
- Hirashita et al. (2003) Hirashita, H., Buat, V., & Inoue, A. K. 2003, A&A, 410, 83
- Horellou et al. (1995) Horellou, C., Casoli, F., Combes, F., & Dupraz, C. 1995, A&A, 298, 743
- Hunt et al. (1998) Hunt, L.K., Mannucci, F., Testi, L., Migliorini, S. et al. 1998, AJ, 115, 2594
- Jeske (1986) Jeske, N.A. 1986, Ph.D. Thesis, University of California, Berkeley
- Kennicutt (1998) Kennicutt, R. C., Jr. 1998, ARA&A, 36, 189
- Kennicutt et al. (1987) Kennicutt, R. C., Keel, W. C., van der Hulst, J. M., Hummel, E., & Roettiger, K.A. 1987, AJ, 93, 1011
- Korchagin et al. (2001) Korchagin, V., Mayya, Y. D., & Vorobyov, E. I. 2001, ApJ, 554, 281
- Landolt (1992) Landolt, A. U. 1992, AJ, 104, 340
- Lynds & Toomre (1976) Lynds, R., & Toomre, A. 1976, ApJ, 209, 382
- Marcum et al. (1992) Marcum, P. M., Appleton, P. N., & Higdon, J. L. 1992, ApJ, 399, 57
- Marston & Appleton (1995) Marston, A. P., & Appleton, P. N. 1995, AJ, 109, 1002
- Martin & Kennicutt (2001) Martin, C. L., & Kennicutt, R. C., Jr. 2001, ApJ, 555, 301
- Mayya (1991) Mayya, Y. D. 1991, Journal of Astrophysics and Astronomy, 12, 319
- Mayya et al. (2005) Mayya, Y. D., Bizyaev, D., Romano, R., Garcia-Barreto, J. A., & Vorobyov, E. I. 2005, ApJ, 620, L35
- Mazzei et al. (1995) Mazzei, P., Curir, A., & Bonoli, C. 1995, AJ, 110, 559
- Mollenhoff et al. (1992) Mollenhoff, C., Hummel, E., & Bender, R. 1992, A&A, 255, 35
- Namboodiri et al. (2006) Namboodiri, P. M. S., Sastry, K. S., & Narasimhan, K. S. V. V. S. 2006, Ap&SS, 301, 3
- Oke (1990) Oke, J. B. 1990, AJ, 99, 1621
- Osterbrock (1989) Osterbrock, D. E. 1989, Astrophysics of Gaseous Nebulae and Active Galactic Nuclei (California: University Science Books)
- Panuzzo et al. (2003) Panuzzo, P., Bressan, A., Granato, G. L., Silva, L., & Danese, L. 2003, A&A, 409, 99
- Rodriguez-Espinosa & Stanga (1990) Rodriguez-Espinosa, J.M., & Stanga, R.M. 1990, ApJ, 365
- Theys & Spiegel (1976) Theys, J. C., & Spiegel, E. A. 1976, ApJ, 208, 650
- Theys & Spiegel (1977) Theys, J. C., & Spiegel, E. A. 1977, ApJ, 212, 616
- Vorobyov & Bizyaev (2001) Vorobyov, E. I., & Bizyaev, D. 2001 A&A, 377, 835
| Galaxy | Other names | V0 | Scale | Dia | |||
|---|---|---|---|---|---|---|---|
| h m | o ′ | km s-1 | pc arcsec-1 | ″ | mag | ||
| Arp144 | NGC7828/9 | 00 06.49 | 13 25.25 | 5888 | 402 | 14.8 | |
| Arp145 | VZw229, A0220+41A/B, UGC1840 | 02 23.14 | +41 22.33 | 5357 | 371 | 63.2 | 14.3 |
| NGC985 | Mrk1048, VV285 | 02 34.63 | 08 47.26 | 12948 | 897 | 35.0 | 14.1 |
| Arp147 | IZw11, IC298A/B, VV787 | 03 11.31 | +01 18.95 | 9660 | 669 | 16.3 | 15.7 |
| IIZw28 | A0459+03, VV790B | 05 01.73 | +03 34.52 | 8572 | 594 | 14.0 | 15.6 |
| Arp141 | UGC3730, VV123 | 07 14.35 | +73 28.52 | 2874 | 199 | 75.9 | 14.5 |
| Arp143 | NGC2444/5, UGC4016/7, VV117 | 07 46.87 | +39 00.60 | 4017 | 278 | 84.5 | 13.6 |
| IIHz4 | A0855+37 | 08 58.55 | +37 05.19 | 12862 | 891 | 29.0 | 15.7 |
| NGC2793 | UGC4894 | 09 16.79 | +34 25.79 | 1644 | 114 | 56.0 | 14.2 |
| Arp142 | NGC2936/7, UGC5130/1, VV316 | 09 37.75 | +02 45.52 | 6794 | 471 | 81.0 | 14.0 |
| Arp291 | UGC5832,VV112 | 10 42.81 | +13 27.60 | 1084 | 75 | 58.0 | 14.3 |
| Arp148 | Mayall, A1101+41 | 11 03.90 | +40 51.00 | 10363 | 718 | 20.3 | 15.1 |
| VIIZw466 | A1229+66 | 12 31.94 | +66 24.68 | 14341 | 993 | 22.0 | 15.6 |
| IZw45 | NGC4774 | 12 53.11 | +36 49.10 | 8314 | 576 | 23.0 | 14.9 |
| NGC5410 | UGC8931, VV256 | 14 00.91 | +40 59.30 | 3785 | 262 | 60.0 | 14.4 |
| Galaxy | Run | B | V | R | I | ) | H | ) | H | Run | J | H | K |
|---|---|---|---|---|---|---|---|---|---|---|---|---|---|
| Mon-Yr | Sec | Sec | Sec | Sec | nm | Sec | nm | Sec | Mon-Yr | Sec | Sec | Sec | |
| Arp144 | Dec-01 | 1800 | 600 | 600 | 360 | 668 | 3600 | Dec-00 | 840 | 600 | 630 | ||
| Arp145 | Oct-02 | 1200 | 900 | 600 | 600bbThe observing run for this filter is different from the rest of the filters: Feb-00 (Arp145-I), Dec-01 (NGC985-H and Arp147-H), Dec-00 (IIZw28-H). | 668 | 3600 | 662 | 2400 | Dec-99 | 1080 | 720 | 1200 |
| NGC985 | Feb-02 | 1800 | 1200 | 900 | 540 | 686 | 2700bbThe observing run for this filter is different from the rest of the filters: Feb-00 (Arp145-I), Dec-01 (NGC985-H and Arp147-H), Dec-00 (IIZw28-H). | 674 | 1800 | Oct-01 | 1080 | 480 | 600 |
| Arp147 | Dec-01 | 1800 | 1800 | 1200 | 600 | 674 | 5400bbThe observing run for this filter is different from the rest of the filters: Feb-00 (Arp145-I), Dec-01 (NGC985-H and Arp147-H), Dec-00 (IIZw28-H). | 662 | 3600 | Dec-99 | 720 | 600 | 1200 |
| IIZw28 | Feb-00 | 600 | 1200 | 300 | 300 | 674 | 5400bbThe observing run for this filter is different from the rest of the filters: Feb-00 (Arp145-I), Dec-01 (NGC985-H and Arp147-H), Dec-00 (IIZw28-H). | Mar-00 | 960 | 840 | 660 | ||
| Arp141 | Feb-00 | 900 | 600 | 300 | 600 | 662 | 3600 | 2MASS | |||||
| Arp143 | Feb-00 | 900 | 600 | 900 | 1200 | 662 | 3600 | Dec-99 | 1080 | 900 | 1500 | ||
| IIHz4 | Feb-00 | 1200 | 300 | 900 | 600 | 686 | 3600 | Mar-00 | 960 | 780 | 630 | ||
| NGC2793 | Feb-00 | 600 | 300 | 900 | 300 | 656 | 3600 | Dec-99 | 2160 | 540 | 390 | ||
| Arp142 | Feb-00 | 600 | 300 | 600 | 300 | 668 | 3600 | Dec-99 | 1080 | 600 | 675 | ||
| Arp291 | Feb-00 | 600 | 480 | 300 | 300 | 656 | 3600 | Dec-99 | 600 | 660 | 450 | ||
| Arp148 | Dec-01 | 1800 | 1200 | 600 | 600 | 680 | 3600 | 668 | 1800 | Mar-02 | 1020 | 900 | 1050 |
| VIIZw466 | Feb-00 | 600 | 600 | 600 | 300 | 686 | 3600 | 2MASS | |||||
| IZw45 | Feb-00 | 900 | 900 | 600 | 600 | 674 | 3600 | 2MASS | |||||
| NGC5410 | Feb-02 | 1800 | 1200 | 1200 | 600 | 662 | 7200 | 674 | 4800 | Mar-02 | 1440 | 1800 | 1320 |
| Quantity | B | V | R | I | H656 | H662 | H668 | H674 | H680 | H686 |
|---|---|---|---|---|---|---|---|---|---|---|
| Feb-00 (M67-DA) | ||||||||||
| 23.30 | 23.74 | 22.47 | 23.35 | 9.82 | 8.72 | 8.54 | 8.50 | 8.51 | 9.22 | |
| rms | 0.01 | 0.01 | 0.01 | 0.01 | 0.02 | 0.03 | 0.03 | 0.03 | 0.03 | 0.03 |
| Dec-01 (PG0231+051) | ||||||||||
| 23.04 | 23.61 | 22.40 | 23.19 | 8.92 | 7.95 | 7.94 | 7.75 | 7.85 | 8.26 | |
| rms | 0.04 | 0.03 | 0.07 | 0.04 | 0.01 | 0.01 | 0.02 | 0.02 | 0.01 | 0.02 |
| Feb-02 (M67-DA) | ||||||||||
| 22.97 | 23.52 | 22.38 | 23.22 | 10.23 | 9.10 | 8.97 | 8.94 | 9.04 | 9.63 | |
| rms | 0.03 | 0.04 | 0.05 | 0.04 | 0.03 | 0.03 | 0.02 | 0.02 | 0.02 | 0.01 |
| Oct-02 (PG0231+051) | ||||||||||
| 22.60 | 23.21 | 22.15 | 23.35 | 13.01 | 13.04 | 13.23 | 13.16 | 13.25 | ||
| rms | 0.03 | 0.02 | 0.05 | 0.01 | 0.03 | 0.03 | 0.03 | 0.03 | 0.03 | |
| 0.11 | 0.06 | 0.50 | 0.03 | 0.00 | 0.00 | 0.00 | 0.00 | 0.00 | 0.00 |
| Galaxy | (J2000) | (J2000) | PA | aaLimiting (5) H intensity in units of erg cm-2 s-1 arcsec-2 (column 7) and -band surface brightness in mag arcsec-2 (column 8) of the azimuthally averaged profiles. | aaLimiting (5) H intensity in units of erg cm-2 s-1 arcsec-2 (column 7) and -band surface brightness in mag arcsec-2 (column 8) of the azimuthally averaged profiles. | ||
|---|---|---|---|---|---|---|---|
| ″ | |||||||
| Arp141 | 108.5953 | 73.46458 | 26 | 0.16 | 17 | 0.194 | 24.94 |
| Arp142 | 144.4309 | 2.755613 | 38 | 0.62 | 40 | 1.092 | 24.72 |
| Arp143 | 116.7312 | 39.01426 | 36 | 0.32 | 60 | 0.762 | 24.62 |
| Arp144 | 1.6132 | 13.41494 | 16 | 0.65 | 45 | 1.717 | 24.35 |
| Arp145bbEllipse parameters based on the -band ring. | 35.7846 | 41.37402 | 22 | 0.11 | 35 | 0.784 | 23.75 |
| Arp147 | 47.8264 | 1.31554 | 7 | 0.05 | 90 | 1.102 | 24.61 |
| Arp148 | 165.9702 | 40.85075 | 9 | 0.23 | 28 | 0.982 | 24.58 |
| Arp291bbEllipse parameters based on the -band ring. | 160.7041 | 13.45734 | 27 | 0.35 | 81 | 1.525 | 24.62 |
| IIHz4 | 134.6393 | 37.08633 | 14 | 0.22 | 77 | 1.123 | 24.83 |
| IZw45 | 193.2774 | 36.81840 | 10 | 0.42 | 90 | 2.147 | 24.74 |
| IIZw28 | 75.4244 | 3.57377 | 6 | 0.10 | 60 | 1.580 | 24.51 |
| VIIZw466 | 188.0200 | 66.40405 | 11 | 0.28 | 0 | 1.659 | 24.38 |
| NGC985bbEllipse parameters based on the -band ring. | 38.6558 | 8.78552 | 14 | 0.20 | 72 | 1.202 | 24.82 |
| NGC2793 | 139.1924 | 34.43203 | 19 | 0.17 | 90 | 1.944 | 24.37 |
| NGC5410 | 210.2242 | 40.98832 | 25 | 0.49 | 60 | 0.668 | 24.75 |
| Galaxy | RB25[″] | |||||||
|---|---|---|---|---|---|---|---|---|
| Arp141 | 43 | 14.39 0.07 | 0.54 0.01 | 1.02 0.01 | 0.91 0.01 | 2.70 0.06 | 0.77 0.02 | 0.200.04 |
| Arp142 | 68 | 14.18 0.07 | 0.76 0.02 | 1.69 0.02 | 1.24 0.01 | 3.67 0.05 | 1.05 0.01 | 0.280.01 |
| Arp143 | 70 | 13.30 0.08 | 0.57 0.02 | 1.22 0.02 | 0.99 0.01 | 2.93 0.06 | 0.87 0.01 | 0.280.01 |
| Arp144 | 43 | 14.09 0.03 | 0.50 0.01 | 1.03 0.01 | 1.07 0.01 | 3.07 0.02 | 0.90 0.01 | 0.270.01 |
| Arp145 | 40 | 14.41 0.31 | 0.82 0.18 | 1.30 0.15 | 1.11 0.12 | 2.89 0.13 | 0.80 0.01 | 0.420.01 |
| Arp147 | 17 | 15.99 0.05 | 0.42 0.03 | 0.74 0.01 | 0.97 0.02 | 2.87 0.03 | 1.07 0.01 | 0.430.01 |
| Arp148 | 16 | 16.04 0.03 | 0.45 0.01 | 0.91 0.01 | 1.03 0.02 | 3.13 0.02 | 1.05 0.02 | 0.460.02 |
| Arp291 | 43 | 14.23 0.07 | 0.45 0.01 | 0.79 0.08 | 0.79 0.02 | 2.69 0.06 | 0.81 0.02 | 0.120.01 |
| IIHz4 | 20 | 16.00 0.05 | 0.90 0.02 | 1.57 0.04 | 1.30 0.01 | 3.36 0.03 | 0.85 0.01 | 0.180.01 |
| IZw45 | 23 | 14.95 0.04 | 0.68 0.02 | 0.88 0.04 | 0.90 0.01 | 3.06 0.03 | 1.04 0.02 | 0.370.02 |
| IIZw28 | 14 | 15.62 0.04 | 0.35 0.02 | 0.75 0.03 | 0.73 0.04 | 2.30 0.03 | 0.80 0.03 | 0.230.03 |
| VIIZw466 | 17 | 15.74 0.09 | 0.35 0.05 | 0.68 0.02 | 0.80 0.02 | 2.78 0.05 | 0.97 0.03 | 0.030.02 |
| NGC985 | 28 | 14.42 0.03 | 0.60 0.01 | 1.06 0.04 | 1.21 0.07 | 3.43 0.03 | 1.21 0.01 | 0.390.01 |
| NGC2793 | 37 | 13.77 0.04 | 0.38 0.01 | 0.64 0.01 | 0.75 0.02 | 2.39 0.05 | 0.96 0.01 | 0.350.01 |
| NGC5410 | 54 | 14.00 0.04 | 0.41 0.01 | 0.81 0.01 | 0.90 0.02 | 2.54 0.03 | 0.78 0.01 | 0.280.02 |
| Galaxy | |||||||
|---|---|---|---|---|---|---|---|
| Arp141-G1 | 14.41 0.08 | 0.86 0.03 | 1.45 0.02 | 1.24 0.01 | 3.48 0.04 | 1.21 0.01 | 0.03 0.04 |
| Arp142-G1 | 14.89 0.09 | 0.91 0.03 | 1.92 0.04 | 1.33 0.01 | 3.63 0.06 | 0.95 0.01 | 0.23 0.01 |
| Arp142-G2 | 16.88 0.16 | 0.40 0.02 | 1.07 0.02 | 1.24 0.03 | 2.22 0.19 | 0.58 0.07 | 0.32 0.01 |
| Arp143-G1 | 14.29 0.11 | 1.05 0.06 | 1.88 0.07 | 1.25 0.01 | 3.42 0.05 | 0.98 0.01 | 0.19 0.01 |
| Arp144-G1 | 14.65 0.08 | 0.62 0.03 | 1.12 0.02 | 1.07 0.01 | 2.89 0.05 | 0.81 0.01 | 0.13 0.01 |
| Arp145-G1 | 14.85 0.14 | 1.19 0.10 | 1.80 0.10 | 1.30 0.02 | 3.38 0.03 | 0.92 0.01 | 0.29 0.01 |
| Arp147-G1 | 16.39 0.04 | 0.88 0.03 | 1.59 0.02 | 1.25 0.01 | 3.56 0.01 | 1.07 0.01 | 0.37 0.01 |
| Arp148-G1 | 15.36 0.02 | 0.54 0.01 | 1.06 0.01 | 1.10 0.01 | 3.50 0.01 | 1.13 0.01 | 0.48 0.02 |
| Arp291-G1 | 17.90 0.24 | 0.70 0.09 | 1.06 0.14 | 1.01 0.02 | 3.12 0.16 | 0.94 0.06 | 0.23 0.01 |
| IIHz4-R2aaMajor contribution to the photometry comes from the nucleus of R2. | 16.34 0.12 | 0.51 0.02 | 1.17 0.06 | 1.95 0.08 | 2.99 0.11 | 0.53 0.02 | 0.05 0.01 |
| IZw45-G1 | 17.27 0.04 | 0.59 0.01 | 0.87 0.04 | 0.65 0.02 | 2.16 0.08 | 0.52 0.09 | 0.02 0.01 |
| IIZw28-G1? | 20.18 0.33 | 1.46 0.73 | 1.38 0.25 | 1.06 0.18 | 3.54 0.13 | 1.40 0.10 | 0.62 0.02 |
| VIIZw466-G1 | 16.42 0.08 | 1.02 0.06 | 1.74 0.04 | 1.25 0.01 | 3.28 0.02 | 0.89 0.02 | 0.16 0.02 |
| VIIZw466-G2 | 16.93 0.14 | 0.64 0.10 | 1.02 0.03 | 1.02 0.01 | 2.69 0.06 | 0.66 0.05 | 0.32 0.02 |
| NGC2793-G1 | 17.07 0.10 | 0.65 0.02 | 1.17 0.05 | 0.87 0.02 | 2.42 0.08 | 0.62 0.03 | 0.19 0.01 |
| NGC5410-G1 | 15.52 0.07 | 0.40 0.01 | 0.78 0.01 | 0.90 0.03 | 2.73 0.06 | 1.06 0.03 | 0.53 0.01 |
| Galaxy | (H[Nii]) | EW(H[Nii]) | (FIR) | f(20cm) | SFR(FIR) | Av | frac(th) |
|---|---|---|---|---|---|---|---|
| erg cm-2 s-1 | Å | W m-2 | mJy | M yr-1 | mag | ||
| Arp141 | 0.05 | 12.8 2.8 | 0.26 | 1.03 | 0.49 | ||
| Arp142 | 0.07 | 20.9 7.2 | 2.30 | 10.74 | 2.50 | 0.86 | |
| Arp143 | 0.05 | 23.0 8.0 | 4.15 | 5.60 | 1.91 | 0.70 | |
| Arp144 | 0.09 | 19.5 4.6 | 13.20 | 6.86 | 2.88 | 0.13 | |
| Arp145 | 0.20 | 1.1 0.4 | 1.61 | 2.69 | 4.39 | 0.50 | |
| Arp147 | 0.04 | 175.4 15.8 | 2.00 | 8.58 | 1.40 | 0.39 | |
| Arp148 | 0.09 | 37.6 4.8 | 23.80 | 65.06 | 5.47 | 0.22 | |
| Arp291 | 0.12 | 55.3 24.2 | 0.06 | ||||
| IIHz4 | 0.11 | 26.8 5.7 | 0.74 | 8.95 | 2.41 | 0.62 | |
| IZw45 | 0.04 | 90.1 23.3 | 9.99 | 12.10 | 2.01 | 0.15 | |
| IIZw28 | 0.05 | 81.5 11.9 | 1.66 | 3.82 | 1.30 | 0.27 | |
| VIIZw466 | 0.08 | 49.5 19.7 | 0.83 | 7.80 | 2.16 | 0.39 | |
| NGC985 | 0.02 | 77.2 10.1 | 10.00 | 21.61 | 0.85 | 0.11 | |
| NGC2793 | 0.08 | 43.7 14.5 | 0.24 | 0.91 | 1.27 | ||
| NGC5410 | 0.07 | 44.2 6.8 | 1.73 | 1.34 | 0.97 | 0.46 |
| Galaxy | Reasons for rejection |
|---|---|
| Arp142 | only an arc is traced both in the continuum and H images |
| Arp144 | only broken arcs are traced in both the continuum and H images |
| Arp145 | diffuse ring present in the continuum, but not traced in H |
| Arp291 | ring resembles a one-armed spiral emanating at the end of a bar |
| NGC985 | ring resembles a one-armed spiral emanating at the end of a bar |
| NGC5410 | ring resembles a two-armed spiral structure emanating from the ends of a bar. |
| Galaxy | |||||||
|---|---|---|---|---|---|---|---|
| mag | M | M | kpc | ||||
| Arp141 | 21.78 | 0.83 | 0.49 | 0.99 | 0.52 | 5.2 | 0.61 |
| Arp143 | 23.86 | 6.05 | 1.34 | 0.63 | 1.01 | 9.9 | 0.51 |
| Arp147 | 22.88 | 2.11 | 1.04 | 0.31 | 0.57 | 4.8 | 0.46 |
| Arp148 | 23.23 | 3.10 | 1.54 | 0.54 | 0.50 | 6.2 | 0.58 |
| IIHz4 | 24.44 | 11.57 | 1.34 | 3.49 | 12.1 | 0.70 | |
| IZw45 | 24.02 | 6.27 | 0.25 | 0.47 | 22.00 | 4.9 | 0.37 |
| IIZw28 | 22.34 | 1.28 | 0.44 | 3.5 | 0.44 | ||
| VIIZw466aaTaking G2 as the companion. if G1 is the companion. | 23.80 | 4.83 | 0.65 | 1.18 | 2.49 | 11.0 | 0.63 |
| NGC2793 | 20.71 | 0.28 | 0.12 | 19.31 | 2.1 | 0.50 |
| 1:1 | 1:4 | 1:10 |
|---|---|---|
| Arp141 | IIHz4 | IZw45 |
| Arp143 | NGC2793 | |
| Arp147 | IIZw28 | |
| Arp148 | ||
| VIIZw466 |