NEMO 3 double beta decay experiment: latest results
Abstract
The double beta decay experiment NEMO 3 has been taking data since February 2003. The aim of this experiment is to search for neutrinoless decay and investigate two neutrino double beta decay in seven different enriched isotopes (100Mo, 82Se, 48Ca, 96Zr, 116Cd, 130Te and 150Nd). After analysis of the data corresponding to 693 days, no evidence for decay in 100Mo and 82Se was found. The half-life limits at 90 C.L. are y and y, respectively. Using 940 days of data, preliminary results were obtained for 48Ca, 96Zr and 150Nd. For two neutrino decay half-life values were measured, y, y and y. Also for decay the following limits at 90 C.L. were obtained, y for 48Ca, y for 96Zr and y for 150Nd.
1 Introduction
Interest in neutrinoless double-beta decay has seen a significant renewal in recent years after evidence for neutrino oscillations was obtained from the results of atmospheric, solar, reactor and accelerator neutrino experiments (see, for example, the discussions in [1, 2, 3]). These results are impressive proof that neutrinos have a non-zero mass. However, the experiments studying neutrino oscillations are not sensitive to the nature of the neutrino mass (Dirac or Majorana) and provide no information on the absolute scale of the neutrino masses, since such experiments are sensitive only to the difference of the masses, . The detection and study of decay may clarify the following problems of neutrino physics (see discussions in [4, 5, 6]): (i) lepton number non-conservation, (ii) neutrino nature: whether the neutrino is a Dirac or a Majorana particle, (iii) absolute neutrino mass scale (a measurement or a limit on ), (iv) the type of neutrino mass hierarchy (normal, inverted, or quasidegenerate), (v) CP violation in the lepton sector (measurement of the Majorana CP-violating phases).
The currently running NEMO 3 experiment is devoted to the search for decay and to the accurate measurement of two neutrino double beta decay ( decay) by means of the direct detection of the two electrons. This tracking experiment, in contrast to experiments with 76Ge, detects not only the total energy deposition, but other parameters of the process. These include the energy of the individual electrons, angle between them, and the coordinates of the event in the source plane. Since June of 2002, the NEMO 3 detector has operated in the Fréjus Underground Laboratory (France) located at a depth of 4800 m w.e. Since February 2003, after the final tuning of the experimental set-up, NEMO 3 has been taking data devoted to double beta decay studies. The first obtained results with 100Mo and 82Se were published in [7, 8, 9, 10].
2 The NEMO 3 detector
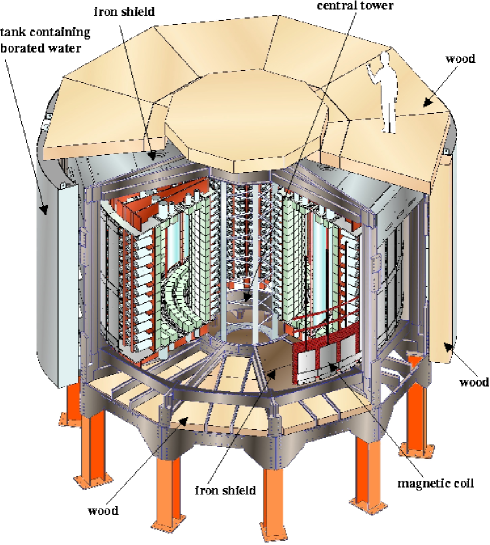
The NEMO 3 detector has three main components, a foil consisting of different sources of double beta decay isotopes and copper, a tracker made of Geiger wire cells and a calorimeter made of scintillator blocks with PMT readout, surrounded by a solenoidal coil. The detector has the ability to discriminate between events of different types by positive identification of charged tracks and photons. A schematic view of the NEMO 3 detector is shown in Fig. 1.
The NEMO 3 detector is cylindrical in design and is composed of twenty equal sectors. The external dimensions of the detector with shields are about 6 m in diameter and 4 m in height. NEMO 3 is based on the techniques tested on previous incarnations of the experiment NEMO 1 [11], and NEMO 2 [12].
The wire chamber is made of 6180 open octagonal drift cells which operate in Geiger mode (Geiger cells). A gas mixture of 95% helium, 4% ethyl-alcohol, 1% argon and 0.15% water at 10 mbar above atmospheric pressure is used as the filling gas of the wire chamber. Each drift cell provides a three-dimensional measurement of the charged particle tracks by recording the drift time and the two plasma propagation times. The transverse position is determined from the drift time, while the longitudinal position is deduced from the difference between the plasma propagation times at both ends of the cathode wires. The average vertex position resolution for the two-electron events is cm in the transverse plane of the detector and cm in the longitudinal plane. The Geiger counters information is treated by the track reconstruction program based on the cellular automaton algorithm, described in [13].
The calorimeter, which surrounds the wire chamber, is composed of 1940 plastic scintillator blocks coupled by light-guides to very low-radioactivity photomultiplier tubes (PMTs) developed by Hammamatsu. The energy resolution FWHM of the calorimeter ranges from 14.1 to 17.6% for 1 MeV electrons, while the time resolution is of 250 ps at 1 MeV.
| Isotope | 100Mo | 82Se | 130Te | 116Cd | 150Nd | 96Zr | 48Ca |
|---|---|---|---|---|---|---|---|
| Enrichment, % | 97 | 97 | 89 | 93 | 91 | 57 | 73 |
| Mass of isotope, g | 6914 | 932 | 454 | 405 | 36.6 | 9.4 | 7.0 |
The apparatus accommodates almost 10 kg of different double beta decay isotopes (see table 1). Most of these isotopes are highly enriched and are shaped in the form of thin metallic or composite foils with a density of 30-60 mg/cm2. Three sectors are also used for external background measurement and are equipped respectively with pure Cu (one sector, 621 g) and natural Te (1.7 sectors, 614 g of natTeO2). Some of the sources, including 100Mo, have been purified in order to reduce their content of 208Tl (from 232Th and 228Th, and from 228Ra with a half-life of 5.75 y) and 214Bi (from 226Ra with a half-life of 1600 y) either by a chemical procedure [14], or by a physical procedure [15]. The foils are placed inside the wire chamber in the central vertical plane of each sector. The majority of the detector, 12 sectors, is mounted with 6.9 kg of 100Mo.
The detector is surrounded by a solenoidal coil which generates a vertical magnetic field of 25 Gauss inside the wire chamber. This magnetic field allows electron-positron identification by measuring the curvature of their tracks. The ambiguity of the e+/e- recognition based on the curvature reconstruction is 3% at 1 MeV.
The whole detector is covered by two types of shielding against external -rays and neutrons. The inner shield is made of 20 cm thick low radioactivity iron which stops -rays and slow neutrons. The outer shield is comprised of tanks filled with borated water on the vertical walls and wood on the top and bottom designed to thermalize and capture neutrons.
At the beginning of the experiment, the radon inside the tracking chamber, and more precisely the its decay product 214Bi present in its radioactive chain was found to be the predominant background. Radon is present in the air of the laboratory and originates from the rock surrounding. It can penetrate the detector through small leaks. A tent coupled to a radon-free air factory was installed around the detector in October 2004 in order to decrease the presence of radon inside the tracker.
Since February 2003, after the final tuning of the experimental set-up, NEMO 3 has routinely been taking data devoted to double beta decay studies. The calibration with radioactive sources is carried out every 6 weeks. The stability of the calorimeter is checked daily with a laser based calibration system [15].
The advantage of the NEMO 3 detector rests in its capability to identify the two electrons from decay and the de-excitation photons from the excited state of the daughter nucleus. The NEMO 3 calorimeter also measures the detection time of the particles. The use of appropriate time-of-flight (TOF) cuts, in addition to energy cuts, allows an efficient reduction of all backgrounds.
A full description of the detector and its characteristics can be found in [15].
3 Experimental results
A candidate for a decay is a two-electron event which is defined with the following criteria: two tracks coming from the same vertex in a source foils, the curvature of the tracks corresponds to a negative charge, each track has to be associated with a trigged scintillator, and the time-of-flight has to correspond to the case of two electrons emitted at the same time from the same vertex. The energy deposited in the counter is required to exceed 200 keV, except with 82Se where the threshold was selected to be 300 keV. In order to suppress backgrounds from 214Bi decay inside the tracking detector, that is followed by 214Po -decay, it is required that there is no delayed Geiger cell hit close to the event vertex.
A complete study of backgrounds has been performed to date. The level of each background has been directly measured from the data. The first run period, from February 2003 to September 2004, with high level of radon is Phase I. The radon level inside NEMO 3 during the second run after the installation of the radon trapping facility, Phase II (since November 2004 up to now), has been reduced by a factor six.
3.1 Results for 100Mo ( = 3.034 MeV)
The decay of 100Mo has been measured with high accuracy in NEMO 3. Fig. 2a displays the spectrum of events for 100Mo that were collected over 389 days (Phase I) [8]. The angular distribution (Fig. 2b) and single electron spectrum (Fig. 2c) are also shown.


The total number of events exceeds 219,000 which is much greater than the total statistics of all of the preceding experiments with 100Mo (and even greater than the total statistics of all previous decay experiments!). It should also be noted that the background is as low as of the total number of events. The half-life obtained for Phase I data (389 days) is y and the single electron energy spectrum is in favour of the Single State Dominance (SSD) mechanism (see [16]). The value is in agreement with previous measurements [17] but it has higher precision.
The decay of 100Mo to the excited state of 100Ru (1130 keV) has also been measured, y [10]. The result is in good agreement with previous measurements [18, 19, 20].
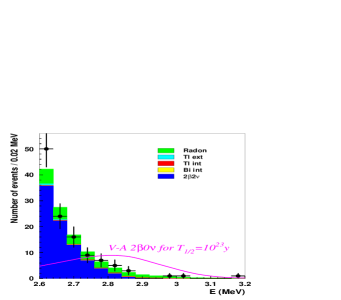
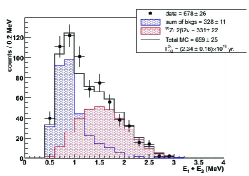
Fig. 3 (left) shows the tail of the two-electron energy sum spectrum in the energy window for 100Mo (Phase I+II; 693 days of measurement). One can see that the experimental spectrum is in good agreement with the calculated spectrum, which was obtained taking into account all sources of background. Using a maximum likelihood method, the following limits on neutrinoless double beta decay of 100Mo (mass mechanism; 90% C.L.) has been obtained:
| (1) |
3.2 Results for 82Se ( = 2.995 MeV)
Fig. 4 displays the spectrum of events for 82Se that were collected over 389 days (Phase I) [8]. The signal contains 2,750 2 events and the signal-to-background ratio is 4. The measured half-life value is y and is also in good agreement with previous measurements [17].

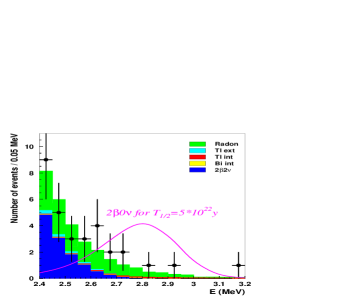
Fig. 3 (right) shows the tail of the two-electron energy sum spectrum in the energy window for 82Se (Phase I+II; 693 days of measurement). One can see that the experimental spectrum is in good agreement with the calculated spectrum, which was obtained taking into account all sources of background. Using a maximum likelihood method, the following limits on neutrinoless double beta decay of 82Se (mass mechanism; 90% C.L.) has been obtained:
| (2) |
In addition very strong limits on different types of decay with Majoron emission were obtained [9].
3.3 Results for 130Te ( = 2.529 MeV)
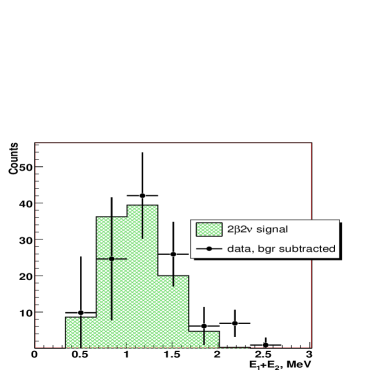
A preliminary measurement of 130Te half-life is reported here. Due to the extremely low decay rate, only the low background data (Phase II) was used. In total, 534 days of data were processed. The number of events observed from the Te source foil is 607, while the predicted background is 492 two-electron events. A binned maximum likelihood method was used to analyze the data. A signal equal to events was found, Fig. 5. This corresponds to a half-life of y.
This result is an improvement over the previous attempt at the direct measurement of 130Te decay [23]. It is also in agreement with predictions based on the geochemical 82Se/130Te ratio and the present 82Se decay rate from counting experiments [17].
Thus it is of particular interest, because there is a disagreement between geochemical measurements. One group found y [24], while the other gives y [25]. Also it was noted that a smaller value was obtained in the experiments with ”young” ores (younger than 100 million years). This led to the hypothesis that the differences can be accounted for by variations of the Fermi constant with time [26]. The NEMO 3 measurement reported does not contradict this hypothesis, and suggests that the possible variation should be tested using geochemical methods for other decaying nuclei.
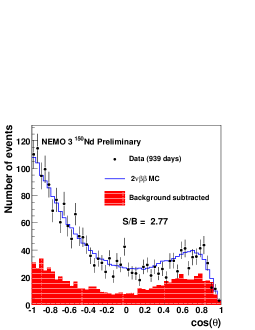
3.4 Results for 150Nd ( = 3.367 MeV)
A preliminary measurement of the half-life of 150Nd was obtained for a 46.6 g of 150Nd2O3 (enrichment of and the weight of 150Nd is 36.6 g) from data collected between February 2003 and December 2006 corresponding to 939 days of data during the Phases I and II of the experiment. The 2828 type events were observed with a signal-over-background ratio of 2.8. The distribution of the energy sum of the electrons in type events and their angular distribution are shown in Fig. 6. The background subtracted data and the signal expectation obtained from Monte Carlo calculations are in good agreement. The selection efficiency is 7.2%. The measured half-life is y. This value is between the two previous results obtained from experiments with time projected chambers, y [27] and y [28], but has much better statistical error.
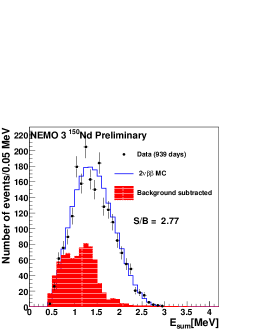
A decay signal would correspond to an excess of type events in the distribution of the energy sum of the electrons around the energy of the transition . No excess of events in the distribution of the energy sum of the electrons from type events originating from the 150Nd sample was observed during the 939 days of data collection. A limit on the half-life of the process is subsequently set using the method [29] for Mev. The limit on the half-life is y at a 90% C.L., which translates into an upper limit eV using the NME from QRPA calculations (deformation is not taken into account) [30] or eV using the NME from pseudo-SU(3) model (developed for deformed nuclei) [31]. The limit on the half-life was improved when compared to the previous result, y (95% C.L.) [32].
In the assumption of a process involving right currents (V+A), the limit is found to be y at a 90% C.L. For a process with Majoron emission (spectral index n = 1) the obtained limit is y (90% C.L.).
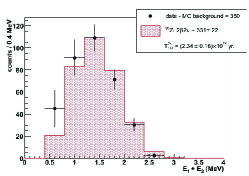
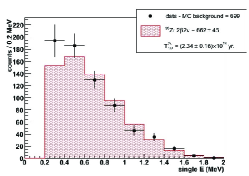
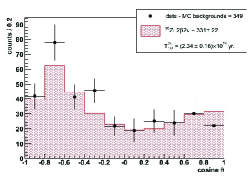
3.5 Results for 48Ca ( = 4.272 MeV)
A preliminary measurement of the half-life of 48Ca was obtained for 17.5 g of 48CaF2 (enrichment and the weight of 48Ca is 7 g) from the data corresponding to 943.16 days of data collection during the Phases I and II.
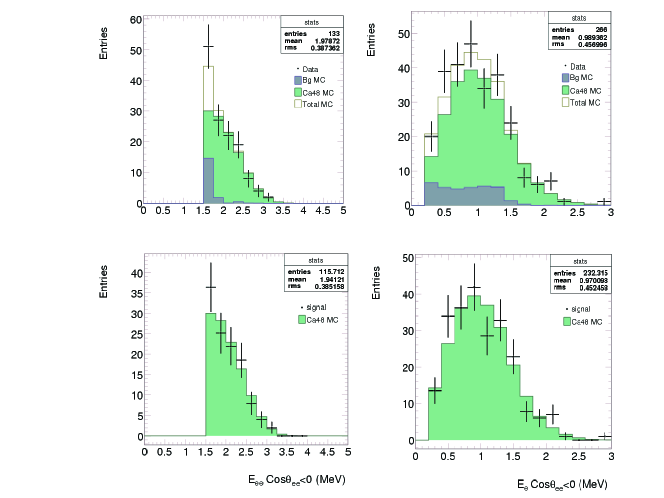
The sample of 48Ca inside NEMO 3 is known to be contaminated with 90Sr, which is the main background source in this case. The activity for the 90Sr contamination as measured by the NEMO 3 detector is 1699 3(stat) mBq/kg. To suppress the 90Sr background contribution events with a sum energy MeV and cos were selected. Fig. 7 shows the two electron sum spectrum and single electron spectrum after these cuts. After 22636 h of data collection, a total of 133 data events were selected, and background was estimated as 17.13 events. The efficiency from MC is 3.3%. The obtained half-life value is, y. This value is in good agreement with two previous measurements [33, 34], and has much higher precision. The half-life value obtained is in good agreement with the Shell Model prediction of y [35].
In the search for the decay of 48Ca, the method [29] was employed. The range MeV was used for the limit calculation. The limit obtained is y (90% C.L.).
3.6 Results for 96Zr ( = 3.350 MeV)
A preliminary measurement of the half-life of 96Zr was obtained for a 22 g sample of 96ZrO2 (enrichment and the weight 96Zr is 9.4 g) from the data corresponding to 924.67 days of data collection during the Phases I and II. Fig. 8 shows the two electron sum spectrum, single electron spectrum and angular distribution after subtraction of background. These were 331 events selected (best fit). The efficiency from MC is 7.6%. The half-life obtained is, y. This value is in good agreement with previous NEMO 2 measurement [38], but again has much higher precision.
For neutrinoless decay (mass mechanism) the limit is y (90% C.L.) and the corresponding limit on the effective Majorana neutrino mass is eV (using NME values from [21, 22]). This limit on the half-life is in 8.6 times better than the previous NEMO 2 result [38].
| Isotope | Measurement | Number of | S/B | , y |
| time, days | events | |||
| 100Mo | 389 | 219000 | 40 | [8] |
| 100Mo- | 334.3 | 37.5 | 3 | [10] |
| 100Ru(0) | ||||
| 82Se | 389 | 2750 | 4 | [8] |
| 116Cd | 168.4 | 1371 | 7.5 | |
| 48Ca | 943.16 | 116 | 6.8 | |
| 96Zr | 924.67 | 331 | 1 | |
| 130Te | 534 | 109 | 0.2 | |
| 150Nd | 939 | 2018 | 2.8 |
| Isotope | Measurement | , y |
| time, days | ||
| 100Mo | 693 | y |
| 82Se | 693 | y |
| 116Cd | 77 | y |
| 48Ca | 943.16 | y |
| 96Zr | 924.67 | y |
| 150Nd | 939 | y |
4 Conclusion
The NEMO 3 detector has been operating within the target performance specifications since February 2003. The decay has been measured for a seven isotopes with high statistics and greater precision than previously. The 100Mo decay to the excited state of 100Ru has also been measured. All obtained results are presented in table 2. First three results are published and others are preliminary. No evidence for decay was found for all seven isotopes. Obtained limits are presented in table 3. The best limits have been obtained with 100Mo ( y at 90% C.L.) and 82Se ( y at 90% C.L.). After five years of data collection the expected sensitivity at the 90% C.L. will be y for 100Mo, y for 82Se and y for the other isotopes.
5 Acknowledgments
This work was supported by Russian Federal Agency for Atomic Energy and by Federal Agency for Science and Innovations (contract No. 02.516.11.6099). A portion of this work was supported by grants from RFBR (No. 06-02-72553).
References
References
- [1] Valle J W F 2006 Preprint hep-ph/0608101
- [2] Bilenky S M 2007 J. Phys. A 40, 6707
- [3] Mohapatra R N and Smirnov A Y 2006 Ann. Rev. Nucl. Part. Sci. 56 569
- [4] Pascoli S, Petcov S T and Rodejohann W 2003 Phys. Lett. B 558 141
- [5] Mohapatra R N et al 2005 Preprint hep-ph/0510213
- [6] Pascoli S, Petcov S T and Schwetz T 2006 Nucl. Phys. B 734 24
- [7] Arnold R et al 2004 JETP Lett. 80 377
- [8] Arnold R et al 2005 Phys. Rev. Lett. 95 182302
- [9] Arnold R et al 2006 Nucl. Phys. A 765 483
- [10] Arnold R et al 2007 Nucl. Phys. A 781 209
- [11] Dassie D et al 1991 Nucl. Instr. Meth. A 309 465
- [12] Arnold R et al 1995 Nucl. Instr. Meth. A 354, 338
- [13] Kisel I et al 1997 Nucl. Instr. Meth. A 387 433
- [14] Arnold R et al 2001 Nucl. Instr. Meth. A 474 93
- [15] Arnold R et al 2005 Nucl. Instr. Meth. A 536 79
- [16] Shitov Yu A 2006 Phys. At. Nucl. 69 2090
- [17] Barabash A S 2006 Czech. J. Phys. 56 437
- [18] Barabash A S et al 1995 Phys. Lett. B 345 408
- [19] Barabash A S et al 1999 Phys. At. Nucl. 62 2039
- [20] De Braeckeleer L et al 2001 Phys. Rev. Lett. 86 3510
- [21] Kortelainen M and Suhonen J 2007 Phys. Rev. C 76 024315
- [22] Simkovic F et al 2008 Phys, Rev. C 77 045503
- [23] Arnaboldi C et al 2003 Phys. Lett. B 557 167
- [24] Manuel O K 1991 J. Phys. G 17 221; Takaoka N and Ogata K 1966 Z. Naturforsch 21a 84; Takaoka N, Motomura Y and Nagano K 1996 Phys. Rev. C 53 1557
- [25] Kirsten T et al 1986 Proc. Int. Symp. Nuclear Beta Decay and Neutrino (Osaka’86) (Singapur: World Scientific) 81; Bernatowicz T et al 1993 Phys. Rev. C 47 806
- [26] Barabash A S 2000 Eur. Phys. J. A 8 137
- [27] Artemiev V et al 1995 Phys. Lett. B 345 564
- [28] De Silva A et al 1997 Phys. Rev. C 56 2451
- [29] Junk T 1999 Nucl. Instr. Meth. A 434 435
- [30] Rodin V A et al 2007 Nucl. Phys. A 793 213
- [31] Hirsch J G et al 1995 Nucl. Phys. A 582 124
- [32] Klimenko A A et al 1986 Nucl. Instr. Meth. B 17 445
- [33] Balysh A et al 1996 Phys. Rev. Lett. 77 5186
- [34] Brudanin V B et al 2000 Phys. Lett. B 495 63
- [35] Caurier E et al 1999 Nucl. Phys. A 654 973a
- [36] Caurier E et al 2008 Phys. Rev. Lett. 100 052503
- [37] Ogawa I et al 2004 Nucl. Phys. A 730 215
- [38] Arnold R et al 1999 Nucl. Phys. A 658 299