Properties and Chemical Evolution of the M31 Disk: Comparison with the Milky Way
Abstract
By adopting the chemical evolution model of the Milky Way disk, we have studied the star formation and chemical evolution history for M31 galaxy disk. We mainly concentrated on the global properties of the M31 disk. The model has been scaled to the related disk parameters, mainly the disk scale length and total disk baryon mass of M31, which we have adopted to be =5.5kpc and M⊙. It is found that, when the classical Kennicutt star formation law was applied, the obtained radial profiles of gas surface density and star formation rate (SFR) have great difference from the observed results in M31 disk. Then we have adopted modified SFR as we did for the Milky Way galaxy, that is the SFR is radial dependent. Detailed calculations show that by adjusting the star formation efficiency, it is possible to get reasonable gas and abundance profiles, but the total disk SFR is a factor of 2-3 higher than that estimated from observations. And also the predicted SFR radial profile is also much higher than what GALEX observed in the outer part. Possible reasons could be that the M31 disk has been interacted by other factors which seriously altered the star formation history, or the observed SFR is underestimated due to inappropriate extinction correction.
keywords:
galaxies:evolution - galaxy:M31 - galaxy:Milky Way1 Introduction
As one of the three disk galaxies in the Local Group, Andromeda galaxy (M31, or NGC224) provides an unique opportunity for testing theory of galaxy formation and evolution (Widrow et al. 2003; Renda et al. 2005; Widrow & Dubinski 2005; Brown et al. 2006; Tamm et al. 2007; Tempel et al. 2007). In order to understand how star formation has influenced the evolution of M31 disk, Williams (2003a, 2003b) has measured star formation history in several regions of the M31 disk from the KPNO/CTIO Local Group Survey. It is found that the total mean star formation rate for the disk is about 1 M⊙yr-1. By deep HST photometry, Bellazzini et al. (2003) have studied the metallicity distributions and star formation history in many locations of the disk (see also Ferguson & Johnson 2001; Sarajedini & van Duyne 2001; Olsen et al. 2006).
However, some basic properties of the Milky Way and M31 galaxies are still uncertain despite years of detailed observations and analysis. For example, the total masses of two galaxies could be varied by a factor of few based on the current published literatures in which the mass of galaxy is mostly derive from kinematic analysis of the galaxy and its neighbors. And there also exists disagreement over which of the two galaxies should be more massive (Evans & Wilkinson 2000; Gottesman et al. 2002).
In this work, we apply an infall model, which is similar to what has been used for the Milky Way galaxy, to M31 galaxy. We will mainly concentrate on the global properties of the M31 disk based on the currently available data. We would like to know whether the similar model could explain both the Milky Way and M31 disk observations. If not, what is the main difference in the formation history of those two disks. We would like to demonstrate and hope to understand the similarities and differences of star formation and chemical evolution history between M31 and the Milky Way disks.
2 Observed properties of the M31 and Milky Way disks
Disk Scale Length and Mass: We assume the disk has an exponential total surface density now (unit: ):
| (1) |
is the disk scale length. is the central surface density at the present time. The disk scale length has some complexity since it is wavelength dependent. It is obtained on the basis of surface brightness profiles in various bands. In table 1, we list all the available observed disk scale lengths and scaled to the same distance of 785 kpc (McConnachie et al. 2005). It can be found that the overall values are consistent for different bands, except for the shorter wavelengths which are likely to be affected by dust extinctions.
Table 1. M31 exponential disk scale length
band
Rd
D
Rd
Refs.
(kpc)
(kpc)
(785kpc)
U
6.80.4
690
7.7
(1)
B
5.80.3
690
6.6
(1)
V
5.30.3
690
6.0
(1)
R
5.20.3
690
5.9
(1)
5.40.13
784
5.4
(2)
I
5.60.4
770
5.7
(3)
K
4.20.4
690
4.8
(4)
L
6.080.09
783
6.1
(5)
Refs: (1) Waterbos & Kennicutt 1988; (2) Geehan et al. 2006; (3)
Worthey et al. 2005; (4) Hiromoto et al. 1983; (5) Barmby et al.
2006.
In this work we shall adopt an averaged value from four observed values from three bands (R, I, K), which is =5.5 kpc.
For the Milky Way disk, its exponential disk scale length has been widely measured (see a review of Hammer et al. 2007). The generally accepted value is about rd = 2.3 kpc (R or I band, Hammer et al. 2007 ). This is less than half of the M31 disk.
For the total mass of M31 disk, observational data and some mass models have also given some rough estimations. In their disk-bulge-halo model, Widrow et al. (2003) shown that the best model requires the M31 disk mass be about M⊙. Recent mass model of Geehan et al.(2006) also give a similar disk mass value about M⊙by adopting the disk mass-to-light ratio of 3.3. In this paper, we will adopt the M31 total disk mass to be M⊙.
In short summary, we can know that M31 disk is about 2 times massive than the Milky Way disk (M⊙) and the scale length is 2.4 times longer than that of the Milky Way disk (2.3kpc).
Gas and SFR Profiles : Thanks to the GALEX, we are now also able to get star formation rate radial profile for a number of local galaxies derived from the UV (not H data) continuum (Boissier et al. 2007). In general, the correlation between star formation rate and gas surface density is compatible with empirical Kennicutt (1998) type law with some scatter in the low surface density end. But as Boissier et al. (2007) show this correlation for some individual galaxies, especially for M31, is quite abnormal (see their Fig.6).
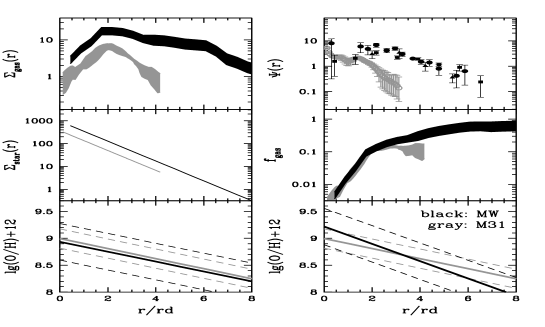
The observed profiles of gas and SFR for both Milky Way and M31 are plotted in the upper two panels of Fig 1, where we have scaled the radius to disk scale length .
Disk Abundance Gradients : In the lower two panels of Fig 1, we plot the radial abundance gradients for the two disks. The M31 gradient data are taken from different literatures (Blair 1982; Dennefeld & Kunth 1981; Trundle et al. 2002). It is evident that the M31 disk abundance ( dex kpc-1, ) is about 4 times smaller than that of the Milky Way disk ( dex kpc-1, Rudolph et al. 2006). If we express them in scale length (dex/), then the scaled gradient of M31 disk is about 2 times smaller (-0.09 vs. -0.16, right lower panel in Figure 1 ).
However, there are some observations indicate that the abundance gradient along the Milky Way diks could be shallower than the commonly adopted results. For example, based on detailed observations of 34 Galactic HII regions between 5 and 15 kpc, Deharveng et al. (2000) reported a value of oxygen abundance gradient about dex kpc-1. A shallow gradient is also obtained by Daflon & Cunha (2004), who derived a mean abundance gradient about dex kpc-1for a sample of 69 members of 25 open clusters, OB associations and HII regions with Galactocentric distances between 4.7 and 13.2 kpc. Recently, Chen & Hou (2007) have updated their open clusters sample by adding more objects, and also find that the disk iron abundance gradient for all clusters is about dex kpc-1, smaller than their previous results. For young clusters, the gradient could be more smaller. In this case, the gradients per scale length for two disks are similar (left of lower panels of Fig 1).
3 A Unified Description of the Milky Way and M31 disk
Observations have provided a number of data for both Milky Way and M31 galaxies. There are clear indications of similarities and differences between M31 and Milky Way galaxy, from bulges, disks to halos (Wyse 2002). From figure. 1, several points can be drawn:
(1) The Milky Way has more extended gas and star distributions relative to scale length. The Milky Way disk has more gas and higher star formation rate also. Especially in the outer part of the disk.
(2) The distribution of scaled gas fraction between two disks are quite similar. This is consistent with the situation that Milky Way has more gas and higher SFR. However, the overall gas fractions of the two disks are quite different, in which the Milky Way has twice as much as that of the M31 disk.
(3) The scaled abundance gradients between two disks are similar if the we adopt the smaller value of gradient for Milky Way disk.
It can be seen, when the observed profiles are scaled to scale length, two disks show some similar properties. The main differences come from the SFR profiles in the outer part of two disks. Therefore, it is instructive to see if we could establish a unified chemical evolution model to reproduce the observed properties for both disks.
4 The Model Results
In this section, we give brief discussions about the model results. Details about the model can be found in Yin et al. (2008), and also in Boissier & Prantzos (1999, 2000) and Hou et al. (2000).
The main parameter in our model is the SFR. In Boissier & Prantzos (1999,2000), the SFR was expressed as a modified Kennicutt-Schmidt law (hereafter M-KS law):
| (2) |
where is in unit of , is in unit of kpc. The index was chosen to be on an empirical basis. And For the Milky Way disk, =1.0. They adopted this M-KS law in subsequent models for external spirals and the models can successfully reproduce global properties of spirals ( Boissier & Prantzos 2000, 2001; Boissier et al. 2001).
In the following calculations, we will adopt M-KS law and with being a free parameters for Milky Way and M31 disk.
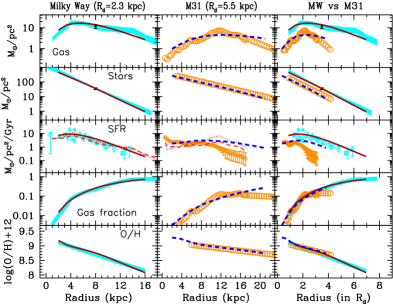
In Fig. 2, we show the model predictions of the radial profiles for gas, star, SFR and oxygen abundance and compare with the observations. The stellar profile is obtained by subtracting the observed gas profile from the exponential disk (governed by the disk scale length and the central mass surface density). The star formation efficiency (parameter ) is adjusted in order to get a satisfactory present day gas profile in both Milky Way and M31 disks. For the Milky Way disk, it is well justified that the acceptable value is about , while for M31, we need a value of , which is twice as much as that for the Milky Way disk, in order to get satisfied results. In the third column, we plot the model and observed results by scaling the radius to scale length.
Observationally, M31 has flatter gradient than the Milky Way disk. But there are also observations show that the Milky Way has flatter gradient as we mentioned before. If the Milky Way has a gradient about dex kpc-1, then the scaled values for M31 and Milky Way are quite consistent.
Model problems for the M31 disk come from the inconsistency between the predicted and observed SFR profiles. No matter how we adjust the model parameters, it is unable to get reasonable M31 SFR profile, especially in the outer disk, where the model will predict much higher SFR in order to get lower gas content.
This difficulty could be partially solved by changing the star formation history of the disk. If star formation efficiency were higher in the past, then more gas would be consumed and resulting less gas content at present. This scenario is at least partially supported by observations. Recent observations based on deep surveys have provided enormous information concerning star formation history, morphology, metallicity and kinematics in various regions of the M31 disk, bulge and halo (Ibata et al. 2005; Ferguson et al. 2005; Guhathakurta et al. 2005; Brown et al. 2006; Olsen et al. 2006). It is generally accepted that the M31 galaxy has experienced many more small mergers or a few large ones during its evolution history. Such kind of mergers should not destroy the M31 disk, but must have great influence on disk properties, including disk SFR history and gas evolution.
5 Summary
In this work, we have studied the chemical evolution for the M31 disk based on the model similar to the Milky Way disk (Boissier & Prantzos 1999, 2000). The main observational constrains for M31 disk are the profiles of gas and star formation rate, the abundance gradients. The star formation profile of the M31 disk is from recent UV data of GALEX (Boissier et al. 2007).
We tried to use a unified chemical evolution model to predict the disk properties of both M31 and Milky Way by using the modified KS SFR law. When the results are scaled to disk scale lengths, we find that the M31 need a higher star formation efficiency than the Milky Way disk. And the model always predicts a higher SFR in the outer part of the M31 disk. It is also found that the adopted different infall time scales are not very sensitive to the radial profiles of gas, SFR and abundances. The inside-out disk formation is mainly controlled by the radial dependence of star formation rate instead of the time scale.
Acknowledgements.
This work is supported by national science foundation of China with No.10573028, No.10573022 and by 973 program with No. 2007CB815402.References
Barmby P., Ashby M.L.N., Bianchi L. et al., 2006, ApJ, 650, L45
Bellazzini M., Cacciari C., Federici L. et al., 2003, A&A, 405, 867
Blair W.P., Kirshner R.P., Chevalier R.A., 1982, ApJ, 254, 50
Boissier S., Boselli A., Prantzos N. et al., 2001, MNRAS, 321, 733
Boissier S. & Prantzos N., 1999, MNRAS, 307, 857
Boissier S. & Prantzos N., 2000, MNRAS, 312, 398
Boissier S. & Prantzos N., 2001, MNRAS, 325, 321
Boissier S., Gil de Paz A., Boselli A. et al., 2007, ApJS,173, 524
Brown T.M., Smith E., Ferguson H.C. et al., 2006, ApJ, 652, 323
Chamcham K., & Tayler R.J., 1994, MNRAS, 266, 282
Chen L. & Hou J.L., 2007, IAU Symposium 248
Daflon S. & Cunha K., 2004, ApJ, 617, 1115
Deharveng L., Peña M., Caplan J. et al., 2000, MNRAS, 311, 329
Dennefeld M., & Kunth D., 1981, AJ, 86, 989
Evans N. W., & Wilkinson M. I., 2000, MNRAS, 316, 929
Ferguson A. M. N., & Johnson R. A., 2001, ApJ, 559, 13
Ferguson A. M. N., Johnson R. A., Faria D. C. et al., 2005, ApJ, 622, L109
Geehan J. J., Fardal M. A., Babul A. et al., 2006, MNRAS, 366, 996
Gottesman S.T., Hunter J.H., Boonyasait V., 2002, MNRAS, 337, 34
Guhathakurta P., Gilbert K. M., Kalirai J. S. et al., 2005, BAAS, 37, 1386
Hammer F., Puech M., Chemin L., Flores H. & Lehnert M. D., 2007, ApJ, 662, 322
Hiromoto N., Maihara T., Oda N. et al., 1983, PASJ, 35, 413
Hou J. L., Prantzos N., Boissier S., 2000, A&A, 362, 921
Ibata R., Chapman S., Ferguson A. M. N. et al., 2005, ApJ, 634, 287
Kennicutt R. C., 1998, ARA&A, 36, 189
McConnachie A., Irwin M., et al., 2005, MNRAS, 356, 979
Olsen K. A. G., Blum R. D., Stephens A. W. et al., 2006, AJ, 132,271
Renda A., Kawata D., Fenner Y. et al., 2005, MNRAS, 356, 1071
Rudolph A. L., Fich M., Bell G. R. et al., 2006, ApJS, 162, 346
Sarajedini A., & van Duyne J. 2001, AJ, 122, 2444
Tamm A., Tempel E. & Tenjes P., 2007, arXiv:0707.4375v1
Tempel E., Tamm A. & Tenjes P., 2007, arXiv:0707.4374v1
Trundle C., Dufton P. L., Lennon D. J. et al., 2002, A&A, 395, 519
Walterbos R. A. M., & Kennicutt R. C., 1988, A&A, 198, 61
Widrow L.M., Perrett K.M., Suyu S. H., 2003, ApJ, 588, 311
Widrow L.M., & Dubinski J., 2005, ApJ, 631, 838
Williams B.F., 2003a, AJ, 126, 1312
Williams B.F., 2003b, MNRAS, 340, 143
Worthey G., España A., MacArthur L.A. et al., 2005, ApJ, 631, 820
Wyse R.F.G., 2002, European Astrophysical Society Pub. Series 2
Yin J., Hou J.L., Boisier, S. et al., 2008, submitted to A&A.