Chandra Observation of the Edge-on Spiral NGC 5775: Probing the Hot Galactic Disk/Halo Connection
Abstract
We study the edge-on galaxy NGC 5775, utilizing a 58.2 ks Chandra ACIS-S observation together with complementary HST ACS, Spitzer IRAC and other multi-wavelength data sets. This edge-on galaxy, with its disk-wide active star formation, is particularly well-suited for studying the disk/halo interaction on sub-galactic scales. We detect 27 discrete X-ray sources within the region of the galaxy, including an ultra-luminous source with a 0.3-7 keV luminosity of . The source-removed diffuse X-ray emission shows several prominent extraplanar features, including a diameter “shell-like” feature and a “blob” reaching a projected distance of from the galactic disk. The bulk of the X-ray emission in the halo has a scale height of 1.5 kpc and can be characterized by a two-temperature optically thin thermal plasma with temperatures of 0.2 and 0.6 keV and a total 0.3-2 keV luminosity of . The high-resolution, multi-wavelength data reveal the presence of several extraplanar features around the disk, which appear to be associated with the in-disk star formation. We suggest that hot gas produced with different levels of mass loading can have different temperatures, which may explain the characteristic temperatures of hot gas in the halo. We have obtained a sub-galactic scale X-ray-intensity-star formation relation, which is consistent with the integrated version in other star forming galaxies.
1 Introduction
It is generally believed that extraplanar diffuse X-ray emission detected around actively star-forming disk galaxies arises primarily from the so-called disk/halo interaction (Cox 2005 and references therein; Wang et al. 1995, 2001, 2003; Strickland et al. 2004a,b). Existing observational work has concentrated on the overall correlation between the extraplanar X-ray emission and the integrated properties of various tracers of star formation in such galaxies, especially those with nuclear starbursts. Systematic studies with Chandra data (Strickland et al. 2004a,b) have revealed the correlation between the presence of extraplanar hot gas and warm ionized gas, which is interpreted as a result of the interaction between star formation-driven outflow of hot gas and the cooler ambient interstellar medium (ISM). The integrated extraplanar X-ray luminosity is found to be quasi-linearly correlated with the star formation rate, implying that the mechanical energy release from supernova explosions (SNe) and massive stellar winds is converted into radiative energy with a certain efficiency. Similar correlations have been demonstrated in an XMM-Newton survey of edge-on galaxies with relatively normal or disk-wide star forming activity (Tllmann et al. 2006a,b). In addition, there might be an energy input threshold to form a multi-phase halo (Rossa & Dettmar 2003; Dahlem et al. 2006). In general, little is yet known about the physical state of the extraplanar hot gas (e.g., the pressure and volume filling factor) and its relationship with other ISM components in the host halo.
The edge-on star-forming galaxy NGC 5775 (see Table 1 for basic parameters) is well-suited for a detailed study of the disk/halo interaction. Unlike a nuclear starburst galaxy, the star formation in NGC 5775 is spread out across the galactic disk. This allows us to explore the general disk/halo interaction without it being overwhelmed by a powerful galactic nuclear superwind. Indeed, this galaxy is one of the rare cases in which extraplanar emission has been detected from essentially all diffuse interstellar components (e.g., Lee et al. 2001). A number of extraplanar features are resolved and found to exhibit coherent structures in H I, radio continuum and H. NGC 5775 is interacting with its companion NGC 5774, as they are bridged by H I gas (Irwin 1994). In addition, the kinematics of the extraplanar diffuse ionized gas has been carefully studied, showing a vertical gradient in azimuthal velocity, which is steeper than what is predicted by a ballistic model of a disk/halo flow (Heald et al. 2006; Fraternali et al. 2007). Hydrodynamic effects may thus be important (e.g., Barnab et al. 2006), which may result from the interaction of the flow with pre-existing halo gas. Previous X-ray studies based on ROSAT and XMM-Newton observations of NGC 5775 (Lee et al. 2001; Tllmann et al. 2006a) have revealed the presence of apparently diffuse X-ray emission which is generally spatially related to the extraplanar features observed at other wavelengths. However, these X-ray data of limited spatial resolution do not allow for a clean detection and removal of discrete sources or for a detailed morphological characterization of the extraplanar hot gas and its connection to other components of this galaxy.
In this paper, we present a Chandra study of NGC 5775 and confront the results with multi-wavelength data obtained from Spitzer and HST as well as various ground-based observations. These data allow us to examine various spatially resolved properties of the disk/halo interaction. We describe the observations and data reduction in § 2 and present our analysis and results in § 3. We discuss the implications of our results in § 4 and summarize our findings in § 5. Throughout this work errors are quoted at the 90% confidence level.
2 Observations and Data Reduction
The archival Chandra observation of NGC 5775 (Obs. ID. 2940) was taken on April 5, 2002, with a total effective exposure of 58.2 ks. In this work, we mainly utilize data from the ACIS-S3 chip, although part of the data from the S2 chip is also used in the source detection and imaging. We reprocessed the data using CIAO v3.3 (the Chandra Interactive Analysis of Observations) following the Chandra ACIS data analysis guide. The light curve of the observation indicates a quiescent background rate with no significant flares. We created count and exposure maps in four bands (0.3-0.7, 0.7-1.5, 1.5-3 and 3-7 keV) and use the “stowed” data for the non-X-ray background subtraction after a count rate normalization in the 10-12 keV range.
We performed source detection in the broad (B, 0.3-7 keV), soft (S, 0.3-1.5 keV) and hard (H, 1.5-7 keV) bands, following the procedure detailed in Wang (2004). To study the diffuse X-ray emission, we removed the detected discrete sources (§ 3.1) from the maps. To do so, we excluded circular regions containing twice the 90% enclosed energy radius (EER) around each source of a count rate . For brighter sources, the source removal radius is further multiplied by a factor of . Generally about 96-97% of the source counts are excluded in such a procedure.
Noticeably, the sky position of NGC 5775 is on the outskirts of the North Polar Spur (NPS), a Galactic soft X-ray feature (Snowden et al. 1995) that introduces an enhancement to the sky background. Hence, in spectral analysis we adopted a “double-subtraction” procedure, similar to that used in Li, Wang & Hameed (2007), to determine the sky background. A source-removed local background spectrum is extracted from a region as shown in the left panel of Fig. 2. The corresponding spectrum of the non-X-ray contribution is extracted from the stowed data and subtracted from the total background spectrum. We then characterize the remaining sky signals by a combination of three characteristic components: a thermal plasma model (APEC in XSPEC, with a temperature of 0.1 keV) primarily for the soft X-ray emission of the Galactic halo and the Local Hot Bubble, a second APEC (temperature 0.3 keV) for the NPS emission, and a power-law (photon index of 1.4) accounting for the extragalactic background. The sky background is well fitted by these models over the 0.3-7 keV energy range. We further verify the modeling by confirming that the amplitudes of the three components are consistent with independent measurements (e.g., Willingale et al. 2003; Moretti et al. 2003). This background model is added to the source models when fitting the non-X-ray background-subtracted source spectra (§ 3.2), with proper scaling of the sky area.
To assist the interpretation of the X-ray data, we incorporated various relevant data sets for comparison. We obtained the Spitzer IRAC images of NGC 5775 from the Spitzer archive. To determine the net 8 m emission from dust, we divided the background-subtracted, aperture-corrected (Reach et al. 2005) 4.5 m image by a factor of 2.72 (Hunter, Elmegreen & Martin 2006) and then subtracted it from the 8 m image to account for the stellar contribution (the galaxy is unfortunately absent in the 3.6 m channel in which the determination of stellar contribution would be optimal).
The HST observations of NGC 5775 were carried out on August 21 2005 with the Advanced Camera for Surveys (ACS) (GO#10416; PI: J. Rossa) using the Wide Field Channel (WFC), which yields a field of view. The narrowband F658N filter observation was acquired in three HST orbits, while the broadband F625W image was acquired in one HST orbit. More observational details are given in Rossa et al. (2008). The HST/ACS data were calibrated using the CALACS and Multidrizzle packages. The former removes the various instrumental signatures, including bias correction and flat-fielding. The latter is used to correct for the geometric distortion of the ACS camera and also performs cosmic ray rejection, and finally combines the individual images, obtained in the specific dither pattern.
We also make use of H I data of Irwin (1994), H data of Collins et al. (2000) and radio continuum data from Duric et al. (1998) and Lee et al. (2001).
3 Analysis and Results
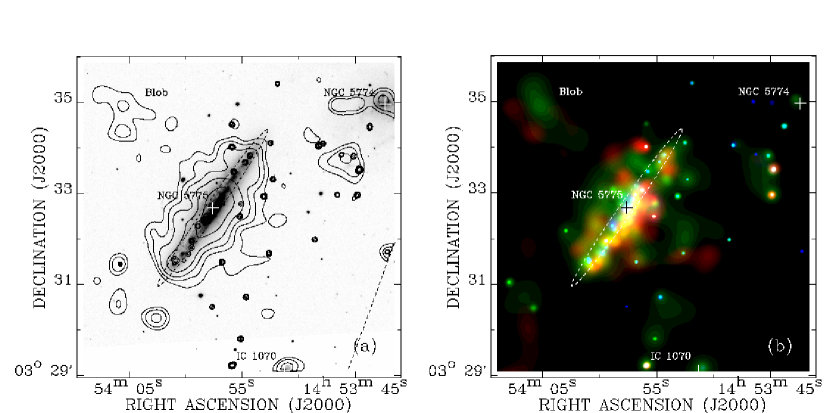
Fig. 1a shows ACIS-S 0.3-7 keV intensity contours of NGC 5775 and its vicinity on an optical image, while Fig. 1b shows a smoothed 3-color X-ray image. An asymmetry of the diffuse emission is apparent in both the color and brightness relative to the major axis close to the disk. This asymmetry is clearly caused by the tilt of the galactic disk with its nearer side toward the northeast. Aside from the X-ray emission from NGC 5775 itself, apparently weak X-ray emission features also appear to be associated with IC 1070 and NGC 5774. However, the counting statistics of these detections are too low to allow for any quantitative characterization. In particular, NGC 5774 is located in the S2 chip that has a relatively lower sensitivity to the detection of soft X-rays. The appearance of the soft X-ray emission from this galaxy may be strongly perturbed by the tidal interaction with NGC 5775 (Lee et al. 2001). In the following we will concentrate on the X-ray emission associated with NGC 5775, which in general represents the combined contributions from discrete sources and truly diffuse hot gas.
3.1 Discrete X-ray sources
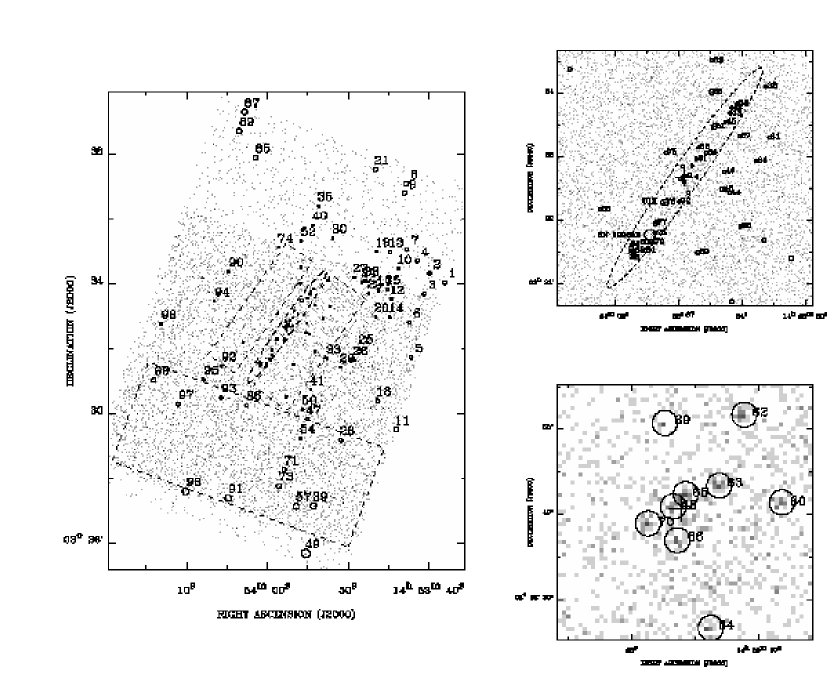
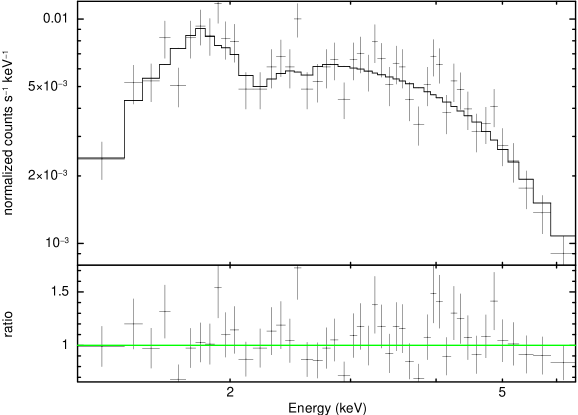
We detect 99 discrete sources in the field of NGC 5775 (Fig. 2), 27 of which are within of the galaxy, with a local false detection possibility of . Table 2 summarizes information about these sources. Among them, two sources have count rates greater than 20 cts ks-1: Sources 12 and 76. Source 12 is located at the outskirts of the face-on spiral galaxy NGC 5774, showing a spectrum that can be fitted by a power-law model (photon index of 2) with absorption similar as the foreground value, hence it is likely an X-ray binary in NGC 5774. Source 76 is located within the projected galactic disk of NGC 5775, hence it is probably associated with this galaxy. The spectrum of Source 76 can be well fitted by a power-law with a photon index of and an absorption column density of (Fig. 3; Table 3). H I observations (Irwin 1994) indicate that the beam-averaged neutral hydrogen column density is no higher than within the disk region but substructure within the beam could result in locally higher column densities. Also, molecular gas in star-forming regions may contribute additional absorption to Source 76. The fitted spectral model gives an absorbed (intrinsic) 0.3-7 keV luminosity of , putting Source 76 in the class of ultra-luminous X-ray sources (ULXs).
The Chandra data show no significant X-ray emission from either the nucleus of NGC 5775 or the remnant of SN 1996AE (Fig. 2). An X-ray detection of the remnant was suggested by Tllmann et al. (2006a) based on an XMM-Newton observation. We speculate that this XMM-Newton detection corresponds to our Source 76, which is about 05 from the remnant. In addition, the XMM-Newton source near the northwestern end of the galactic disk (R.A.= and Dec.=; Tllmann et al. 2006a, Fig. 10 therein) is most likely our Source 55 — the fourth brightest source in our detection list. This source has an R-band counterpart with a magnitude of . Its X-ray spectrum is well fitted by a power law with a photon index of .
We have further analyzed the accumulated spectrum of detected sources in the disk region (Fig. 2) and these can be well fitted with an absorbed power-law model with a photon index of 1.3.
3.2 Diffuse X-ray emission
Fig. 4 shows an image of the discrete source-removed “diffuse” soft X-ray emission, compared with the 20 cm radio continuum map of NGC 5775. In addition to the presence of the diffuse emission clearly associated with NGC 5775, an isolated “blob” of X-ray emission also appears northeast of the galaxy. The far side of this blob reaches a projected distance of 35 (25 kpc) from the galactic center. As evident in Fig. 1b, this feature is only apparent in the soft (0.3-1.5 keV) band. Although the detection is formally at a statistical confidence of , the feature has a low surface brightness. We cannot completely rule out the possibility that it may be an artifact, caused by the systematic uncertainty in the background subtraction, flat-fielding, and/or faint source confusion. There is no evidence for any group or cluster of galaxies in this field. Therefore, the feature, if real, is likely to be associated with NGC 5775. In the opposite side, there is a “shell-like” feature extending to a projected distance of 15 (11 kpc) from the galactic plane.
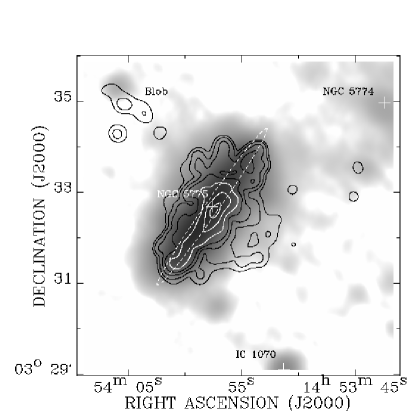

Fig. 5 presents the diffuse 0.3-1.5 keV intensity map of NGC 5775, together with HST/ACS images. Current star formation, as traced by the H emission, seems to occur throughout the galactic disk, but is clearly more active toward its inner region and in a few giant complexes, in which a greater number of discrete X-ray sources also reside. Along the major axis, a dust lane, which is seen as a dark band in the R-band image, causes the soft X-ray absorption and hence the asymmetry in the soft X-ray intensity distribution. Several X-ray intensity contours have been displayed to aid in illustrating the connection between H II complexes in the disk and the broader scale diffuse X-ray emission. The giant H II complex near the far NW end of the major axis is a good example. Diffuse emission in the 1.5-7 keV band (Fig. 6) is only present in the central region ( kpc) along the galactic disk. The enhancement at the position of the ULX is mostly due to its residual contamination (the PSF wing outside the source-removal circle).
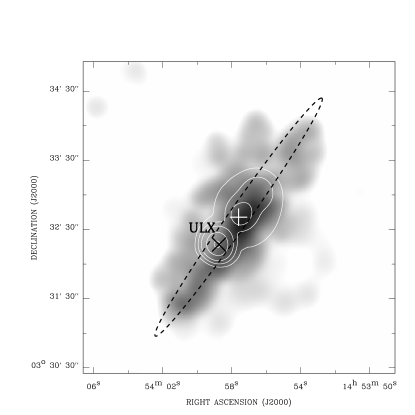
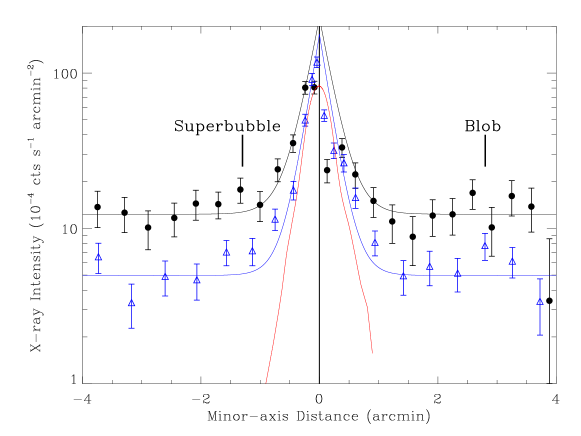
Fig. 7 shows the vertical diffuse X-ray intensity profiles as a function of the distance from the galaxy’s major axis. The profiles are calculated separately for the 0.3-0.7 and 0.7-1.5 keV bands and are averaged within a slice that is 200′′ wide along the major axis. Within an off-disk distance of 05 to the northeast (positive side in Fig. 7), a dip is apparent in the intensity profiles: deeper in the 0.3-0.7 keV band than in the 0.7-1.5 keV band and is fully consistent with the X-ray absorption by the tilted disk (Irwin 1994). We fit the profiles with an exponential law: , where is the intensity at the major axis and is the vertical scale height. A local sky background is adopted to be in the 0.3-0.7 (0.7-1.5) keV band, estimated from a background region as described in §2. Since on the positive side, the profile is seriously affected by the absorption with a peak column density in the galactic plane, we only fit the profile in the negative side with to minimize the residual absorption effect of the disk. The 0.3-0.7 (0.7-1.5) keV scale heights are () in the southwestern side. Accounting for the absorption effect, the intrinsic diffuse soft X-ray emission appears to be fairly symmetric relative to the major axis of the galaxy. Nevertheless, imprints of large-scale extraplanar features are present; the most noticeable are the southwest shell-like feature and the northeast blob (Fig. 1, Fig. 4; see §4 below). These features produce local enhancements, although their significance is already diluted in Fig. 7 because of the average over the width of the broad slice.

We extract spectra from the disk and halo regions in NGC 5775 for the diffuse X-ray emission (Fig. 2). The X-ray emission from regions northeast to the major axis of the galaxy is subject to the absorption by the tilted cool gas disk. The H I disk, in particular, is likely to be thicker at large galactocentric radii, responsible for the projected broad vertical H I distribution seen in Fig. 9d. The near side of the H I disk can thus effectively absorb X-ray from the extraplanar X-ray emission from the northeast halo of the galaxy, but should be tilted largely away from sight-lines toward the southwest part of the halo. The H I projected in this latter part of the sky is located on the far side of the disk and should produce little absorption on the extraplanar X-ray emission. Therefore, we collect the X-ray spectral data only from southwest halo and large height of northeast halo, as outlined in Fig. 2. The spectral analysis below (e.g., Fig. 8b) and the spatial distribution of the extraplanar X-ray emission (e.g., Fig. 7) also show no indication for any absorption, in addition to that caused by the foreground Galactic column density.
We fit the disk and halo spectra with a thermal plasma model (XSPEC MEKAL, with the abundance fixed at solar). At energies above 1.5 keV of the disk spectrum, the residual counts spilled outside the source-removal regions (especially the ULX) and the unresolved point sources below our detection limit dominate, so we add a power law (PL) component to account for this effect (a single MEKAL model gives very poor fit with reduced ). Intrinsic absorption is considered in the fit to the disk spectrum and the fitted value is consistent with the H I data (Fig. 7). Due to the limited statistics of high energy counts, the photon index of the PL component cannot be well constrained and is thus fixed to the value from the fit to the accumulated source spectrum (§ 3.1). The fitted temperature of the diffuse plasma is 0.2 keV in the disk. The thermal (PL) component of the disk spectrum gives an intrinsic 0.3-2 keV luminosity of . This model fit provides only a simple characterization of the spectral shape of the disk X-ray emission. The fitted individual model parameters probably do not have much physical meaning. For example, the power law component may contain a significant contribution from hotter diffuse gas that may be expected in the galactic disk. But the limited counting statistics of the data and the edge-on orientation of the galaxy make it impossible to significantly improve the analysis.
Since the stellar contribution in the halo is much lower than that in the disk, we do not include a PL component for the halo spectrum. But a single MEKAL model gives relatively poor fit with reduced , so we use a two-temperature model for the halo, again with abundances fixed at solar. The absorption is fixed at the foreground value. The 0.3-2 keV intrinsic luminosity of the low (high) temperature component is . The fitted spectra are shown in Fig. 8, while the fitted parameters are summarized in Table 3.
4 Discussion
4.1 Connection of extraplanar hot gas to disk star formation
In Fig. 9 (also see Figs. 4 and 5), we show the comparative morphology of the soft X-ray emission with images in other wavebands. The in-disk soft X-ray emission generally shows spatial similarities with star formation regions as traced by H, IR and/or radio emission. It is not surprising to have such similarities, since diffuse hot gas and unresolved young stellar objects, both closely related to star-forming regions, contribute to the soft X-ray emission. The extraplanar X-ray emission arises from truly diffuse hot gas. Thus, in general, we expect a spatial relationship between the extraplanar hot gas and underlying star-forming regions if the extraplanar gas is supplied and regulated by underlying star-forming processes. Differences in spatial resolution for the plots of Fig. 9 make specific connections to underlying star forming regions more difficult to trace. An examination of Fig. 5, however, indeed does show some correlation. For example, as indicated in Sect. 3.2, the in-disk NW giant H II complex appears connected to the extraplanar X-ray emission and the central X-ray contours are wider around the central star forming regions of the galaxy. The giant H II in-disk complex on the far SE end of the disk does not appear to have an extra-planar X-ray counterpart in this figure, but the X-ray results of Tüllmann et al. (2006) reveal extraplanar X-ray emission associated with a string of H II regions off the plane on this side as well. Again, this argues for a connection between extraplanar X-ray emission and in-disk star formation.
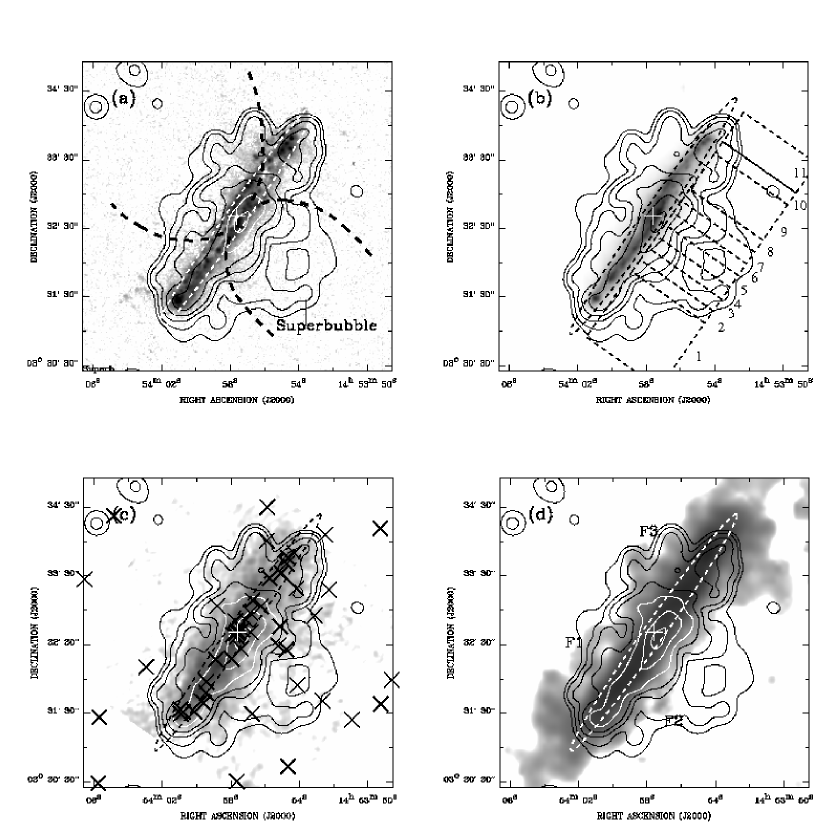
On larger scales, several extraplanar features are resolved with the superb resolution of Chandra and other multi-wavelength observations (Fig. 9). Here we discuss the three most prominent plume-like features, originally identified in H I observations (Irwin 1994; Lee et al. 2001; labelled F1, F2, and F3 in Fig. 9) and later found to have counterparts or extensions in other wavebands (e.g. Lee et al. 2001; Brar et al. 2003). F1 and F2, being opposite to each other with respect to the disk, apparently protrude from an intense star-forming region, within which the ULX is located. On the other hand, in the disk region underneath F3, all components of the ISM, except for H I, show a local minimum, indicating a low current star formation rate (Lee et al. 2001), possibly as a result of a previous star forming episode which has produced an in-disk disruption. F3 seems to be associated with an extraplanar H filament, within which several H II regions reside (Lee et al. 2001). Together with the disk-halo connections discussed above (cf. Fig. 5), they collectively indicate that local star forming regions away from the nucleus affect halo characteristics above and below the plane.
In addition, however, these features are located near the boundaries of the so-called “X-shape” which designates conic structures (marked in Fig. 9a) and was claimed to be present from previous X-ray (Tllmann et al. 2006a) and radio (Tllmann et al. 2000) observations. The shell-like X-ray feature to the SW of the major axis also seems to be part of the X-shape structure, representing an outflow from the galactic center region to a vertical height of 15 (11 kpc) (Fig. 9). Thus, NGC 5775 appears to be similar to the starburst galaxy, NGC 253 (e.g. Vogler & Pietsch 1999; Pietsch et al. 2001; Strickland et al. 2000) with its nuclear conical outflow, yet it also has smaller-scale outflows associated with specific in-disk regions. As a result, it is not always straightfoward to interpret the origin of specific extraplanar features. An example is the large northeastern blob shown in Fig. 1 and Fig. 4 which seems to have a radio continuum counterpart. It is roughly above the F3 disturbance but could also be a result of the nuclear outflow. It is located about twice as far away from the galactic disk than the shell-like feature on the opposite side.
4.2 The sub-galactic scale “X-SF” relation
The relation between the integrated extraplanar soft X-ray intensity and the in-disk star formation intensity (hereafter referred to as an “X-SF” relation) has been demonstrated for active star-forming galaxies (Strickland et al. 2004b; Tllmann et al. 2006b). Fig. 10 compares this relation with a sub-galactic () scale version derived from our current work.

Since H emission may suffer from strong absorption in this edge-on case, we estimate the star formation rate from the 8 intensity using Wu et al. (2005)’s relation. We then convert the X-ray intensity to intrinsic luminosity using the halo spectral model (Table 3). Different in-disk regions should have different line-of-sight depth, so when calculating in-disk area we assume the disk has a circular shape with diameter of . To correct for projection, the inclination angle is adopted to be as listed in Table 1. Note that, although we use only the X-ray data in the southern halo to minimize absorption effects, Fig. 10 assumes the two sides have the same intrinsic luminosity.
The consistency of the “X-SF” relations found inside NGC 5775 and inferred from integrated galactic properties indicates that the efficiency of converting stellar feedback to the extraplanar hot gas does not change significantly from kpc to galactic scales. The threshold for the presence of the extraplanar X-ray emission on these scales seems to be , consistent with previous findings based on galaxy samples (Strickland et al. 2004b; Tllmann et al. 2006b). Fig. 10 also suggests that the conical nuclear outflow is not strongly perturbing the extraplanar X-ray emission that is above and below specific in-disk regions.
4.3 Physical and dynamic states of the extraplanar hot gas
In §3.2, we have shown that the halo spectrum consists of two hot gas components. There are now at least three ISM components co-existing in the halo of NGC 5775: the warm ionized gas traced by H emission, and the two hot gas components. Inferred from H and optical spectroscopic observation, the warm ionized gas has a temperature of (Collins & Rand 2001) and density of (Collins et al. 2000). The warm gas likely has a low filling factor compared with the hot gas if a thermal pressure balance is established between the warm and hot gas. Strickland et al. (2002) presented several disk/halo interaction models to interpret the multi-phase halo in NGC 253. In their models, H-emitting warm ionized gas can be produced through interaction between the outflow and the pre-existing gas in the halo, from the cooling of swept up outer shells, or simply by being dragged from the disk. Soft X-ray emission can arise from shock heated halo gas or from the conductive interfaces or turbulent mixing layers between cold halo clouds and the tenuous, low emissivity, and hot superwind.
Some parameters of the two hot gas components are listed in Table 4. These parameters are inferred from the spectral fitting parameters listed in Table 3, with the assumption that the total filling factor of the hot gas is and the two hot gas components reach the pressure balance with each other. We expect that hot gas is produced mainly in the disk and then flows into the halo. The temperature of the gas depends on both the efficiencies of the mass loading as well as the radiative cooling and other energy dissipation processes (e.g., via cosmic rays and kinetic energy). Because the mass efficiency of star formation is only and the remaining molecular gas is dispersed on a time scale of yrs, substantial massloading to hot gas is expected in recent star forming regions. With the presence of the dense gas, radiative and mechanical cooling can also be important. In contrast, the heating of gas by core-collapsed SNe can be more efficient in older star formation regions ( yrs; the upper limit corresponds to the lifetime of an 8 star). Therefore, gas in an ongoing or recent star forming region can be cooler — explaining the low-temperature component of the hot gas — than in those older star formation regions, which are probably responsible for the hotter component. The lower temperature hot gas can also be produced in the halo at interfaces between the hot gas outflow and the pre-existing cooler gas. Radiative cooling generally has so long time scale for both hot gas components that it cannot be very important in the halo (Table 4), at least in the vicinity of the galactic disk.
The rim-brightened soft X-ray-emitting bubble likely represents the reverse-shocked outflow in the interior of an outer cool shell (Strickland et al. 2002). This cool gas shell could be formed in or near the disk, and then expand into the halo driven by the high pressure interior. During the expansion of this cool shell, the magnetic field may play an important role in preventing the Rayleigh-Taylor instability which would break the shell, given that the magnetic pressure may be comparable with the thermal pressure of the halo hot gas (see below).
The northeast blob may be compared with a similar feature “ridge” detected in M 82 (Lehnert, Heckman & Weaver 1999). The blob, elongated along the major axis instead of perpendicular to the major axis, is about twice as high as the M 82 ridge. Given that NGC 5775 does not have as strong a superwind as detected in M 82, and there is no clear sign of a cool gas counterpart for the blob, we speculate that it may represent a bulk of outflowing hot gas — an evolved outflowing wind bubble — generated in an early episode of massive star formation in the nuclear region of the galaxy. The relatively high concentration of the hot gas at such a large off-disk distance may be due to the confinement of a magnetic field loop, which would still be anchored in the disk. A magnetic field must be present because of the observed radio continuum counterpart. Data of higher quality is needed to truly understand the nature of the blob.
Although a magneto-hydrodynamic model of the nuclear outflow is beyond the scope of this paper, we can still make some general statements about halo conditions. For example, the magnetic pressure in the halo can be estimated from , where is the magnetic field strength in units of and is the volume filling factor of the magnetic field. In this relation, the magnetic field strength is assumed to have been determined from multi-frequency radio continuum maps, adopting an approximate energy equipartition between relativistic particles and the magnetic field. Using the radio continuum and spectral index maps of Duric et al. (1998) and an appropriate geometric model (see Irwin et al. 1999 and Irwin & Saikia 2003 for examples) we find a typical halo magnetic field strength of , implying for a unity filling factor, or higher if the filling factor is less than unity. The hot gas pressure in the halo is , derived from the hot gas parameters listed in Table 4. Although we expect variation in these quantities and filling factors are unknown, it is reasonable to conclude that the magnetic field will be dynamically important in any outflow model. Parker instabilities may also be present. Observations of the current field configuration shows roughly vertical fields across the disk-halo interface (see Tüllmann et al. 2000) although the field configuration far from the plane has yet to be observationally determined.
The feedback energy of the young and old stellar populations can be estimated from the IR (Heckman, Armus & Miley 1990) and K band (Mannucci et al. 2005) luminosity, which is in total. It is not easy to estimate the flow velocity of the hot gas, but we can adopt the sound speed in the higher temperature hot gas as an upper limit, which is . Using this velocity, the flowing time in the soft X-ray emitting halo is (adopting an extension of the soft X-ray emitting halo to be 10 kpc). This corresponds to a total energy feedback , enough to support the soft X-ray emission and the energy of the hot gas.
5 Summary
We have conducted a detailed Chandra study of NGC 5775 and compared the results to multi-wavelength data obtained from Spitzer and HST as well as high resolution ground-based H, radio continuum and H I data. The main results are as follows:
Ninety-nine discrete X-ray sources are detected in or near NGC 5775, 27 within the region, including a ULX with an absorbed (intrinsic) 0.3-7 keV luminosity of about .
Large-scale diffuse X-ray emission is detected to an extent nearly 10 kpc above the galactic disk in an extended halo region. There are several prominent plume-like features detected in the halo indicating hot gas outflows from the disk, some of which are clearly associated with the in-disk star formation regions. In particular, a huge shell-like feature appears in the southern halo, and has a radius of nearly 5 kpc. The soft X-ray luminosity of this feature is in the 0.3-2 keV band. On the opposite side, a large-scale “blob” is detected with a maximum projected distance from the galactic plane.
Our X-ray spectral analysis reveals that the halo hot gas can be decomposed into two characteristic components, with temperatures of about and . The total luminosity of the halo hot gas is .
The multi-phase halo is energetically consistent with stellar feedback. Current star formation with more mass loading may produce the lower temperature hot gas component, while recent and past star formation with less mass loading may be responsible for the higher temperature component. The soft X-ray shell-like feature likely represents an outflowing wind bubble from the galactic central region. The northeast blob may be an evolved version of such a bubble that is still confined by strong magnetic field. We find that the magnetic pressure is comparable to the hot gas pressure, and will therefore play an important role in the evolution of a multi-phase halo.
We have obtained an “X-ray-star formation” relation for sub-galactic scale star formation regions in this disk-wide star forming galaxy, and this relation is consistent with that inferred from the integrated galactic properties.
References
- (1) Barnab, M., Ciotti, L., Fraternali, F., & Sancisi, R. 2006, A&A, 446, 61
- (2) Brar, R. S., Irwin, J. A., & Saikia, D. J. 2003, MNRAS, 340, 269
- (3) Collins J. A., Rand R. J., Duric N., & Walterbos R. A. M. 2000, ApJ, 536, 645
- (4) Collins J. A. & Rand R. J. 2001, ApJ, 551, 57
- (5) Cox D. P. 2005, ARA&A, 43, 337
- (6) Dahlem M., Lisenfeld U., & Rossa J. 2006, A&A, 457, 121
- (7) Duric, N., Irwin, J., & Bloemen, H. 1998, A&A, 331, 428
- (8) Feigelson E. D., et al. 2002, ApJ, 574, 258
- (9) Fraternali F., Binney J., Oosterloo T., & Sancisi R. 2007, NewAR, 51, 95
- (10) Heald G. H., et al. 2006, ApJ, 636, 181
- (11) Heckman, T. M., Armus, L., & Miley, G. K. 1990, ApJS, 74, 833
- (12) Hunter D. A., Elmegreen B. G., & Martin E. 2006, AJ, 132, 801
- (13) Irwin J. A. 1994, ApJ, 429, 618
- (14) Irwin, J. A., English, J., & Sorathia, B. 1999, AJ, 117, 2102
- (15) Irwin, J. A., & Saikia, D. J. 2003, MNRAS, 346, 977
- (16) Kennicutt Jr. R. C. 1998, ARA&A, 36, 189
- (17) Lee S. W., et al. 2001, A&A, 377, 759
- (18) Lehnert M. D., Heckman T. M., & Weaver K. A. 1999, ApJ, 523, 575
- (19) Li Z. Y., Wang Q. D., & Hameed S. 2007, MNRAS, 376, 960
- (20) Mannucci F., et al. 2005, A&A, 433, 807
- (21) Moretti A., Campana S., Lazzati D., & Tagliaferri G. 2003, ApJ, 588, 696
- (22) Pietsch, W., et al. 2001, A&A, 365, L174
- (23) Reach W. T., et al. 2005, PASP, 117, 978
- (24) Rossa J., & Dettmar R.-J. 2003, A&A, 406, 493
- (25) Rossa J., Dahlem, M., Dettmar, R.-J., & van der Marel, R. P. 2008, AJ, submitted [arXiv:0804.3819]
- (26) Snowden S. L., et al. 1995, ApJ, 454, 643
- (27) Strickland D. K., et al. 2002, ApJ, 568, 689
- (28) Strickland D. K., et al. 2004a, ApJS, 151, 193
- (29) Strickland D. K., et al. 2004b, ApJ, 606, 829
- (30) Tllmann R., et al. 2000, A&A, 364, L36
- (31) Tllmann R., et al. 2006a, A&A, 448, 43
- (32) Tllmann R., et al. 2006b, A&A, 457, 779
- (33) Vogler, A., & Pietsch, W. 1999, A&A, 342, 101
- (34) Wang Q. D., et al. 1995, ApJ, 439, 176
- (35) Wang Q. D. 2001, in: ”Galaxy Disks and Disk Galaxies”, ASP Conference Series, Vol. 230., eds. J.G. Funes, S.J. and E.M. Corsini. p. 393
- (36) Wang Q. D., Chaves T., & Irwin J. A. 2003, ApJ, 598, 969
- (37) Wang Q. D. 2004, ApJ, 612, 159
- (38) Willingale R., et al. 2003, MNRAS, 343, 995
- (39) Wu H., et al. 2005, ApJ, 632, L79
| Parameter | NGC 5775 | |
|---|---|---|
| Morphologya | Sb(f) | |
| Center positiona | R.A. 14h53m57.6s | |
| (J2000) | Dec. +03d32m40s | |
| Inclination angleb | ||
| Distance (Mpc)b | 24.8 (1 0.12 kpc) | |
| b | ||
| b | ||
| c | ||
| (arcmin)a | 4.2 | |
| (arcsec)d | ||
| Galactic foreground | 3.48 | |
| a | 1.28 | |
| f | 5.38 | |
| 9.1 |
Note. — References. - a. NED, is the diameter at , is the 2MASS K-band luminosity; b. Irwin (1994), is the H I mass, is the total mass; c. HYPERLEDA, is the apparent maximum rotation velocity of gas; d. is the star formation diameter, averaged from H, radio continuum and dust emission; e. HEASARC web tools; f. IRAS IR luminosity , where is the distance to the galaxy in Mpc and , , , and are the 12, 25, 60, and 100 m fluxes, respectively, in Jy; g. is calculated from using the Kennicutt (1998) relation.
| Source | CXOU Name | (′′) | CR | HR | HR1 | Flag |
|---|---|---|---|---|---|---|
| (1) | (2) | (3) | (4) | (5) | (6) | (7) |
| 1 | J145338.06+033401.3 | 1.1 | – | – | B | |
| 2 | J145339.94+033418.9 | 0.6 | B, S, H | |||
| 3 | J145340.60+033340.6 | 0.9 | – | – | B, S, H | |
| 4 | J145341.43+033442.2 | 0.9 | – | – | B, H | |
| 5 | J145342.23+033142.8 | 0.8 | – | – | B, H, S | |
| 6 | J145342.49+033248.2 | 0.8 | – | – | S, B | |
| 7 | J145342.77+033503.3 | 0.7 | – | – | B, S | |
| 8 | J145342.81+033704.8 | 0.8 | – | B, S, H | ||
| 9 | J145343.05+033647.2 | 1.9 | – | – | S | |
| 10 | J145343.78+033427.1 | 0.5 | – | B, S, H | ||
| 11 | J145344.02+032929.7 | 1.7 | – | – | S | |
| 12 | J145344.69+033330.8 | 0.4 | B, S, H | |||
| 13 | J145344.83+033458.9 | 0.8 | – | – | H, B | |
| 14 | J145344.84+033257.5 | 0.5 | – | – | B, S, H | |
| 15 | J145345.17+033348.6 | 0.5 | – | – | B, S, H | |
| 16 | J145346.26+033350.4 | 0.6 | – | – | B, H | |
| 17 | J145346.28+033347.1 | 0.6 | – | – | B, S | |
| 18 | J145346.37+033023.0 | 1.6 | – | – | H | |
| 19 | J145346.50+033459.5 | 0.5 | – | – | B, H | |
| 20 | J145346.63+033257.8 | 0.4 | – | – | B, S, H | |
| 21 | J145346.64+033731.2 | 1.2 | – | – | S | |
| 22 | J145347.51+033341.5 | 0.5 | – | – | B, H | |
| 23 | J145347.89+033404.8 | 0.4 | – | – | B, S, H | |
| 24 | J145348.28+033402.3 | 0.3 | B, S, H | |||
| 25 | J145348.62+033158.8 | 0.4 | – | – | B, S, H | |
| 26 | J145349.26+033137.8 | 0.6 | – | B, H | ||
| 27 | J145349.29+033411.4 | 0.6 | – | – | B, H | |
| 28 | J145350.93+032909.9 | 0.9 | – | – | B, H | |
| 29 | J145350.94+033124.2 | 0.6 | – | B, H | ||
| 30 | J145351.89+033524.2 | 0.4 | – | – | B, S, H | |
| 31 | J145352.30+033317.9 | 0.4 | – | – | B, S, H | |
| 32 | J145352.50+033405.8 | 0.6 | – | – | B, H, S | |
| 33 | J145352.65+033140.6 | 0.3 | – | – | B, S, H | |
| 34 | J145353.13+033255.4 | 0.3 | – | B, H, S | ||
| 35 | J145353.70+033623.9 | 0.5 | – | B, S, H | ||
| 36 | J145354.13+033154.3 | 7.5 | – | – | B | |
| 37 | J145354.19+033318.9 | 0.8 | – | – | B, S, H | |
| 38 | J145354.30+033349.8 | 0.5 | – | – | B, H, S | |
| 39 | J145354.33+032707.7 | 1.6 | – | – | H | |
| 40 | J145354.36+033548.6 | 0.9 | – | H | ||
| 41 | J145354.68+033043.2 | 0.5 | – | – | B, S, H | |
| 42 | J145354.68+033345.7 | 1.5 | – | B | ||
| 43 | J145354.74+033340.5 | 0.3 | B, S, H | |||
| 44 | J145354.77+033225.4 | 0.8 | – | – | H, B | |
| 45 | J145355.08+033332.5 | 1.3 | – | – | H | |
| 46 | J145355.14+033245.8 | 0.5 | – | – | B, S, H | |
| 47 | J145355.15+032947.9 | 0.6 | – | – | S, B | |
| 48 | J145355.24+033229.1 | 0.3 | B, S, H | |||
| 49 | J145355.28+032539.9 | 2.1 | – | – | B, H | |
| 50 | J145355.65+033006.3 | 1.0 | – | H | ||
| 51 | J145355.75+033328.0 | 0.2 | B, H, S | |||
| 52 | J145355.81+033518.4 | 0.5 | – | – | B, H | |
| 53 | J145355.89+033430.1 | 0.5 | – | – | B, S | |
| 54 | J145355.90+032913.9 | 0.6 | B, S, H | |||
| 55 | J145355.92+033400.7 | 0.2 | B, H, S | |||
| 56 | J145356.25+033303.2 | 0.5 | – | – | B, S, H | |
| 57 | J145356.43+032706.8 | 1.3 | – | – | B, S | |
| 58 | J145356.75+033308.4 | 1.7 | – | – | B | |
| 59 | J145356.79+033129.3 | 0.3 | B, S, H | |||
| 60 | J145356.85+033240.8 | 0.8 | – | – | B, H | |
| 61 | J145356.89+033257.5 | 0.4 | – | B, S, H | ||
| 62 | J145357.15+033251.3 | 0.5 | – | – | B, S, H | |
| 63 | J145357.35+033243.0 | 0.5 | – | H, B | ||
| 64 | J145357.42+033226.2 | 0.7 | – | – | B, H | |
| 65 | J145357.62+033241.8 | 0.5 | – | – | B, H, S | |
| 66 | J145357.66+033236.6 | 0.8 | – | – | H | |
| 67 | J145357.66+033030.2 | 0.5 | – | B, H | ||
| 68 | J145357.71+033240.4 | 0.8 | – | – | B | |
| 69 | J145357.76+033250.3 | 0.9 | – | – | H | |
| 70 | J145357.89+033238.3 | 0.6 | – | B, H | ||
| 71 | J145357.92+032815.3 | 1.0 | – | – | B, H | |
| 72 | J145357.97+033217.3 | 1.0 | – | – | B | |
| 73 | J145358.63+032744.9 | 1.1 | – | – | S, B | |
| 74 | J145358.66+033506.4 | 0.4 | – | – | B, S | |
| 75 | J145358.81+033303.5 | 1.2 | – | – | S, B | |
| 76 | J145358.89+033216.7 | 0.2 | B, H, S | |||
| 77 | J145359.44+033157.2 | 0.3 | H, B, S | |||
| 78 | J145359.47+033147.8 | 0.4 | – | B, H, S | ||
| 79 | J145359.61+033138.9 | 1.0 | – | – | H | |
| 80 | J145359.75+033140.2 | 0.3 | – | – | B, H, S | |
| 81 | J145400.15+033131.2 | 0.4 | – | – | S, B | |
| 82 | J145400.81+033130.9 | 0.4 | – | H, B | ||
| 83 | J145400.95+033129.4 | 0.3 | – | B, H, S | ||
| 84 | J145400.96+033133.1 | 0.3 | – | B, H, S | ||
| 85 | J145401.47+033753.3 | 0.8 | B, S, H | |||
| 86 | J145402.59+033014.7 | 0.7 | – | – | B, S | |
| 87 | J145402.85+033917.9 | 1.3 | – | – | B, S | |
| 88 | J145402.96+033210.1 | 0.4 | – | – | B, S, H | |
| 89 | J145403.51+033842.8 | 1.7 | – | – | H | |
| 90 | J145404.84+033422.3 | 0.5 | – | – | B, H | |
| 91 | J145404.88+032722.4 | 1.4 | – | – | B | |
| 92 | J145405.71+033126.4 | 0.6 | – | – | B, S, H | |
| 93 | J145405.77+033028.7 | 0.6 | – | – | B, S, H | |
| 94 | J145406.56+033327.0 | 0.7 | – | – | B, H | |
| 95 | J145407.95+033102.1 | 0.7 | – | – | B, S | |
| 96 | J145410.14+032734.2 | 1.3 | – | – | B, S | |
| 97 | J145411.08+033016.1 | 1.1 | – | – | B, S | |
| 98 | J145413.24+033244.9 | 0.6 | B, S, H | |||
| 99 | J145414.09+033101.3 | 0.8 | – | – | B, S, H |
Note. — The definition of the bands: 0.3–0.7 (S1), 0.7–1.5 (S2), 1.5–3 (H1), and 3–7 keV (H2). In addition, S=S1+S2, H=H1+H2, and B=S+H. Column (1): Generic source number. (2): Chandra X-ray Observatory (unregistered) source name, following the Chandra naming convention and the IAU Recommendation for Nomenclature (e.g., http://cdsweb.u-strasbg.fr/iau-spec.html). (3): Position uncertainty (1) calculated from the maximum likelihood centroiding and an approximate off-axis angle () dependent systematic error (an approximation to Fig. 4 of Feigelson, E., et al. 2002), which are added in quadrature. (4): On-axis source broad-band count rate — the sum of the exposure-corrected count rates in the four bands. (5-6): The hardness ratios defined as , and , listed only for values with uncertainties less than 0.2. (7): The label “B”, “S”, or “H” mark the band in which a source is detected with the most accurate position that is adopted in Column (2). This table will be published online only.
| Region | Model | |||||||
|---|---|---|---|---|---|---|---|---|
| (keV) | () | (keV) | () | |||||
| (1) | (2) | (3) | (4) | (5) | (6) | (7) | (8) | (9) |
| ULX | PL | - | - | - | - | 50.6/44 | ||
| Disk | Mekal+PL | 1.31 | - | - | 1.34 (fixed) | 92.9/74 | ||
| Halo | Mekal+Mekal | 3.48 (fixed) | 0.17 () | 0.047 | 0.017 | - | 70.4/69 |
Note. — (1) Regions from which spectra were extracted; (2) Mekal = XSPEC MEKAL thermal plasma model, PL = Power Law; (3) Hydrogen absorption column density; (4)(6) Temperatures of the thermal components; (5)(7) Emission measure of the thermal components; (8) Photon index of the PL component; (9) Statistics of the spectral fit. Note that the last column is calculated with the sky background, while the spectra shown in Fig. 8 is after sky background subtraction.
| Parameters | Low T Component | High T Component |
|---|---|---|
| Volume Filling Factor | 0.2 | 0.8 |
| Number Density () | 4.5 | 1.3 |
| Mass () | 2.4 | 2.9 |
| Thermal Energy () | 1.4 | 5.5 |
| Cooling Time Scale () | 2.0 | 13 |
Note. — These quantities are derived from the parameters listed in Table 3, assuming that the filling factor of the hot gas is () for the high (low) temperature component with , and that the hot gas is located in a cylinder with a diameter of .