Keeping the Universe ionised: Photo-heating and the clumping factor of the high-redshift intergalactic medium
Abstract
The critical star formation rate density required to keep the intergalactic hydrogen ionised depends crucially on the average rate of recombinations in the intergalactic medium (IGM). This rate is proportional to the clumping factor , where and are the local and cosmic mean baryon density, respectively and the brackets indicate spatial averaging over the recombining gas in the IGM. We perform a suite of cosmological smoothed particle hydrodynamics simulations that include radiative cooling to calculate the volume-weighted clumping factor of the IGM at redshifts . We focus on the effect of photo-ionisation heating by a uniform ultra-violet background and find that photo-heating strongly reduces the clumping factor because the increased pressure support smoothes out small-scale density fluctuations. Photo-ionisation heating is often said to provide a negative feedback on the reionisation of the IGM because it suppresses the cosmic star formation rate by boiling the gas out of low-mass halos. However, because of the reduction of the clumping factor it also makes it easier to keep the IGM ionised. Photo-heating therefore also provides a positive feedback which, while known to exist, has received much less attention. We demonstrate that this positive feedback is in fact very strong. Using conservative assumptions, we find that if the IGM was reheated at , the observed population of star-forming galaxies at may be sufficient to keep the IGM ionised, provided that the fraction of ionising photons that escape the star-forming regions to ionise the IGM is larger than .
keywords:
cosmology: theory - methods: numerical - hydrodynamics - radiative transfer - intergalactic medium - galaxies: formation1 Introduction
The absence of a Gunn-Peterson trough in the majority of the observed absorption spectra towards high-redshift quasars suggests that the reionisation of intergalactic hydrogen was completed at a redshift (see Fan, Carilli,& Keating, 2006 for a recent review) and that it remained highly ionised ever since. Current observational estimates of the ultra-violet (UV) luminosity density at redshifts (e.g. Stanway, Bunker, & McMahon, 2003; Lehnert & Bremer, 2003; Bunker et al., 2004; Bouwens et al., 2004; Yan & Windhorst, 2004; Sawicki & Thompson, 2006; Bouwens et al., 2006; Mannucci et al., 2007; Oesch et al., 2008; Bouwens et al., 2008), on the other hand, may imply star formation rate (SFR) densities several times lower than the critical SFR density required to keep the intergalactic medium (IGM) ionised (but see, e.g., Stiavelli, Fall, & Panagia, 2004; Malhotra et al., 2005; Panagia et al., 2005). Taken at face value, these low SFR densities pose a severe challenge to commonly employed theoretical models in which the observed population of star-forming galaxies is the only source of ionising radiation in the high-redshift Universe.
There are, however, large uncertainties associated with both the observationally inferred (see, e.g., the comprehensive analysis of Bouwens et al., 2007) and the critical SFR densities. The critical SFR density,
| (1) | |||||
here rescaled to match the most recent WMAP estimate for the cosmic baryon density (Komatsu et al., 2008), has been derived by Madau, Haardt, & Rees (1999) using an early version of the Bruzual & Charlot (2003) population synthesis code, assuming a Salpeter initial stellar mass function (IMF) and solar metallicity. It results from simply equating the spatially averaged rate at which ionising photons are emitted into the IGM to the spatially averaged rate at which the intergalactic gas recombines. Eq. 1 is therefore incapable of addressing a number of potentially important physical effects. Some ionising photons will, for instance, redshift below the ionisation threshold before ionising and some ionising photons will have been emitted longer than a recombination time ago upon impact with a neutral atom, so that equating instantaneous rates is not appropriate and one even may have to take source evolution into account. It is therefore important to keep in mind that Eq. 1 is likely only accurate within factors of a few.
The critical SFR is inversely proportional to the escape fraction , i.e. the fraction of ionising photons produced by star-forming galaxies that escape the interstellar medium (ISM) to ionise the IGM, and proportional to the average recombination rate in the IGM. The latter is parametrised using the dimensionless clumping factor , where is the baryon density, is the mean baryon density of the Universe and the brackets indicate spatial averaging over the gas constituting the recombining IGM. Under the assumption of a uniformly ionised IGM, the clumping factor expresses the spatially averaged number of recombinations occurring per unit time and unit volume in the ionised IGM, relative to that in gas at the cosmic mean density . A larger escape fraction implies a smaller critical SFR density, as more photons are available to ionise the IGM. On the other hand, a larger clumping factor implies a larger critical SFR density since more ionising photons are required to compensate for the increased number of recombinations.
Most observational studies that compare111Note that although the critical SFR density is sensitive to the IMF, this comparison is insensitive to the IMF provided the same IMF is used to compute the critical and observationally derived SFR densities. This is because the UV luminosity density is dominated by the same massive stars that are responsible for the emission of ionising photons with energies (Madau, Haardt, & Rees, 1999). the SFR density derived from estimates of the UV luminosity density at redshift to the critical SFR density assume an escape fraction and a clumping factor . While a variety of both observational and theoretical studies (e.g. Inoue, Iwata, & Deharveng, 2006 and references therein; Razoumov & Sommer-Larsen, 2006; Gnedin, Kravtsov, & Chen, 2008a) have ruled out larger escape fractions, the estimate for the clumping factor comes from a single cosmological simulation performed more than 10 years ago (Gnedin & Ostriker, 1997). It is on the basis of these values for the escape fraction and the clumping factor that the observed population of galaxies has been found to be incapable of keeping the intergalactic hydrogen ionised, forming massive stars at a rate which is up to an order of magnitude lower than required by Eq. 1.
It has been pointed out that this discrepancy between the inferred and critical SFR densities could be resolved if the employed clumping factor were too high (e.g. Sawicki & Thompson, 2006; see also the discussion in Bouwens et al., 2007). Indeed, in most (but not all) of the more recent theoretical theoretical studies (e.g. Valageas & Silk, 1999; Miralda-Escudé, Haehnelt, & Rees, 2000; Gnedin, 2000a; Haiman, Abel, & Madau, 2001; Benson et al., 2001; Chiu, Fan, & Ostriker, 2003; Iliev et al., 2007; Srbinovsky & Wyithe, 2007; Kohler, Gnedin, & Hamilton, 2007; Bolton & Haehnelt, 2007; Maio et al., 2007; Furlanetto, Haiman, & Oh, 2008) significantly lower clumping factors were derived. On the other hand, it is sometimes emphasised that simulations underestimate the clumping factor, due to a lack of resolution (see, e.g., Madau, Haardt, & Rees, 1999). In this work we perform a set of cosmological Smoothed Particle Hydrodynamics (SPH) simulations that include radiative cooling and photo-ionisation by a uniform UV background in the optically thin limit to study the clumping factor of the IGM.
We focus on the effect of photo-ionisation heating on the evolution of the clumping factor. Previous investigations of the impact of photo-heating on the reionisation of the IGM have almost exclusively come to the conclusion that it acts as to provide a negative feedback. Photo-heating boils the gas out of the potential wells of dark matter (DM) halos with virial temperatures (e.g. Thoul & Weinberg, 1996; Navarro & Steinmetz, 1997; Barkana & Loeb, 1999; Kitayama & Ikeuchi, 2000; Gnedin, 2000b; Dijkstra et al., 2004; Shapiro, Iliev, & Raga, 2004; Hoeft et al., 2006; Crain et al., 2007; Mesinger & Dijkstra, 2008; Okamoto, Gao, & Theuns, 2008; Pawlik & Schaye, 2008). This inhibits the formation of stars in these low-mass halos and thus decreases the ionising emissivity, which makes it more difficult to reionise the Universe. The same mechanism that reduces the number of ionising photons that are emitted into the IGM does, however, also affect the evolution of the clumping factor (e.g. Haiman, Abel, & Madau, 2001; Oh & Haiman, 2003; Kuhlen & Madau, 2005; Wise & Abel, 2005; Furlanetto, Oh, & Briggs, 2006; Ciardi & Salvaterra, 2007).
In this paper we demonstrate that photo-heating significantly lowers the clumping factor and hence the average recombination rate in the IGM. While photo-ionisation heating undoubtedly impedes the production of ionising photons, our results imply that it also makes it much easier to keep the IGM ionised.
2 Simulations
| Simulation | winds | WMAP | ||||||
|---|---|---|---|---|---|---|---|---|
| year | ||||||||
| r9L6N256 | no | |||||||
| L6N256 | no | |||||||
| r[]L6N256 | no | |||||||
| r9L6N256highT | no | |||||||
| r9L6N256lowT | no | |||||||
| r9L6N256winds | yes | |||||||
| r9L6N256W1 | no | |||||||
| r9L6N256W3 | no | |||||||
| r9L12N256 | no | |||||||
| r9L6N128 | no | |||||||
| r9L6N064 | no | |||||||
| r9L3N064 | no |
We use a modified version of the N-body/TreePM/SPH code gadget-2 (Springel, 2005) to perform a suite of cosmological SPH simulations including radiative cooling.
The initial particle positions and velocities are obtained from glass-like initial conditions using cmbfast (version 4.1; Seljak & Zaldarriaga, 1996) and employing the Zeldovich approximation to linearly evolve the particles down to redshift z = 127. We assume a flat CDM universe and employ the set of cosmological parameters given by , in agreement with the WMAP 5-year observations (Komatsu et al., 2008). For comparison, we also perform some simulations employing the set of cosmological parameters and , consistent with WMAP 3-year (Spergel et al., 2007) and WMAP 1-year (Spergel et al., 2003) observations, respectively. Data is generated at equally spaced redshifts between and . The parameters of the simulations employed for the present work are summarised in Table 1.
The gravitational forces are softened over a length of of the mean dark matter inter-particle distance. We employ the star formation recipe of Schaye & Dalla Vecchia (2008), to which we refer the reader for details. Briefly, gas with densities exceeding the critical density for the onset of the thermo-gravitational instability (hydrogen number densities ) is expected to be multiphase and star-forming (Schaye, 2004). We therefore impose an effective equation of state (EoS) with pressure for densities , where , normalised to at the critical density . We use for which both the Jeans mass and the ratio of the Jeans length and the SPH kernel are independent of the density, thus preventing spurious fragmentation due to a lack of numerical resolution. Gas on the effective EoS is allowed to form stars using a pressure-dependent rate that reproduces the observed Kennicutt-Schmidt law (Kennicutt, 1998), renormalised by a factor222This conversion factor between SFRs has been computed using the Bruzual & Charlot (2003) population synthesis code for model galaxies of age forming stars at a constant rate and is insensitive to the assumed metallicity. of to account for the fact that it assumes a Salpeter IMF whereas we are using a Chabrier IMF.
The gas is of primordial composition, with a hydrogen mass fraction and a helium mass fraction . Radiative cooling and heating are included assuming ionisation equilibrium, using tables generated with the publicly available package cloudy (version 05.07 of the code last described by Ferland et al., 1998), as described in Wiersma, Schaye & Smith (2008). The gas is allowed to cool by collisional ionisation and excitation, emission of free-free and recombination radiation and Compton cooling off the cosmic microwave background.
We perform a set of simulations including photo-ionisation by a uniform UV background in the optically thin limit at redshifts below the reheating redshift . These simulations are denoted with the prefix r (see Table 1). To study the effect of reionisation reheating, we compare these simulations to a simulation that does not include photo-ionisation (L6N256). Note that the photo-ionisation changes the density of free electrons and the ionic abundances. Both the cooling and heating rates are therefore affected by the inclusion of a UV background (e.g. Efstathiou, 1992; Wiersma, Schaye & Smith, 2008).
The properties of the UV background depend on the redshift of reheating. If , we employ the evolving UV background from quasars and galaxies tabulated by Haardt & Madau (2001) for . If , we use the Haardt & Madau (2001) UV background for all redshifts , and employ the evolving Haardt & Madau (2001) UV background for redshifts . This is necessary because Haardt & Madau (2001) only tabulate up to . For , we employ the Haardt & Madau (2001) UV background but with its intensity at energies equal to and larger than set to zero. Molecular hydrogen and deuterium and their catalysts are kept photo-dissociated by this soft UV background at all redshifts and therefore never contribute to the cooling rate. Our approach is motivated in the context of reionisation because the weak UV background established by the very first ionising sources is already sufficient to efficiently suppress the formation of molecular hydrogen (e.g. Haiman, Rees, & Loeb, 1997 and references therein; Glover, 2007; Chuzhoy, Kuhlen, & Shapiro, 2007).


The reheating redshift is a parameter in our simulations. The most recent determination of the Thomson optical depth towards reionisation from the WMAP (5-year) experiment implies a reionisation redshift , assuming that the transition from the neutral to the fully ionised Universe was instantaneous (Komatsu et al., 2008). The Thomson optical depth towards reionisation provides, however, only an integral constraint on the Epoch of Reionisation. The reionisation history may therefore have been considerably more intricate. An early population of X-ray sources, for example, could reheat the IGM to temperatures already at much higher redshifts (e.g. Collin-Souffrin, 1991; Madau & Efstathiou, 1999; Oh, 2001; Venkatesan, Giroux, & Shull, 2001; Machacek, Bryan, & Abel, 2003; Madau et al., 2004; Ricotti & Ostriker, 2004). We therefore study a range of thermal histories, performing simulations using and . To be conservative, we use the relatively low reheating redshift as our default value.
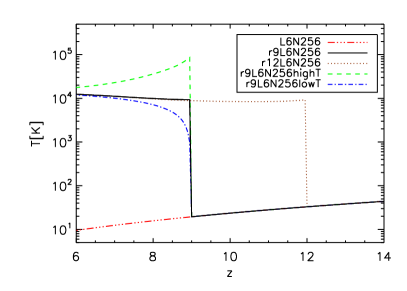
In our simulations we compute the photo-heating rates in the optically thin limit, which means that we underestimate the temperature of the IGM during reionisation (e.g. Abel & Haehnelt, 1999). We therefore inject an additional thermal energy per proton at (see, e.g., Thoul & Weinberg, 1996). By varying the parameter , we will investigate the sensitivity of our results to the temperature of the reheated IGM. Our default simulation employs . Fig. 1 shows the thermal evolution of gas at the cosmic mean baryon density , i.e. of gas with overdensity , for different values of and . At , the gas is heated to for , whereas the gas temperature is about an order of magnitude higher (lower) for (). After reheating the gas quickly looses memory of its initial temperature and by the gas temperature is in all cases.
In one of our simulations (r9L6N256winds) we include kinetic feedback from star formation. We employ the prescription of Dalla Vecchia & Schaye (2008), which is a variation of the Springel & Hernquist (2003) recipe for kinetic feedback. In this prescription, core-collapse supernovae locally inject kinetic energy and kick gas particles into winds. The feedback is specified by two parameters, the mass loading , which describes the initial wind mass loading in units of the cosmic SFR , and the initial wind velocity . We use and , consistent with observations of local (e.g. Veilleux, Cecil, & Bland-Hawthorn, 2005) and redshift (Shapley et al., 2003) starburst galaxies. Note that wind particles are not hydrodynamically decoupled and that they are launched local to the star formation event, different from the Springel & Hernquist (2003) recipe.
3 Results
In this section we employ the set of simulations described in Section 2 and summarised in Table 1 to calculate the clumping factor of the IGM. We start in Section 3.1 with analysing the distribution of the gas in our default simulation r9L6N256 and in the simulation L6N256, which is identical to our default simulation except for the fact that it does not include a photo-ionising background. In Section 3.2 we discuss the definition of the clumping factor and compare the clumping factors derived from our default simulation r9L6N256 to that derived from simulation L6N256. We discuss the convergence of our results with respect to variations in the mass resolution and in the size of the simulation box in Section 3.2.1. In Section 3.2.2 we vary the redshift at which the ionising UV background is turned on and in Section 3.2.3 we demonstrate that our conclusions are robust with respect to our choice for the temperature to which the IGM is photo-heated. In Section 3.2.4 we discuss how kinetic feedback from supernova winds affects our results and quote the clumping factors obtained from the simulations employing WMAP 3-year and 1-year cosmological parameters. We conclude with a brief comparison to previous work.
3.1 The gas density distribution
Here we compare the gas distributions in our default simulation r9L6N256 (in which the UV background is turned on at redshift ) and in the simulation L6N256 (which does not include photo-ionisation heating).
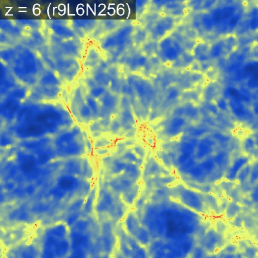
Figure 2 shows the overdensities at redshifts and in a slice through the simulation box for these simulations. Heating by the photo-ionising background almost instantaneously increases the gas temperatures to (see Fig. 1) and accordingly raises the cosmological Jeans mass. Gas that had already settled into the potential wells of DM halos with virial temperature is driven back into the diffuse IGM by the increased pressure gradient forces (e.g. Barkana & Loeb, 1999; Shapiro, Iliev, & Raga, 2004). The large cosmological Jeans mass prevents any re-accretion of gas or infall of previously unbound gaseous material into these low-mass halos and keeps the IGM diffuse. Comparing the middle panel with the right-hand panel of Fig. 2, this Jeans filtering (e.g. Shapiro, Giroux, & Babul, 1994; Gnedin & Hui, 1998; Gnedin, 2000b; Okamoto, Gao, & Theuns, 2008) in the presence of photo-heating leads to a strong smoothing of the small-scale density fluctuations by .
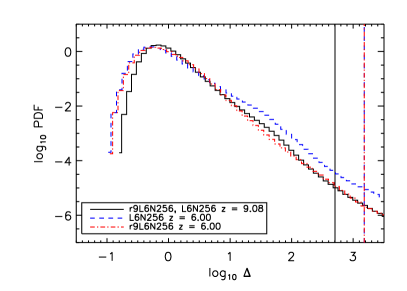
A detailed analysis of the overdensity distribution in the simulations can be obtained by studying , the volume-weighted probability density function (PDF) for . We show the PDF (per unit and normalised according to ) in the left-hand panel of Fig. 3. It is important to be aware of the fact that the finite numerical resolution of our simulations implies an unavoidable intrinsic smoothing of the gas density distribution on the scale of the SPH kernel or the scale over which the gravitational forces are softened, whichever is larger. A numerical smoothing on scales larger than the Jeans filtering scale (below which the gas density distribution is physically smoothed) would prevent us from obtaining converged results. We will discuss the convergence of our simulations with respect to resolution in Section 3.2.1.
At redshift (black solid histogram), the gravitational amplification of the overdensities present in the initial conditions has produced a significant deviation of the PDF from its primordial Gaussian shape. The flattening of the slope of the PDF for overdensities can be attributed to the shock-heating of gas falling into the potential wells of dark matter halos, most of which have virial temperatures , which we refer to as low-mass halos. The shape of the PDF is determined by the effective EoS once the gas reaches the critical density for the onset of star formation (, see Section 2; indicated by the vertical lines).
At redshifts , the shape of the PDF strongly depends on whether photo-heating by the ionising background is included or not. In the absence of such a background (L6N256, blue dashed histogram), gravitational collapse proceeds unimpeded, increasing the PDF at . Since the gas that accretes onto DM halos must originate from the reservoir at (the diffuse IGM), the PDF decreases over this range of overdensities. As a result, the maximum of the PDF shifts to lower overdensities. At the same time, the gravitational amplification of large-scale underdense regions leads to an increase in the PDF around overdensities .
Photo-heating in the presence of the ionising background photo-evaporates the gas in DM halos, as described above. The bump in the PDF around therefore disappears (red dot-dashed histogram). Note that the redistribution of the baryons due to photo-heating also slightly increases the minimum overdensity that is present in the simulation. In Appendix A.2 we compare the PDF obtained from our default simulation to the fit provided by Miralda-Escudé, Haehnelt, & Rees (2000), which is often employed to compute the clumping factor in (semi-)analytical studies of the epoch of reionisation.
3.2 The clumping factor
In this section we demonstrate how the clumping factor, , depends on the definition of the IGM and compute it for our default simulation r9L6N256 and for the simulation L6N256. This allows us to investigate how the clumping factor is affected by the inclusion of a photo-ionising background.
Our main motivation for computing the clumping factor of the IGM is to evaluate the critical SFR density required to keep the IGM ionised. The critical SFR density describes the balance between the number of ionising photons escaping into the IGM (parametrised by the escape fraction) and the number of ionising photons that are removed from the IGM due to photo-ionisations of recombining hydrogen ions (parametrised by the clumping factor). When the ratio of photon escape rate to recombination rate is larger than unity, the rate at which galaxies form stars exceeds the critical SFR density and is thus sufficient to keep the IGM ionised.
It is important to realise that only recombinations leading to the removal of ionising photons which escaped the ISM of the star-forming regions contribute to the balance that gives rise to the definition of the critical SFR density. To separate the gas in the ISM from the gas in the IGM, a simple threshold density criterion is often employed (e.g. Miralda-Escudé, Haehnelt, & Rees, 2000; see also the discussion in Miralda-Escudé, 2003). Ionising photons are counted as escaped once they enter regions with gas densities . Consequently, only gas with densities , or equivalently, gas with overdensities should be considered in the evaluation of the clumping factor.
The threshold density depends on which gas is considered to be part of the ISM, and which gas is considered to be part of the IGM. As long as the definition of the escape fraction and that of the clumping factor refer to the same decomposition of the gas into IGM and ISM, its value can be chosen arbitrarily. We therefore treat the threshold density as a parameter and compute the clumping factor as a function of (cp. Miralda-Escudé, Haehnelt, & Rees, 2000),
| (2) |
where is normalised according to . In practice, we calculate by performing a volume-weighted summation over all SPH particles with overdensities , i.e
| (3) |
where is the radius of the SPH smoothing kernel associated with SPH particle . We verified that replacing with as an estimate for the volume occupied by SPH particle (with mass ) gives nearly indistinguishable results.
By definition, increases monotonically with the threshold density . Here, we set an upper limit to , corresponding to the threshold density for the onset of star formation that we employ in our simulations. Since we impose an effective EoS for gas with densities larger than (Section 2), its PDF is not expected to reflect the PDF of real star-forming regions, motivating our choice for the maximum threshold density. The choice is conservative, leading to an overestimate rather than an underestimate of the critical SFR density, since the threshold density marking the escape of ionising photons and hence the clumping factor of the IGM to be used in Eq. 1 is likely to be lower (see, e.g., the discussion in Gnedin, 2008b).
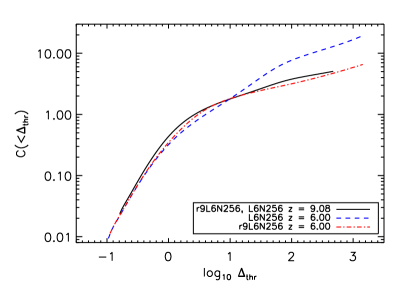
In the right-hand panel of Fig. 3 we show for the simulations r9L6N256 and L6N256 at redshifts shortly before (at , when r9L6N256 and L6N256 are identical) and well after (at , when they differ by the presence and absence of an ionising background, respectively) the reheating redshift . In agreement with our discussion above, the clumping factor increases monotonically with the threshold density. Its dependence on redshift can be understood by looking at the evolution of the shape of the PDF, which we discussed in the previous section.
For L6N256, i.e. in the absence of photo-heating, the clumping factor for threshold overdensities is larger at than at , due mainly to the growth of the bump present in the PDF for overdensities . For , on the other hand, the clumping factor is slightly smaller at than at , which is caused by the depletion of the diffuse IGM through accretion onto DM halos. Note that at the clumping factor reaches a maximum value of , which is significantly smaller than the value quoted by Gnedin & Ostriker (1997), which is commonly employed in observational studies. This is probably because Gnedin & Ostriker (1997) computed the clumping factor including gas of any density, i.e. using a density threshold implicitly set by the maximum overdensity resolved in their simulation.
The evolution of the clumping factor in r9L6N256, i.e. in the presence of the ionising background, is very different. At it is close to that at for all threshold overdensities. Compared to L6N256, the difference between the clumping factors for and is greatly reduced and the clumping factor at redshift never reaches values larger than .
3.2.1 Convergence tests
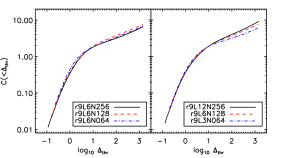
In this section we check whether our results are converged. Generally, one expects the clumping factor to increase with both the spatial resolution and the size of the simulation box. The spatial resolution determines the smallest scale on which fluctuations in the density field may be identified, whereas the size of the simulation box sets a cut-off to the largest scale on which the overdensity field can be non-zero. Moreover, the size of the simulation box limits the mass of the largest halo present in the simulation. Fig. 4 demonstrates that our default simulation (r9L6N256) is of sufficiently high resolution and employs a sufficiently large box to allow a faithful computation of the clumping factor of the reheated IGM at . In the left-hand panel we show the clumping factor in three simulations that use the same box size, but have mass resolutions that differ by multiples of , whereas in the right-hand panel we show the clumping factor in three simulations that employ the same resolution, but have box sizes that differ by multiples of 2.

When compared to our default simulation r9L6N256, decreasing the mass resolution by factors of (r9L6N128) and (r9L6N064) only leads to insignificant and unsystematic333Note that the clumping factor is even slightly larger in r9L6N128 than in r9L6N256, although the latter has an times higher mass resolution. changes in the clumping factor (left-hand panel). This can be understood by noting that the virial mass of halos corresponding to a virial temperature is resolved with particles for redshifts . Any further increase in resolution would therefore mostly affect the abundance of DM halos with . In the presence of the UV background the gas in these halos is, however, quickly photo-evaporated (if formed at ) or prevented from accreting by the large Jeans mass associated with the photo-heated gas (for ). At redshifts well below the reheating redshift , i.e. when sufficient time has passed to accomplish the photo-evaporation of halos and to allow the gas to respond hydrodynamically to the jump in the Jeans mass (i.e. to Jeans-filter the IGM), the observed convergence with respect to mass resolution is therefore expected444We note that in the absence of a photo-ionising background, convergence may be more difficult to achieve, requiring a higher mass resolution than employed here. Convergence will be easier to achieve for lower threshold densities..
Since the clumping factor has already converged for the spatial resolution used in simulation r9L6N128, we can employ this simulation to verify whether the size of the box of our default simulation r9L6N256 is sufficiently large to enable an unbiased estimate of the clumping factor (right-hand panel). Overall, increasing the box size (at fixed resolution) from by a factor of two to leaves the clumping factor almost unaffected. For threshold densities the clumping factor may, however, not yet have fully converged, indicating that even larger simulation boxes than that considered here may be required for its computation (see also the discussion in Barkana & Loeb, 2004).
3.2.2 Varying the reheating redshift
To study the effect of photo-heating on the evolution of the clumping factor in more detail, we make use of the clumping factors
| (4) |
and
| (5) |
is the clumping factor for gas with densities below , the maximum threshold density we consider. For redshifts , fixes the threshold overdensity to a value between the mean overdensity of spherical top-hat DM halos, (; e.g. Padmanabhan, 1993) and the overdensity at the virial radius of an isothermal DM halo (; Lacey & Cole, 1994) and closely agrees with the threshold densities commonly employed in the literature to calculate the clumping factor of the IGM. For larger redshifts, the threshold overdensity corresponds to a density , which is larger than the critical density for the onset of star formation in our simulations. The definition Eq. 5 ensures that the maximum density that we consider for the computation of is always smaller than . Note that refers to the clumping factor of gas with densities below a fixed proper density, while refers to the clumping factor of gas with densities below a fixed overdensity for redshifts and is identical to for larger redshifts.
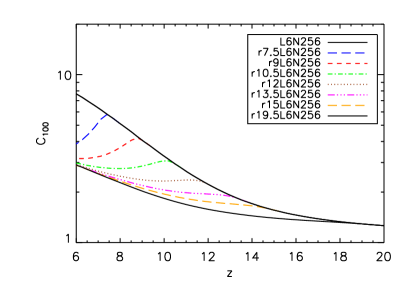
The evolution of and is shown, respectively, in the left-hand and right-hand panels of Fig. 5 for the simulations r9L6N256 (i.e. reheating at redshift ) and L6N256 (i.e. no reheating). In the same figure we also include the evolution of and obtained from the set of simulations r[]L6N256, where and . While the simulations are identical for , the ionising background strongly affects the evolution of and for . Whereas in L6N256 the clumping factors reach and at , they only reach and in r9L6N256, which are smaller than in L6N256 by roughly a factor of three. Note that because the clumping factor obtained from simulation L6N256 is likely to be not fully converged with respect to resolution (see footnote 4), we may even have underestimated the magnitude of the decrease in the clumping factor due to photo-heating.
Interestingly, the clumping factor at is insensitive to the redshift at which the UV background is turned on, as long as . This is because, after an initial transitory phase, the evolution of the clumping factor obtained for reheating at redshift approaches that obtained for reheating at . Note that the difference between the clumping factors obtained from r[]L6N256 and r19.5L6N256 becomes smaller with increasing reheating redshift . In particular, the clumping factors obtained for reheating at are nearly identical to those obtained for reheating at at all redshifts. The evolution of the clumping factors obtained from r19.5L6N256 can therefore be considered to reflect the evolution of the clumping factor in the limit of reheating at very high redshift, .
In Appendix A.1 we provide fits to the evolution of the clumping factor over the redshift range for a range of (over-)density thresholds and reheating redshifts. These fits (Eqs. 7 and 8) may be employed in (semi-)analytic models of the epoch of reionisation. Many such models assume that reionisation heating provides only a negative feedback on the reionisation process, reducing the star formation rate due to the photo-evaporation of gas in low-mass halos. However, as we have shown here, photo-heating decreases the clumping factor, and hence the average recombination rate. Since this makes it easier to keep the IGM ionised, reionisation heating also provides a positive feedback on the process of reionisation. Although the relative importance of both can only be assessed using larger hydrodynamical simulations of higher resolution555At , the cosmic SFR density (the stellar mass) in r9L6N256 is smaller than that in L6N256 by a factor (). In our simulations, photo-heating thus decreases the SFR density less strongly than it reduces the clumping factor, which would imply that the positive feedback is more important. The SFR densities in both r9L6N256 and L6N256 are, however, not fully converged with respect to resolution and box size. A final assessment as to whether the negative or the positive feedback is stronger must therefore be deferred to future studies using simulations with higher resolution and larger box sizes., it is clear that models that do not account for this positive feedback will underestimate the efficiency with which star-forming galaxies are able to reionise the IGM.
3.2.3 Dependence on the reheating temperature

In this section we investigate the robustness of our results with respect to our simplified treatment of photo-ionisation heating.
We have considered photo-heating by a uniform ionising background in the optically thin limit. In reality, the reionisation process is likely to be driven by inhomogeneously distributed sources in an initially optically thick medium. The temperature to which the IGM is reheated will then not only depend on the spectrum of the ionising sources, but also on the amount of spectral hardening due to the preferential absorption of the less energetic ionising photons (e.g. Abel & Haehnelt, 1999; Bolton, Meiksin, & White, 2004). Moreover, the speed at which a particular patch of the IGM is reionised determines the duration during which its gas can cool efficiently, as the cooling is dominated by inelastic collisions between free electrons and neutral atoms. Different reionisation histories may therefore result in different IGM temperatures (e.g. Miralda-Escudé & Rees, 1994; Theuns et al., 2002; Hui & Haiman, 2003; Tittley & Meiksin, 2007).
To bracket possible scenarios, we have performed two additional simulations in which we varied the amount of energy transferred to the baryons during the photo-ionisation process, r9L6N256highT and r9L6N256lowT. Whereas in the former we employ an additional energy input that is ten times larger than our default value (), in the latter no additional energy is injected (). We show in Fig. 6 that the evolution of and obtained from these two simulations is very similar to that obtained from our default run, r9L6N256. The dependence on the reheating temperature is weak, because halos with virial temperatures are already efficiently destroyed for . A further increase in the reheating temperature mostly affects the fraction of mass in halos with larger virial temperatures, which is small. Moreover, Fig. 1 shows that the gas in the simulations r9L6N256highT and r9L6N256lowT quickly loses memory of its thermal state at some higher redshift, which is another reason for the similarity in the results obtained using different values for the reheating energy .
3.2.4 Effect of kinetic supernova feedback and dependence on cosmological parameters
The inclusion of kinetic feedback from supernovae in r9L6N256winds only weakly affects the evolution of the clumping factors. At redshift , and are slightly larger (by factors and , resp.) in r9L6N256winds than in our default simulation, r9L6N256, which does not include kinetic feedback. The reason for the slight increase in the clumping factors is that winds move gas from regions of densities larger than the critical density for the onset of star formation to regions of lower density that contribute to the calculation of the clumping factors. We note that the inclusion of kinetic feedback does, on the other hand, strongly affect the cosmic SFR. At , the cosmic SFR (the stellar mass) is lower in the simulation that includes kinetic feedback (r9L6N256winds) than in our default simulation (r9L6N256) by a factor of ().
Finally, we quote the clumping factors obtained from the simulations and , which employed cosmological parameters consistent with the WMAP 3-year and 1-year observations, respectively. We find that at redshift , the clumping factors and are larger in than in by factors of and , respectively. They are smaller in than in by factors of and . In summary, with respect to , the clumping factors are larger in and smaller in , as expected from the corresponding values of , which set the average absolute amplitude of the overdensity fluctuations.
3.2.5 Comparison with previous work
We conclude our study of the clumping factor with a brief comparison with previous work, shown in Fig. 7. The evolution of the clumping factors in our simulations L6N256 and r9L6N256 is shown by the black solid and red dashed curves, respectively, where the upper (lower) set of curves shows (). We compare it to the evolution of the clumping factor presented in Miralda-Escudé, Haehnelt, & Rees (2000) and Iliev et al. (2007), which are amongst the most commonly employed works on the clumping factor and make use of sufficiently different techniques to bracket a range of possible cases. We caution the reader that such a direct comparison is difficult and of limited validity because of the very different assumptions underlying the individual works.
Miralda-Escudé, Haehnelt, & Rees (2000) used the L10 hydrodynamical simulation presented in Miralda-Escudé et al. (1996) to obtain the PDF of the gas density at redshifts and . The simulation was performed using the TVD hydrodynamical scheme described in Ryu et al. (1993). It used a box of size , dark matter particles and gas cells and employed cosmological parameters consistent with the first-year COBE normalization. The simulation included photo-heating from a uniform UV background, computed from the emissivities of the sources in the simulation. We refer the reader to Miralda-Escudé et al. (1996) for more details. Miralda-Escudé, Haehnelt, & Rees (2000) also provided fits to the gas density PDF and presented a prescription for its extrapolation to redshifts . We employed this prescription to compute the clumping factor evolution using Eq. 2.
The evolution of the clumping factors and obtained from the Miralda-Escudé, Haehnelt, & Rees (2000) PDFs is shown, respectively, by the top and bottom blue long-dashed curves. For redshifts , it closely agrees with the corresponding evolution obtained from our simulation r9L6N256. For lower redshifts the agreement is less good, although the clumping factors never differ by more than factors . The differences between their and our results are probably due to the use of different hydrodynamical schemes, different cosmological parameters and different prescriptions for the UV background. The change in the slope of the clumping factor growth that can be seen at redhift is likely due to the inclusion of photo-heating. That this change is much less pronounced than in our simulation r9L6N256 may be due to a more gradual build-up of the ionising background in the Miralda-Escudé, Haehnelt, & Rees (2000) simulation.
Iliev et al. (2007) computed the clumping factor from a pure dark matter simulation. The simulation employed a box of size and particles and was initialized with cosmological parameters consistent with the WMAP 3-year results666We note that they also computed the clumping factor in a similar simulation that was initialized with cosmological parameters consistent with the WMAP 1-year results.. The clumping factor was computed by averaging over all dark matter densities, and hence only implicitly makes use of an overdensity threshold (determined by the maximum overdensity present in their simulation). We refer the reader to the original description in Iliev et al. (2007) for more details.
Iliev et al. (2007) provided the following fit to the evolution of the clumping factor in their simulation,
| (6) |
which is valid over the range . It is shown by the green dotted curve. Since it was derived from a pure dark matter simulation, Eq. 6 does not capture the hydrodynamical response due to reionisation heating. It should therefore be compared to the evolution of the clumping factor obtained from our simulation L6N256, which did not include photo-heating. A direct interpretation of such a comparison is, however, difficult, because Eq. 6 does not explicitly refer to an overdensity threshold.
Our comparison clearly illustrates that there is a considerable spread in the clumping factor values quoted in the literature. The interpretation of many studies is complicated by the fact that they do not refer to a density threshold, which means that the result is determined by the numerical resolution of their simulations.

4 Discussion
Several observational studies have claimed that the star formation rate (SFR) density at redshift is smaller than the critical SFR density required to keep the intergalactic medium (IGM) ionised. In the absence of a large population of unseen sources of ionising radiation, this discrepancy between the two SFR densities would be in direct conflict with the high degree of ionisation inferred from the non-detection of a Gunn-Peterson trough in the majority of the line-of-sight spectra towards quasars.
The critical SFR density is inversely proportional to the spatially averaged fraction of ionising photons that escape into the IGM per unit time and proportional to the clumping factor , a measure for the average recombination rate in the IGM. One may therefore ask whether the discrepancy between the observed and critical SFR densities could be resolved by changing the assumptions about the values of either of these two quantities. In this work we considered the hypothesis that most observational studies overestimate the critical SFR density because they employ a clumping factor that is too large.
We re-evaluated the clumping factor, analysing the gas density distributions in a set of cosmological smoothed particle hydrodynamics simulations that include radiative cooling and photo-ionisation by a uniform UV background in the optically thin limit. The clumping factor of the IGM depends critically on the definition of which gas is considered to be part of the IGM. Following Miralda-Escudé, Haehnelt, & Rees (2000), we assumed that all gas with densities below a threshold density constitutes the IGM and computed the clumping factor as a function of this threshold density. In addition, we introduced two physically well-motivated definitions, , the clumping factor of gas with overdensities and , the clumping factor of gas with proper densities below , our threshold density for the onset of star formation.
By comparing simulations that include photo-ionisation by a uniform UV background to one that does not, we showed that photo-heating strongly influences the evolution of the clumping factor of the IGM. Photo-ionisation heating expels the gas from within halos of virial temperatures and prevents its further accretion by raising the Jeans mass in the IGM. By suppressing the formation of stars in these low-mass halos, photo-heating from reionisation decreases the rate at which ionising photons are emitted into the IGM and is therefore correctly said to exert a negative feedback on the reionisation process. The fact that photo-heating also leads to a decrease in the clumping factor and hence provides a strong positive feedback by making it easier to keep the IGM ionised, is however often overlooked (but see, e.g., Haiman, Abel, & Madau, 2001; Oh & Haiman, 2003; Kuhlen & Madau, 2005; Wise & Abel, 2005; Furlanetto, Oh, & Briggs, 2006; Ciardi & Salvaterra, 2007).
At redshift , we find that and and that these values are insensitive to the redshift at which the UV background is turned on, as long as . These values for and are at least three times smaller than they would be in the absence of photo-heating. We demonstrated that our default simulation is converged at with respect to the employed resolution. It is converged with respect to changes in the box size for threshold overdensities . In Appendix A we provide fits to the evolution of the clumping factor for various (over-)density thresholds and reheating redshifts. There we also compare the probability density function (PDF) of the gas densities at obtained from our default simulation to the widely used fit provided by Miralda-Escudé, Haehnelt, & Rees (2000). We update their fitting parameters to best fit the PDF from our default simulation. Finally, we compared our results for the clumping factor of the IGM to those obtained in previous works.
Since even our most conservative estimate for the clumping factor () is five times smaller than the clumping factor that is usually employed to determine the capacity of star-forming galaxies to keep the IGM ionised, our results may have important implications for the understanding of the reionisation process. Setting in Eq. 1, the critical SFR density becomes . This is smaller than recent observational estimates for the SFR density at , (integrated to the observed faint-end limit and dust-corrected; Bouwens et al., 2007), provided that .
Our study thus suggests that the observed population of star-forming galaxies may be capable of keeping the IGM ionised, relaxing the tension between observationally inferred and critical SFR density in view of the observation of a highly ionised IGM at redshifts . We note that at , the SFR density is estimated to be (integrated to the observed faint-end limit and dust-corrected; Bouwens et al., 2008), whereas the critical SFR density is (using ). The observed population of star-forming galaxies at is therefore not able to keep the IGM ionised. If the Universe were ionised by this redshift, then the sources that were responsible remain to be discovered.
We caution the reader that the comparison of the critical and observed SFRs is subject to considerable uncertainty. First, the SFR inferred from UV galaxy counts probably underestimates the true SFR, because these counts miss UV galaxies fainter than the faint-end limit implied by their sensitivities. These galaxies may, however, significantly contribute to the UV luminosity density if the faint-end slope of the UV luminosity function is sufficiently steep. Complementary estimates of the high-redshift star formation rate based on measurements of the high-redshift () gamma ray burst rate (Yüksel et al., 2008) and measurements of the Lyman-alpha forest opacity at redshifts (Faucher-Giguère et al., 2008) indeed suggest SFRs that exceed those inferred from UV galaxy counts by factors of a few.
Second, the expression for the critical SFR (Eq. 1) is only approximate. As already mentioned in the introduction, this expression is based on equating the rate at which ionising photons escape into the intergalactic medium to the rate at which the intergalactic gas is recombining, both averaged in space. It neglects effects like the cosmological redshifting of photons below the ionisation threshold energy and evolution of the ionising sources during a recombination time. Because the cross-section for absorption of ionising photons by neutral hydrogen decreases with increasing photon frequency , these effects may become important for photons whose mean free path is comparable to the cosmic horizon. Our limit on the escape fraction required to keep the Universe at ionised may therefore only be accurate within a factor of a few.
Our simulations demonstrate that radiation-hydrodynamical feedback due to photo-ionisation heating plays a key role in shaping the properties of the IGM at redshifts . We have studied the impact of photo-ionisation heating on the clumping factor of the IGM assuming a uniform ionising UV background in the optically thin limit. In reality the reionisation process will, however, be more complex. We have demonstrated the robustness of our conclusions with respect to uncertainties in the temperature of the IGM resulting from our simplified treatment of the reionisation heating, but there are other factors whose importance is more difficult to assess.
Our use of the optically thin approximation neglects self-shielding, a radiative transfer effect due to which halos that would otherwise be completely photo-evaporated could keep some of their gas (e.g., Kitayama & Ikeuchi, 2000; Susa & Umemura, 2004; Dijkstra et al., 2004). Since the self-shielded gas remains neutral, it should be excluded when computing the clumping factor. Self-shielding becomes important for , which for self-gravitating gas clouds corresponds to densities (Schaye, 2001) , where is the HI photo-ionisation rate. In our discussion of the critical SFR we have conservatively adopted the clumping factor , defined using a threshold density , which is an order of magnitude larger than the critical density for self-shielding.
Self-shielding might affect our results because it may lower the speed with which halos are photo-evaporated. The work by Iliev, Shapiro, & Raga (2005b) (in combination with the work by Shapiro, Iliev, & Raga, 2004) shows that photo-evaporation times obtained in simulations that employ an optically thin UV background may differ by factors of a few from those obtained in detailed radiation-hydrodynamical simulations. However, if any halos would resist photo-evaporation much longer than predicted by our approximate treatment of photo-heating, then the clumping factor of the IGM would be even lower, because self-shielding locks the gas that would otherwise contribute to the clumping factor of the IGM in its neutral state.
If absorption by optically thick (self-shielded) clouds becomes important, then the mean free path of ionising photons may be set by the mean distance between these clouds (Zuo & Phinney, 1993) instead of by the opacity of the diffuse IGM. In this case it might be appropriate to supplement the Miralda-Escudé, Haehnelt, & Rees, 2000 model for the computation of the average recombination rate with a more direct account for these clouds as discrete photon sinks (e.g., Iliev, Scannapieco, & Shapiro, 2005a; Ciardi et al., 2006). The effect of absorption by optically thick clouds is, however, largely degenerate with the ionising efficiency of the population of star-forming galaxies, as explained in Iliev et al. (2007). If, on the one hand, these clouds are ionising sources themselves, then their contribution to the average recombination rate can be described by their escape fractions. If, on the other hand, these clouds do not host ionising sources, then their contribution to the average recombination can be accommodated by changes in the ionising efficiency of star-forming galaxies because of their biased clustering around these galaxies. The effects of optically thick clouds can therefore approximately be accounted for by adjusting the properties of the ionising sources.
Self-shielding is only one example of the physical effects that we are ignoring. The inclusion of metals and molecules, for instance, would increase the ability of the gas to cool, which may lead to an increase in the clumping factor (e.g. Maio et al., 2007). In the presence of photo-heating and for the threshold densities we employ to compute the clumping factors we however expect this effect to be very small. A more efficient cooling due to metals and molecules may also enable star formation and associated kinetic feedback in low-mass haloes with virial temperatures . Both are processes that we have ignored but which are likely to affect the clumping factor evolution (e.g. Wise & Abel, 2008).
The evolution of the clumping factor will also depend on the morphology of the reionisation transition. Our treatment implicitly assumed that all gas with overdensities smaller than a threshold overdensity is uniformly ionised, while all gas with larger overdensities is fully neutral. This picture probably only applies to the late stages of reionisation, when individual ionised regions start to overlap and the only neutral gas that remains to be ionised is locked up in regions of high gas overdensities. Before overlap, other reionisation models may be more useful for the description of the clumping factor evolution. For example, Furlanetto & Oh (2005) point out that if the large-scale dense regions are ionised first, the clumping factor may be somewhat larger than one would otherwise expect, because the photons are initially confined to these dense regions. Moreover, Furlanetto, Haiman, & Oh (2008) show that in fossil ionised regions, that is, regions in which the gas freely recombines, the clumping factor will generally be smaller than for regions in photo-ionisation equilibrium, because the densest gas which contributes most to the clumping factor becomes neutral first.
The clumping factor is an important ingredient of (semi-)analytic treatments of reionisation. It would therefore be highly desirable to evaluate the approximations we have employed in our simplified treatment of the photo-heating process using large high-resolution radiation-hydrodynamical simulations of reionisation that include cooling by metals and molecules and feedback from star formation. At the moment such simulations are, however, not yet feasible.
In fact, current state-of-the-art radiative transfer simulations typically make use of clumping factors in their “sub-grid” modules because they lack the resolution to resolve the clumpiness of the gas directly. In addition, they typically do not include the effect of photo-heating. In fact, many radiative transfer simulations ignore hydrodynamics altogether and assume the gas to trace the dark matter.
With this work we hope to have presented a conservative assessment of the clumping factor of the post-reionisation IGM that may provide a useful input to future (semi-)analytic models and simulations of the reionisation process.
Acknowledgments
We thank Rychard Bouwens, Steven Furlanetto and Jordi Miralda-Escudé for valuable communications. We thank the anonymous referee for his/her constructive contribution that greatly improved the discussion of our results. We are grateful to Claudio Dalla Vecchia for help with running the simulations, Rob Wiersma for useful discussions on the cooling tables and Marcel Haas and Freeke van de Voort for a thorough reading of the draft. The simulations presented here were run on the Cosmology Machine at the Institute for Computational Cosmology in Durham as part of the Virgo Consortium research programme and on Stella, the LOFAR BlueGene/L system in Groningen. This work was supported by Marie Curie Excellence Grant MEXT-CT-2004-014112.
References
- Abel & Haehnelt (1999) Abel T., Haehnelt M. G., 1999, ApJ, 520, L13
- Barkana & Loeb (1999) Barkana R., Loeb A., 1999, ApJ, 523, 54
- Barkana & Loeb (2001) Barkana R., Loeb A., 2001, PhR, 349, 125
- Barkana & Loeb (2004) Barkana R., Loeb A., 2004, ApJ, 609, 474
- Benson et al. (2001) Benson A. J., Nusser A., Sugiyama N., Lacey C. G., 2001, MNRAS, 320, 153
- Bolton, Meiksin, & White (2004) Bolton J., Meiksin A., White M., 2004, MNRAS, 348, L43
- Bolton & Haehnelt (2007) Bolton J. S., Haehnelt M. G., 2007, MNRAS, 382, 325
- Bouwens et al. (2004) Bouwens R. J., et al., 2004, ApJ, 606, L25
- Bouwens et al. (2006) Bouwens R. J., Illingworth G. D., Blakeslee J. P., Franx M., 2006, ApJ, 653, 53
- Bouwens et al. (2007) Bouwens R. J., Illingworth G. D., Franx M., Ford H., 2007, ApJ, 670, 928
- Bouwens et al. (2008) Bouwens R. J., Illingworth G. D., Franx M., Ford H., 2008, preprint (arXiv:0803.0548)
- Bruzual & Charlot (2003) Bruzual G., Charlot S., 2003, MNRAS, 344, 1000
- Bunker et al. (2004) Bunker A. J., Stanway E. R., Ellis R. S., McMahon R. G., 2004, MNRAS, 355, 374
- Chabrier (2003) Chabrier G., 2003, PASP, 115, 763
- Chiu, Fan, & Ostriker (2003) Chiu W. A., Fan X., Ostriker J. P., 2003, ApJ, 599, 759
- Ciardi et al. (2006) Ciardi B., Scannapieco E., Stoehr F., Ferrara A., Iliev I. T., Shapiro P. R., 2006, MNRAS, 366, 689
- Ciardi & Salvaterra (2007) Ciardi B., Salvaterra R., 2007, MNRAS, 381, 1137
- Collin-Souffrin (1991) Collin-Souffrin S., 1991, A&A, 243, 5
- Chuzhoy, Kuhlen, & Shapiro (2007) Chuzhoy L., Kuhlen M., Shapiro P. R., 2007, ApJ, 665, L85
- Crain et al. (2007) Crain R. A., Eke V. R., Frenk C. S., Jenkins A., McCarthy I. G., Navarro J. F., Pearce F. R., 2007, MNRAS, 377, 41
- Dalla Vecchia & Schaye (2008) Dalla Vecchia C., Schaye J., 2008, MNRAS, 387, 1431
- Dijkstra et al. (2004) Dijkstra M., Haiman Z., Rees M. J., Weinberg D. H., 2004, ApJ, 601, 666
- Efstathiou (1992) Efstathiou G., 1992, MNRAS, 256, 43P
- Fan, Carilli,& Keating (2006) Fan X., Carilli C. L., Keating B., 2006, ARA&A, 44, 415
- Faucher-Giguère et al. (2008) Faucher-Giguère C.-A., Lidz A., Hernquist L., Zaldarriaga M., 2008, ApJ, 688, 85
- Ferland et al. (1998) Ferland G. J., Korista K. T., Verner D. A., Ferguson J. W., Kingdon J. B., Verner E. M., 1998, PASP, 110, 761
- Furlanetto & Oh (2005) Furlanetto S. R., Oh S. P., 2005, MNRAS, 363, 1031
- Furlanetto, Oh, & Briggs (2006) Furlanetto S. R., Oh S. P., Briggs F. H., 2006, PhR, 433, 181
- Furlanetto, Haiman, & Oh (2008) Furlanetto S. R., Haiman Z., Oh S. P., 2008, ApJ, 686, 25
- Glover & Brand (2003) Glover S. C. O., Brand P. W. J. L., 2003, MNRAS, 340, 210
- Glover (2007) Glover S. C. O., 2007, MNRAS, 379, 1352
- Gnedin & Ostriker (1997) Gnedin N. Y., Ostriker J. P., 1997, ApJ, 486, 581
- Gnedin & Hui (1998) Gnedin N. Y., Hui L., 1998, MNRAS, 296, 44
- Gnedin (2000a) Gnedin N. Y., 2000a, ApJ, 535, 530
- Gnedin (2000b) Gnedin N. Y., 2000b, ApJ, 542, 535
- Gnedin, Kravtsov, & Chen (2008a) Gnedin N. Y., Kravtsov A. V., Chen H.-W., 2008, ApJ, 672, 765
- Gnedin (2008b) Gnedin N. Y., 2008, ApJ, 673, L1
- Haardt & Madau (2001) Haardt F., Madau P., 2001, in the proceedings of XXXVI Rencontres de Moriond, preprint (astroph/0106018)
- Haiman, Rees, & Loeb (1997) Haiman Z., Rees M. J., Loeb A., 1997, ApJ, 476, 458
- Haiman, Abel, & Madau (2001) Haiman Z., Abel T., Madau P., 2001, ApJ, 551, 599
- Hoeft et al. (2006) Hoeft M., Yepes G., Gottlöber S., Springel V., 2006, MNRAS, 371, 401
- Hui & Haiman (2003) Hui L., Haiman Z., 2003, ApJ, 596, 9
- Iliev, Scannapieco, & Shapiro (2005a) Iliev I. T., Scannapieco E., Shapiro P. R., 2005a, ApJ, 624, 491
- Iliev, Shapiro, & Raga (2005b) Iliev I. T., Shapiro P. R., Raga A. C., 2005b, MNRAS, 361, 405
- Iliev et al. (2007) Iliev I. T., Mellema G., Shapiro P. R., Pen U.-L., 2007, MNRAS, 376, 534
- Inoue, Iwata, & Deharveng (2006) Inoue A. K., Iwata I., Deharveng J.-M., 2006, MNRAS, 371, L1
- Kennicutt (1998) Kennicutt R. C., Jr., 1998, ApJ, 498, 541
- Kitayama & Ikeuchi (2000) Kitayama T., Ikeuchi S., 2000, ApJ, 529, 615
- Kohler, Gnedin, & Hamilton (2007) Kohler K., Gnedin N. Y., Hamilton A. J. S., 2007, ApJ, 657, 15
- Komatsu et al. (2008) Komatsu E., et al., 2008, preprint (arXiv:0803.0547)
- Kuhlen & Madau (2005) Kuhlen M., Madau P., 2005, MNRAS, 363, 1069
- Lacey & Cole (1994) Lacey C., Cole S., 1994, MNRAS, 271, 676
- Lehnert & Bremer (2003) Lehnert M. D., Bremer M., 2003, ApJ, 593, 630
- Machacek, Bryan, & Abel (2003) Machacek M. E., Bryan G. L., Abel T., 2003, MNRAS, 338, 273
- Madau & Efstathiou (1999) Madau P., Efstathiou G., 1999, ApJ, 517, L9
- Madau, Haardt, & Rees (1999) Madau P., Haardt F., Rees M. J., 1999, ApJ, 514, 648
- Madau (2000) Madau P., 2000, RSPTA, 358, 2021
- Madau et al. (2004) Madau P., Rees M. J., Volonteri M., Haardt F., Oh S. P., 2004, ApJ, 604, 484
- Maio et al. (2007) Maio U., Dolag K., Ciardi B., Tornatore L., 2007, MNRAS, 379, 963
- Malhotra et al. (2005) Malhotra S., et al., 2005, ApJ, 626, 666
- Mannucci et al. (2007) Mannucci F., Buttery H., Maiolino R., Marconi A., Pozzetti L., 2007, A&A, 461, 423
- Mesinger & Dijkstra (2008) Mesinger A., Dijkstra M., 2008, preprint (arXiv:0806.3090)
- Miralda-Escudé & Rees (1994) Miralda-Escudé J., Rees M. J., 1994, MNRAS, 266, 343
- Miralda-Escudé et al. (1996) Miralda-Escudé J., Cen R., Ostriker J. P., Rauch M., 1996, ApJ, 471, 582
- Miralda-Escudé, Haehnelt, & Rees (2000) Miralda-Escudé J., Haehnelt M., Rees M. J., 2000, ApJ, 530, 1
- Miralda-Escudé (2003) Miralda-Escudé J., 2003, ApJ, 597, 66
- Navarro & Steinmetz (1997) Navarro J. F., Steinmetz M., 1997, ApJ, 478, 13
- Oesch et al. (2008) Oesch P. A., et al., 2008, preprint (arXiv:0804.4874)
- Oh (2001) Oh S. P., 2001, ApJ, 553, 499
- Oh & Haiman (2003) Oh S. P., Haiman Z., 2003, MNRAS, 346, 456
- Okamoto, Gao, & Theuns (2008) Okamoto T., Gao L., Theuns T., 2008, preprint (arXiv:0806.0378)
- Padmanabhan (1993) Padmanabhan T., Structure Formation in the Universe, Cambridge University Press (1993)
- Panagia et al. (2005) Panagia N., Fall S. M., Mobasher B., Dickinson M., Ferguson H. C., Giavalisco M., Stern D., Wiklind T., 2005, ApJ, 633, L1
- Pawlik & Schaye (2008) Pawlik A. H., Schaye J., 2008, submitted, preprint (arXiv:0812.2913)
- Razoumov & Sommer-Larsen (2006) Razoumov A. O., Sommer-Larsen J., 2006, ApJ, 651, L89
- Ricotti & Ostriker (2004) Ricotti M., Ostriker J. P., 2004, MNRAS, 352, 547
- Ryu et al. (1993) Ryu D., Ostriker J. P., Kang H., Cen R., 1993, ApJ, 414, 1
- Sawicki & Thompson (2006) Sawicki M., Thompson D., 2006, ApJ, 648, 299
- Schaye (2001) Schaye J., 2001, ApJ, 559, 507
- Schaye (2004) Schaye J., 2004, ApJ, 609, 667
- Schaye & Dalla Vecchia (2008) Schaye J., Dalla Vecchia C., 2008, MNRAS, 383, 1210
- Seljak & Zaldarriaga (1996) Seljak U., Zaldarriaga M., 1996, ApJ, 469, 437
- Shapiro, Giroux, & Babul (1994) Shapiro P. R., Giroux M. L., Babul A., 1994, ApJ, 427, 25
- Shapiro, Iliev, & Raga (2004) Shapiro P. R., Iliev I. T., Raga A. C., 2004, MNRAS, 348, 753
- Shapley et al. (2003) Shapley A. E., Steidel C. C., Pettini M., Adelberger K. L., 2003, ApJ, 588, 65
- Spergel et al. (2007) Spergel D. N., et al., 2007, ApJS, 170, 377
- Spergel et al. (2003) Spergel D. N., et al., 2003, ApJS, 148, 175
- Springel & Hernquist (2003) Springel V., Hernquist L., 2003, MNRAS, 339, 289
- Springel (2005) Springel V., 2005, MNRAS, 364, 1105
- Srbinovsky & Wyithe (2007) Srbinovsky J. A., Wyithe J. S. B., 2007, MNRAS, 374, 627
- Stanway, Bunker, & McMahon (2003) Stanway E. R., Bunker A. J., McMahon R. G., 2003, MNRAS, 342, 439
- Stiavelli, Fall, & Panagia (2004) Stiavelli M., Fall S. M., Panagia N., 2004, ApJ, 610, L1
- Susa & Umemura (2004) Susa H., Umemura M., 2004, ApJ, 600, 1
- Theuns et al. (2002) Theuns T., Schaye J., Zaroubi S., Kim T.-S., Tzanavaris P., Carswell B., 2002, ApJ, 567, L103
- Thoul & Weinberg (1996) Thoul A. A., Weinberg D. H., 1996, ApJ, 465, 608
- Tittley & Meiksin (2007) Tittley E. R., Meiksin A., 2007, MNRAS, 380, 1369
- Valageas & Silk (1999) Valageas P., Silk J., 1999, A&A, 347, 1
- Veilleux, Cecil, & Bland-Hawthorn (2005) Veilleux S., Cecil G., Bland-Hawthorn J., 2005, ARA&A, 43, 769
- Venkatesan, Giroux, & Shull (2001) Venkatesan A., Giroux M. L., Shull J. M., 2001, ApJ, 563, 1
- Wiersma, Schaye & Smith (2008) Wiersma R. P. C., Schaye J., Smith B. D., 2008, MNRAS, in press, preprint (arXiv:0807.3748)
- Wise & Abel (2005) Wise J. H., Abel T., 2005, ApJ, 629, 615
- Wise & Abel (2008) Wise J. H., Abel T., 2008, ApJ, 684, 1
- Yan & Windhorst (2004) Yan H., Windhorst R. A., 2004, ApJ, 600, L1
- Yüksel et al. (2008) Yüksel H., Kistler M. D., Beacom J. F., Hopkins A. M., 2008, ApJ, 683, L5
- Zuo & Phinney (1993) Zuo L., Phinney E. S., 1993, ApJ, 418, 28
Appendix A Fitting formulas
Here we provide fits to the evolution of the clumping factor for a range of overdensity thresholds and all reheating redshifts considered for use with (semi-)analytical models of reionisation. We also compare the probability density function of the gas densities at redshift obtained from our default simulation to the fit provided by Miralda-Escudé, Haehnelt, & Rees (2000).
A.1 Clumping factor
In this section we fit the evolution of the clumping factors and over the redshift range , based on the data presented in Fig. 5. In addition, we give fits to the evolution of the clumping factors and and , where and and similar for and . We first give fits to the evolution of the clumping factors for the simulations L6N256 and r19.5L6N256, i.e. the simulations without reheating and with reheating at the highest redshift we considered. These fits are then used to obtain fits to the evolution of the clumping factors for reheating at the intermediate redshifts and by interpolation.
We approximate the evolution of the clumping factors for the simulations L6N256 and r19.5L6N256 by
| (7) |
where is either or and similar for , , , . The values for the parameters , , , are listed in Tables 2 and 3. The fit (Eq. 7) is accurate to within . We emphasize that it is only strictly valid over the fitting range . For and , i.e. for the clumping factors that are defined using an overdensity threshold, we forced, however, the fits to approach the correct high- limit, i.e. , by fixing during the fitting procedure. Note that the threshold densities used with and correspond to threshold overdensities for redshifts and , respectively and that and become identical to for redshifts and , respectively.
The values of for reheating at redshifts and (hereafter ) are fitted by interpolating between the fits (Eq. 7) to the evolution of the clumping factors obtained from L6N256 (hereafter ) and r19.5L6N256 (hereafter ). That is, we write
| (8) |
where
| (9) |
and erf is the error function,
| (10) |
The constants and are listed in Tables 4 and 5. Eq. 8 fits the data to within .
| L6N256 | r19.5L6N256 | ||
|---|---|---|---|
| L6N256 | r19.5L6N256 | ||
|---|---|---|---|
A.2 Probability density function
Miralda-Escudé, Haehnelt, & Rees (2000) provided a convenient four-parameter fit to the volume-weighted probability density function (PDF) of the gas density at redshifts and obtained from the L10 hydrodynamical simulation described in Miralda-Escudé et al. (1996). In addition, they provided a prescription for extrapolating this fit to higher redshifts. Here we compare the volume-weighted PDF obtained from our default simulation (r9L6N256) at to their fit. Because we find that their set of fitting parameters provides a somewhat poor description of this PDF, we also provide an updated set of parameters that yields a fit which more accurately describes the one-point distribution of gas densities at in our default simulation.
In Fig. 8 we show the volume-weighted PDF of the gas density per unit . We have investigated the convergence of this PDF with respect to the resolution and the size of the simulation box, using the same set of simulations that we employed to study the convergence of the clumping factor in Section 3.2.1. We find that the PDF is converged with respect to changes in the resolution. It is converged with respect to changes in the size of the simulation box for overdensities . For larger overdensities, the values of the PDF obtained from our default simulation may not yet be fully converged. We note that at the PDFs obtained from the simulations r[]L6N256z that employ a reheating redshift are almost undistinguishable from that obtained from our default simulation.
We compare the PDF to the fit given by Miralda-Escudé, Haehnelt, & Rees (2000),
| (11) |
using their values for the parameters777Note that the value for A given in Miralda-Escudé, Haehnelt, & Rees (2000) is too large by a factor of . and . As can be seen from Fig. 8, for overdensities the PDF obtained from our default simulation is significantly steeper than predicted by the fit. Using the simulations r9L6N256W3 and r9L6N256W1, we verified that the steepness of the slope of the PDF over this range of overdensities is sensitive to the cosmological parameters employed. Note that the PDF does also not asymptote to , as predicted by Eq. 11. For overdensities larger than the overdensity for the onset of star formation, the PDF is instead governed by the effective equation of state characteristic for the multi-phase star-forming gas.
We fitted Eq. 11 to our PDF over the range , constraining the parameters and by the requirement that the total integral over the volume- and mass-weighted PDF must be normalized to unity. This yields values and . Note that the fit based on these parameter values still does not provide a good description of the PDF for overdensities .
