119–126
Evolution of stellar disk truncations since z=1
Abstract
We present our recent results on the cosmic evolution of the outskirst of disk galaxies. In particular we focus on disk–like galaxies with stellar disk truncations. Using UDF, GOODS and SDSS data we show how the position of the break (i.e. a direct estimator of the size of the stellar disk) evolves with time since z1. Our findings agree with an evolution on the radial position of the break by a factor of 1.30.1 in the last 8 Gyr for galaxies with similar stellar masses. We also present radial color gradients and how they evolve with time. At all redshift we find a radial inside-out bluing reaching a minimum at the position of the break radius, this minimum is followed by a reddening outwards. Our results constraint several galaxy disk formation models and favour a scenario where stars are formed inside the break radius and are relocated in the outskirts of galaxies through secular processes.
keywords:
galaxies: evolution - galaxies: high-redshift - galaxies: structure - galaxies: formation - galaxies: spiral - galaxies: photometry1 Introduction
Early studies of the disks of spiral galaxies ([Patterson (1940), Patterson 1940], [de Vaucouleurs (1959), de Vaucouleurs 1959], [Freeman (1970), Freeman 1970]) showed that this component generally follows an exponential radial surface-brightness profile, with a certain scale length, usually taken as the characteristic size of the disk. [Freeman (1970), Freeman (1970)] pointed out, though, that not all disks follow this simple exponential law. In fact, a repeatedly reported feature of disks for a representative fraction of the spiral galaxies is that of a truncation of the stellar population at large radii, typically 2-4 exponential scale lengths (see e.g. the review by [Pohlen et al. (2004), Pohlen et al. 2004]).
Several possible break-forming mechanisms have been investigated to explain the truncations. There have been ideas based on maximum angular momentum distribution: [van der Kruit (1987), van der Kruit (1987)] proposed that angular momentum conservation in a collapsing, uniformly rotating cloud naturally gives rise to disk breaks at roughly 4.5 scale radii. [van den Bosch (2001), van den Bosch (2001)] suggested that the breaks are due to angular momentum cut-offs of the cooled gas. On the other hand, breaks have also been attributed to a threshold for star formation (SF), due to changes in the gas density [Kennicutt (1989), Kennicutt (1989)], or to an absence of equilibrium in the cool Interstellar Medium phase ([Elmegreen & Parravano (1994), Elmegreen & Parravano 1994], [Schaye (2004), Schaye 2004]). Magnetic fields have been also considered (Battaner et al. 2002) as responsible of the truncations. More recent models using collisionless N-body simulations, such as that by [Debattista et al. (2006), Debattista et al. (2006)], demonstrated that the redistribution of angular momentum by spirals during bar formation also produces realistic breaks. In a further elaboration of this idea, [Roškar et al. (2008), Roškar et al. (2008)] have performed high resolution simulations of the formation of a galaxy embedded in a dark matter halo. In these models, breaks are the result of the interplay between a radial star formation cut-off and redistribution of stellar mass by secular processes. A natural prediction of these models is that the stellar populations present an age minimum in the break position. This prediction could be probed by exploring the color profiles of the galaxies.
Furthermore, addressing the question of how the radial truncation evolves with z is strongly linked to our understanding of how the galactic disks grow and where star formation takes place. [Pérez (2004), Pérez (2004)] showed that it is possible to detect stellar truncations even out to z1. Using the radial position of the truncation as a direct estimator of the size of the stellar disk, [Trujillo & Pohlen (2005), Trujillo & Pohlen (2005)] inferred a moderate (25%) inside-out growth of disk galaxies since z1. An important point, however was missing in the previous analyses: the evolution with redshift of the radial position of the break at a given stellar mass. The stellar mass is a much better parameter to explore the growth of galaxies, since the luminosity evolution of the stellar populations can mimic a size evolution ([Trujillo et al. (2004), Trujillo et al. 2004], [Trujillo et al. (2006), Trujillo et al. 2006]). We present in this contribution a quick summary of our recent findings on the stellar disk truncation origin and its evolution with redshift. The results presented here are based on the following publications: [Azzollini et al. (2008a), Azzollini et al. (2008a)], [Azzollini et al. (2008b), Azzollini et al. (2008b)] and [Bakos et al. (2008), Bakos et al. (2008)]. Throughout, we assume a flat -dominated cosmology ( = 0.30, =0.70, and =70 km ).
2 Color profiles in Local Galaxies
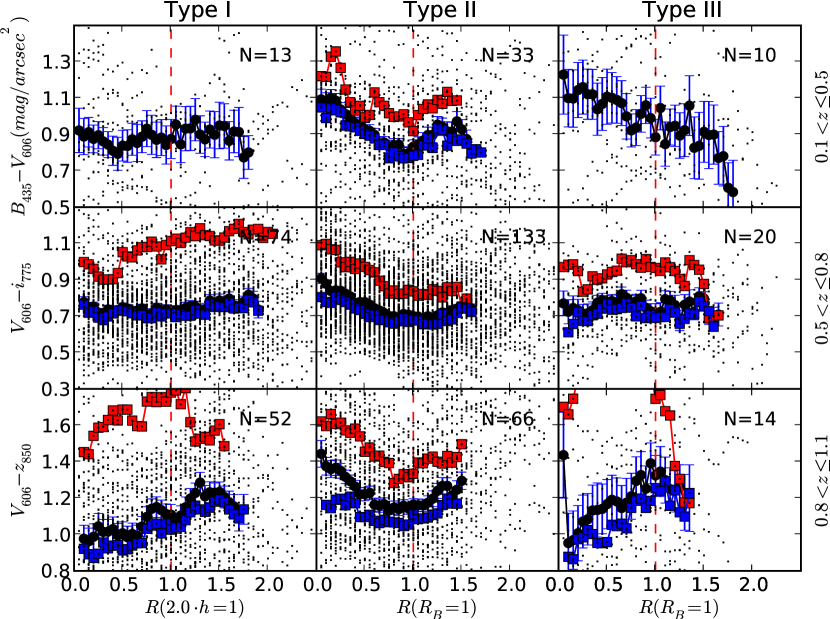
In order to contrain the outer disk formation models, in Bakos et al. (2008), we have explored radial color and stellar surface mass density profiles for a sample of 85 late-type spiral galaxies with available deep (down to 27 mag/arcsec2) SDSS g’ and r’ band surface brightness profiles [Pohlen & Trujillo (2006), (Pohlen & Trujillo 2006)]. About of the light profiles have been classified as broken exponentials, either exhibiting truncations (Type II galaxies) or antitruncations (Type III galaxies). Their associated color profiles show a significantly different behavior. For the truncated galaxies a radial inside-out bluing reaches a minimum of mag at the position of the break radius, this minimum is followed by a reddening outwards (see middle row in Fig. 1). The antitruncated galaxies reveal a different behavior. Their break in the light profile resides in a plateau region of the color profile at about .
Using the color [Bell et al. (2003), (Bell et al. 2003)] to calculate the stellar surface mass density profiles reveals a surprising result. The breaks, well established in the light profiles of the Type II galaxies, are almost gone, and the mass profiles resemble now those of the pure exponential Type I galaxies (see bottom row in Fig. 1). This result suggests that the origin of the break in Type II galaxies is more likely due to a radial change in the ingredients of the stellar population than being associated to an actual drop in the distribution of mass. The antitruncated galaxies on the other hand preserve to some extent their shape in the stellar mass density profiles.
There are other structural parameters that can be computed to contrain the different formation scenarios. Among these we have estimated the stellar surface mass density at the break for truncated (Type II) galaxies (13.61.6 M) and the same parameter for the antitruncated (Type III) galaxies (9.91.3 M). Finally, we have measured that 15% of the total stellar mass in case of truncated galaxies and 9% in case of antitruncated galaxies are to be found beyond the measured break radii in the light profiles.

3 Stellar disk truncation evolution
In Azzollini et al. (2008a), we have conducted the largest systematic search so far for stellar disk truncations in disk-like galaxies at intermediate redshift (1.1), using the Great Observatories Origins Deep Survey South (GOODS-S) data from the Hubble Space Telescope - ACS. Focusing on Type II galaxies (i.e. downbending profiles) we explore whether the position of the break in the rest-frame -band radial surface brightness profile (a direct estimator of the extent of the disk where most of the massive star formation is taking place), evolves with time. The number of galaxies under analysis (238 of a total of 505) is an order of magnitude larger than in previous studies. For the first time, we probe the evolution of the break radius for a given stellar mass (a parameter well suited to address evolutionary studies). Our results suggest that, for a given stellar mass, the radial position of the break has increased with cosmic time by a factor 1.30.1 between 1 and 0 (see Fig. 2). This is in agreement with a moderate inside-out growth of the disk galaxies in the last 8 Gyr. In the same period of time, the surface brightness level in the rest-frame -band at which the break takes place has increased by 3.30.2 mag/arcsec2 (a decrease in brightness by a factor of 20.94.2).


In Azzollini et al. (2008a) we also find that at a given stellar mass, the scale lengths of the disk in the part inner to the “break” were on average somewhat larger in the past, and have remained more or less constant until recently. This phenomenon could be related to the spatial distribution of star formation, which seems to be rather spread over the disks in the images. So disk galaxies had profiles with a flatter brightness distribution in the inner part of the disk, which has grown in extension, while becoming fainter and “steeper” over time. This is consistent with at least some versions of the inside-out formation scenario for disks.
4 Color profiles in intermediate redshift galaxies
In addition to the evolution on the position of the break in spiral galaxies is important to explore how the color of the surface brightness profiles has evolved with time. This kind of analysis sheds light on when stars formed in different parts of the disk of galaxies, thus giving hints on the stellar mass buildup process.
In Azzollini et al. (2008b) we present deep color profiles for a sample of 415 disk galaxies within the redshift range 0.1z1.1 , and contained in HST ACS imaging of the GOODS-South field. For each galaxy, passband combinations are chosen to obtain, at each redshift, the best possible approximation to the rest-frame color. We find that objects which show a truncation in their stellar disk (type II objects) usually show a minimum in their color profile at the break, or very near to it, with a maximum to minimum amplitude in color of 0.2 mag/arcsec2, a feature which is persistent through the explored range of redshifts (i.e., in the last 8 Gyr and that it is also found in our local sample for comparison (Bakos et al. 2008)). This color structure is in qualitative agreement with recent model expectations where the break of the surface brightness profiles is the result of the interplay between a radial star formation cutoff and a redistribution of stellar mass by secular processes ([Roškar et al. (2008), Roškar et al. 2008]). Our results fit qualitatively their prediction that the youngest stellar population should be found at the break radius, and older (redder) stars must be located beyond that radius. It is not easy to understand how ”angular momentum” or ”star formation threshold”/”ISM phases” models alone could explain our results. Thus they pose a difficult challenge for these models. However, it will also be necessary to check whether the Roškar et al. (2008) models (as well as other available models in the literature like those of [Bournaud et al. 2007, Bournaud et al. 2007] and [Foyle et al. 2008, Foyle et al. 2008]) are able to reproduce quantitatively the results shown here.
Combining the results found in Azzollini et al. (2008b) and Bakos et al. (2008) one is tempted to claim that both the existence of the break in Type II galaxies, as well as the shape of their color profiles, are long lived features in the galaxy evolution. Because it would be hard to imagine how the above features could be continuously destroyed and re-created maintaining the same properties over the last 8 Gyr.
References
- [Azzollini et al. (2008a)] Azzollini, R., Trujillo, I., Beckman, J. E. 2008a, ApJ, in press, arXiv:0805.2259
- [Azzollini et al. (2008b)] Azzollini, R., Trujillo, I., Beckman, J. E. 2008b, ApJ, 679, L69
- [Bakos et al. (2008)] Bakos, J., Trujillo, I., Pohlen, M. 2008, ApJ, in press, arXiv:0807.2776
- [Battaner et al. (2002)] Battaner, E., Florido, E., Jiménez-Vicente, J. 2002, A&A, 388, 213
- [Bell et al. (2003)] Bell, E.F., McIntosh, D.H., Katz, N., Weinberg, M.D. 2003, ApJ Supplement Series, 149, 289
- [Bournaud et al. 2007] Bournaud, F., Elmegreen, B. G., & Elmegreen, D. M. 2007, ApJ, 670, 237
- [Debattista et al. (2006)] Debattista, V. P., Mayer, L., Carollo, C. M., Moore, B. Wadsley, J., & Quinn, T. 2006, ApJ, 645, 209
- [de Vaucouleurs (1959)] de Vaucouleurs, G. 1959, Handb. Phys., 53, 311
- [Elmegreen & Parravano (1994)] Elmegreen, B. G. & Parravano, A. 1994, ApJ, 435, L121
- [Foyle et al. 2008] Foyle, K., Courteau, S., Thacker, R. J. 2008, MNRAS, 386, 1821
- [Freeman (1970)] Freeman, K. C. 1970, ApJ, 160, 811
- [Kennicutt (1989)] Kennicutt, R. C. 1989, ApJ, 344, 685
- [Patterson (1940)] Patterson, F. S. 1940, Harvard Coll. Obs. Bul., 914, 9
- [Pérez (2004)] Pérez, I. 2004, A&A, 427, L17
- [Pohlen et al. (2004)] Pohlen, M., Beckman, J. E., Hüttemeister, S., Knapen, J. H., Erwin, P., & Dettmar, R.-J. 2004, Penetrating Bars through Masks of Cosmic Dust: The Hubble Tuning Fork Strikes a New Note, ed. D. L. Block, I. Puerari, K. C. Freeman, R. Groess, & E. K. Block (Dordrecht: Springer) 731
- [Pohlen & Trujillo (2006)] Pohlen, M., & Trujillo, I. 2006, A&A, 454, 759
- [Roškar et al. (2008)] Roškar, R., Debattista, V. P., Gregory, S. S., Thomas, R. Q., Kauffman, T., & Wadsley, J. 2008, ApJ, 675L, 65
- [Schaye (2004)] Schaye, J. 2004, ApJ, 609, 667
- [Trujillo et al. (2004)] Trujillo, I. et al. 2004, ApJ, 604, 521
- [Trujillo & Pohlen (2005)] Trujillo, I. & Pohlen, M. 2005, ApJ, 630, L17
- [Trujillo et al. (2006)] Trujillo, I. et al. 2006, ApJ, 650, 18
- [van den Bosch (2001)] van den Bosch, F. C. 2001, MNRAS, 327, 1334
- [van der Kruit (1987)] van der Kruit, P. C. 1987, A&A, 173, 59