How long does it take a society to learn a new term?
Abstract
In this paper, I study the diffusion of new terms, called neologism, in social networks. I consider it as an example of information dynamics on networks and I hope that solving this problem can help us to understand and describe the information dynamics problem. To do so I develop a phenomenological model for the diffusion mechanism. I find an analytical relationship between number of people in the society who has learned the term and time taken. The Network parameters are imported in this analytical solution. I also present some simulation for this mechanism for several sample and some real networks which confirms the analytical results. In addition, I study the effects of network topology on diffusion process.
I introduction
Recently, attempts to describe and understand the status and different behaviors of a society have been the subject of intense research. The structure of social networks has been studied and simulated by different types of random graphs such as scale free and small world graphsrandomgraphs . Some methods were developed to identify communities in social networks community1 ,community2 ,community3 ,community4 , and centrality in networkscentrality . There is no need to talk about its importance because it is easy to realize the effect of such an understanding on our life.
Besides these attempts to study the societies, some new researches were developed to study phenomena that occur in the societies. One of the most important phenomena in the society is that when a piece of information enters the society, some people get it and then it starts to spread through out the network. The piece of information may be a gossip, a virus, fame of a film or a person and etc. This phenomenon is called information spread or information dynamics on networks.
The information spread has been studied in several cases. For instance, the problem of gossip spread in social networks has been studied by Lind et al gossip . Similar researches were devoted to the dynamic of reputation reputation and the diffusion of viruses viruses , disease disease and computer viruses computerviruses .
In this work, I go through the spread of a new term in a society. Indeed, the main question I want answer is that, when a new scientific term or expression is produced, how does it spread through the scientific societies, but in this paper, I have studied and solved the general problem of the spread of any term in any social network.
To do this, first I used graphs as a mathematical tool to describe the society in my model. Second, I present a phenomenological model to illustrate the diffusion mechanism where by phenomenological I mean that this model is mostly based on our intuitional understanding of this phenomenon. In other words, in this model, as we may expect, the term is generated by someone out of the society and spreads through people’s conversations.
Here, I derive an analytical relationship between the number of people who have learnt the term and time taken. One of the key point in this job is that this relationship matches our expectations. In addition, I developed some simulations for this model which confirm the analytical results.
The structure of this paper is as follows: in section (II), I introduce my problem and my model. In section (III) I present my analytical solution for term spread in society. In section (IV) I explain some details about the simulation that I developed for this problem. Then some of the key results are extracted in section (V). Finally, some concluding remarks are made in Section (VI).
II The model
Here I describe my model and explain the main concepts, assumptions and my notation.
I model the society as a graph G(N,E) where vertices N represent people and edges E represent their relationships. In other words a society is a set of vertices which are connected to each other if and only if corresponding persons are related to each other. This relation might be family relationship, friendship, a scientific cooperation, etc. Here, I use simple graphs for simplicity; directed and weighted graphs can be used in appropriate situations. For example if people’s relationships are not the same, I can use weighted graphs.
On the other hand, I have to model the spread mechanism. The main idea in my model is that someone learns the new term and then teaches it to those who he or she has a relation with. In this section I explain the implementation of this idea.
To do this, I first need to implement the individual learning process because the society learning is based on it. As in a real situation, each person needs to hear the term several times to learn it. Indeed, every person hears the term time after time during the learning process, but he cannot use it unless the number of times he has heard the term, , passes a specific number of times which I call the learning threshold and depends on his abilities. The threshold, is one of the model’s parameters.
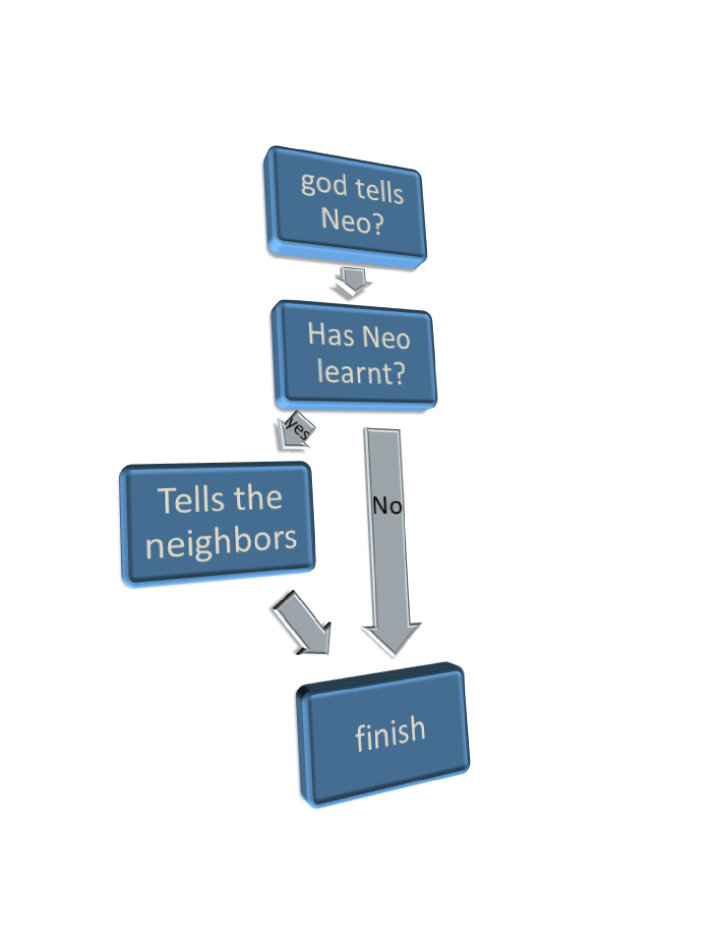
I also divide the society learning process into smaller processes. Indeed my model is based on repeating a learning step which I call game Fig. ( 1). In each game, someone is chosen randomly and is called Neo. Neo hears the term and increases by one. If he learns the term, he would tell it to his friends. So his friends hear the term once. Otherwise, if Neo does not learn the term, he cannot use it in his conversations. After Neo’s action the game finishes.
In each game, some people hear the term and their increases by one and after several games their hearing times reaches the threshold and they learn the term. In other words, in each game some people may learn the term also it may happen that no new person learns it. Repeating the game, the number of learnt people increases and approaches the total number of people in the society, N.
In brief, the main characteristics of game are :
- god
-
the one out side the game who knows the term and chooses the Neo and tells the term to him.
- Neo
-
the one who is randomly chosen in each game by god.
- learner
-
the one who has not learnt the term yet and for him.
- learnt
-
the one who has learnt the term and who can teach it to his friends.
Also, there are some assumptions in my model which are as follows :
-
1.
The society network is static. In fact I assumed that people and their relationship are fixed when they learn term. Because the time scale of society dynamics seems to be negligible in comparison with learning process time scale, my assumption is still valid.
-
2.
There is a god out side the society who knows the term and chooses Neo and as an external force, tells him the term. In a real society, different choices such as multimedia, language academies, etc can play it’s role.
-
3.
The leaning process for all terms are the same.
Having defined the model, I explain my approach to use this model to illustrate the learning process.
I first need to quantify the learning process and present a measure for it. The number of learnt people seems to be a good quantity for this purpose. Alternatively, I need a measure to quantify the time in the game and a good choice for time is the number of games. In each society, each game takes some time to finish and the average of this time may be calculated easily. Consequently each game represents a time scale. Now the number of learnt people in each game, represent the learning improvement up to that time. Using these two, I can easily define other needed quantities such as learning speed. So, my model is complete.
From now on, for better and easier understanding, I fix the following notations:
-
•
g Number of finished games
-
•
w Number of learnt people
-
•
N Number of people in the society
-
•
L Number of relationship between people()
-
•
D Average personal learning threshold
-
•
Number of times that the i th person has heard the term.
-
•
Number of people who are related to i th person in the network or the degree of i th vertex
-
•
Average number of friend each person may have
I have studied this model with two approaches: first, analytical solution of learning improvement W(g). Second, simulation of model and studying the behavior of w versus g. Next section focuses on analytical solution.
III analytical solution
In this section, I want to derive an analytical relation between learning improvement w and spent time g. One of the key point in my job is that I make use of mean field approximation to do this. This means that the distribution of quantities over a randomness is represented by their average value.
Here, I first calculate the learning improvement per game , then I assume it to be which is valid when the learning steps are increased in number and decreased in length. Consequently a differential equation is obtained and solving the differential equation would result in an analytical solution of W(g).
To calculate the learning improvement per game I first estimate the number of people who hear the term in a game, and then I can obtain the improvement in learning. To estimate the average number of people called in a game, , I follow the game steps. In each game at least one person, Neo, is called. Then depending on NEO’s state, different cases are possible. Neo may be in:
-
1.
Standby state:Neo has not learnt the term yet and does not learn in this game either. So he can not tell the term to his friends.
-
2.
Transition state: Neo has just heard the term D-1 times so he would pass his learning threshold in this game and would be able to tell the term to his friends from now on.
-
3.
Active state: NEO has learnt the term in previous games, so his knowledge does not improves, but he can tell the term to his friends.
Number of learnt persons differs in each case. So I calculate the average number of people who learn the term in each game. To do so I need to calculate the probability of occurrence of each case and the number of people who learn the term in each case . Then the average number of people who learn term in a game, can be calculate as :
| (1) | |||||
| (2) |
So I need just to calculate the and sets where i is a possible case.
On the first step I calculate the set. I can make use of the total number of learnt people, to guess the Neo’s state. indicates the probability of a person being learnt and therefore the probability of Neo being in active state. On the other hand, denotes the probability of Neo being in standby or transition state. As each person needs to hear the term times to learn it, on first times he would not pass the threshold and remains in standby state, but in th time which is the transition state he joins the learnt persons. Thus, the chance of being in standby state is ’th times more than transition state. As a result the probability of occurrence of these states are obtained as:
| (3) | |||||
| (4) | |||||
| (5) |
The next step is calculating the set and for Neo’s different states, they are easily obtained as :
- Standby:
-
Only his own knowledge improves :
- Transition:
-
As his knowledge improves he becomes able to call his friends:
- Active:
-
He can call his friends but his knowledge does not improves anymore:
Now according to Eq.( 1) I can calculate
| (6) |
where
| (7) |
There is just one step left to calculate the learning improvement per game. The point is that among all those who have heard the term during the game, only the knowledge of those who have not learned the term, increases. In other words, if those who have heard the term are in standby or transition states their knowledge increases, so I have to multiply by to obtain the average number of people whose knowledge improves. To determine the amount of improvement per each game, it suffices to determine the amount of improvement when each person is called. As explained personi needs to hear the term th times, so each time that he is called, his knowledge improves by . Finally the following differential equation is obtained:
| (8) |
again with:
| (9) |
Solving the differential equation leads to:
| (10) |
This equation ends the analytical solution. It is just left to check how good this relation describes the society learning. To do so, I developed and ran some simulation which is illustrated in the next section.
IV simulation
In this section I want to explain my simulation procedure, some details about it and some of its features.
First, I need to implement the society. To do so, I make use of a mathematical graph. Indeed, I produce a matrix which is the adjacency matrix of the graph. Each row and column in this matrix represents a person in the society and person a is a friend of person b if .
To construct the adjacency matrices, I used the real network data of condensed matter collaborations collected by Mark Newmanrealdata . In addition, I made use of pajeck and ORA softwares to generate some random graphs such as scale free and small world and tested my model on generated graphs.
Then, for each person i, I set a randomly between 1 and 100 which means that people’s learning threshold is between 1 and 100.
Second, I use the adjacency matrix to implement the game. Each time a person is chosen randomly as Neo and his learning increases by one. Then if , according to adjacency matrix Neo’s friends are recognized and corresponding s increases. Now the game is finished and a new game would start.
I also defined an other parameter, w which increases each time that someone’s learning passes his threshold. This parameter indicates the number of learnt people in the society.
The game is repeated until a certain percent of society, learn the term and the number of games is counted. Also, in this program, I calculate the number of past games for each , 100 times and average over all the results. Consequently the number of games which is required to have a certain percentage of the society learn the term, is obtained.

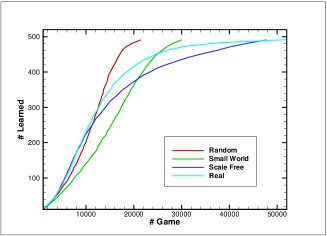
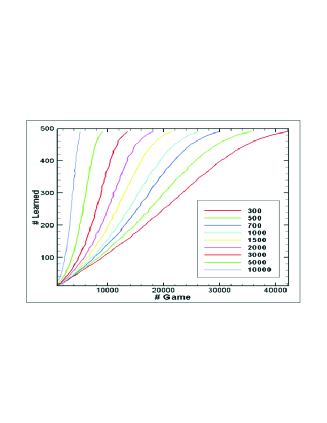
I repeat this procedure for to obtain the relation between and number of games. Fig. ( 2 -b) presents my results for several networks, one real, one random, one scale free and one small world network.
I used and analyzed the simulation results. Next section go through a comparison between simulation results and analytical solution.
V results
In this section I first study the overall behavior of the mechanism according to both analytical solution and simulation results and then its dependence on model parameters such as number of edges and of vertices. I also check the results to be logical and match our expects.
V.1 learning process
The analytical solution describes the learning process as follows : at the beginning, the learning velocity is slow and only few people learn the term during first games. Then this velocity would speed up gradually till a specific percentage of the society learns the term and then it slows down again. Consequently, only few people learn during the last games. Fig. ( 2) presents the learning process according to both analytical solution and simulations for different network topologies. It is seen that simulation results confirm the analytical results for the learning process.
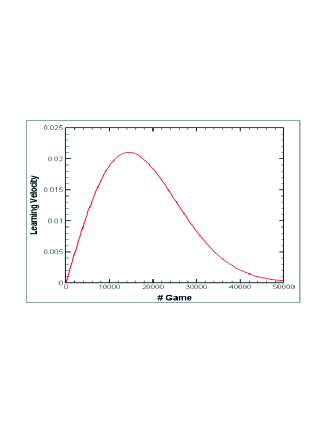
In addition, Fig. ( 3) shows the learning velocity of the society versus time (g). It starts with zero, then speeds up to a maximum, and then slows down again for large values of g or large time and limits to zero.
Next two sections illustrate the effect of network topology on learning process.
V.2 learning process and the size of population(N)
Here I go through the effect of size of the population, N. To do so I work with the percent of society who have learned the term and games taken:
| (11) |
I can calculate number of games taken for the desired percent according to Eq. ( 10). Solving Eq. ( 11), I can find the game in which percent of the society learns the term. I denote it as and it is obtained as:
| (12) |
From now on, I work with as the saturation time for a desired amount of .
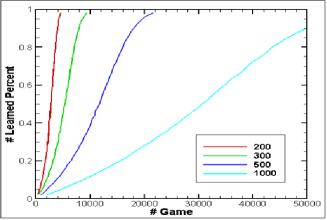
As a result of both analytical solution and simulation results, societies with larger population need more time to be saturated which seems to be natural. Fig. ( 4) presents the simulation results for learning process for societies of different sizes. It is seen that for larger N, the learning process graph shifts to larger time and saturates slower which means that for larger population, larger saturation time, is needed.
On the other hand, according to Eq. ( 12), the saturation time depends linearly on population size, N which means that analytical solution confirms the simulation results.
V.3 learning process and the number of relationship(L)
The other result is about the effect of people relationship, L on the learning process. Imagine a society in which most people know each other versus a society in which only few people are connected. In this section I describe how learning process differs for these two societies. Again both simulation and analytical results are presented. Fig. ( 5) shows learning process for networks with different number of edges. These figures, indicates that as people relationships increase the society learns the term sooner and the time scale of saturation decreases.
On the other hand, the analytical solution predicts similar behaviors. Obviously, the is proportional to number of edges L :
| (13) |
Where s is a constant that depends on the distribution function of degrees of vertices of the network and for a fixed distribution function it does not change. Replacing Eq. (13) in Eq. ( 12), the following relation is obtained:
| (14) |
This equation is plotted in Fig. ( 6) and describes the analytical behavior of saturation time versus L. According to this analytical result, when the size of relation between people, L increases, society learns the term faster and in fact the saturation time decreases which is compatible with both simulation result and our expectations.

VI conclusion
I have studied the process in which a new term spreads out through a social network. I have used a phenomenological model to describe this process and studied this model both analytically and using computer simulation.
According to this job, the process in which a new term spreads out through a network is described as follows: At the beginning of the process, few people knows the term. Consequently, the role of people interaction in learning process is negligible in compassion with external force. But as time passes, the number of learnt people increases and their contribution in learning process increases the process velocity. It means that the number of people who learn the term in a specific time increases. Finally when most of the society learn the term, as there are few learner people, the process velocity decreases and limits to zero. This description is illustrated in Fig. ( 2).
Maybe the key feature of my job is that I have imported the topological parameter of the society network in my model. In other word, network topology is accounted in my job. For instance it were seen that when the number of people, N increases, the saturation time increases in turn or when the number of edge increases in network, the saturation time decreases.
For the next step the relation between different terms in a language may be considered. For instance the interrealtion between terms may affect the society learning proccess and help people to learn it faster. Also the spread mechanism can be improved or other kind of diffusion mechanism maybe checked.
VII acknowledgment
I want to thank F. Ghanbarnejad first because of her nice consults and second because she helped me through the simulation. Indeed, she implemented the spread mechanism. I also want to acknowledge Prof. Mansouri and S. Hamidi for their discussions.
References
- (1) M. E. J. Newman, S. H. Strogatz, and D. J.Watts, Phys. Rev. E 64, 026118 (2001).
- (2) D. Wilkinson and B. A. Huberman, Proc. Natl. Acad. Sci. USA, Feb. 2, 2004, 10.1073/pnas.0307740100.
- (3) L. Freeman, Sociometry, vol. 40, pp. 35 41, 1977.
- (4) U. Brandes, Journal of Mathematical Sociology, vol. 25, no. 2, pp. 163 177, 2001.
- (5) M. E. J. Newman, cond-mat/0309508/, 2003. F. Wu and B. A.
- (6) Huberman, Europhysics Letters, 2004.
- (7) L. C. Freeman, Social Networks, 1(1978/79) 215-239.
- (8) Pedro G. Lind, Luciano R. da Silva, Jos e S. Andrade Jr., and Hans J. Herrmann, Phys. Rev. E 76, 036117 (2007).
- (9) B. A. Huberman, F. Wu, Journal of Statistical Mechanics: Theory and Experiment(2004)P04006.
- (10) Z. Dezso and A.-L. Barabasi, Phys. Rev. E, 65, 055103 (2002).
- (11) M. Newman, Phys. Rev. E, 66, 016128 (2002).
- (12) M. E. J. Newman, S. F., and J. Balthrop, Phys. Rev. E, 66, 035101 (2002).
- (13) M. E. J. Newman, Proc. Natl. Acad. Sci. USA 98, 404-409 (2001).