Multiplicity of young stars in and around R Corona Australis††thanks: Based on observations obtained at the European Southern Observatory, La Silla, proposal numbers 55.E-0968, 65.I-0086, and 67.C-0213
Abstract
Context. In star-forming regions like Taurus-Auriga, it has been found that most young stars are born as multiples, which theories for star formation should definitely take into account. The R CrA star-forming region has a small dark cloud with quite a number of protostars, T Tauri stars, and some Herbig Ae/Be stars, plus a number of weak-line T Tauri stars around the cloud found by ROSAT follow-up observations.
Aims. We would like to detect multiples among the young stars in and around the R CrA cloud in order to investigate multiplicity in this region.
Methods. We performed interferometric and imaging observations with the speckle camera SHARP I at the ESO 3.5 m NTT and adaptive optics observation with ADONIS at the ESO 3.6 m telescope, all in the near-infrared bands JHK obtained in the years 1995, 2000, and 2001.
Results. We found 13 new binaries among the young stars in CrA between 0.13 arcsec (the diffraction limit) and 6 arcsec (set as an upper separation limit to avoid contamination by chance alignments). While most multiples in CrA are binaries, there are also one quadruple (TY CrA), and one triple (HR 7170) which may form a quintuple together with the binary HR 7169. One of the newly detected companions with a large magnitude difference found near the M3-5 type T Tauri star [MR 81] H 17 could be a brown dwarf or an infrared companion with an edge-on disk. Among seven Herbig Ae/Be stars in CrA, six are multiple.
Conclusions. The multiplicity frequency in CrA is as high as in similar star forming regions. By comparing with the period distribution of main-sequence stars and extrapolating to separations not probed in this survey, we conclude that the companion-star frequency is ; i.e. the average number of companions per primary is 0.95.
Key Words.:
Stars: pre-main-sequence – Binaries: close – Infrared: stars – Instrumentation: high angular resolution – Surveys1 Introduction
The star-forming region Corona Australis (southern crown), abbreviated CrA or R CrA, is today known as one of the nearest regions of ongoing and/or recent intermediate- and low-mass star formation. The dark cloud around R CrA has an extinction of up to mag. The age ranges between Myrs for the protostars to Myrs for some T Tauri stars (James et al. 2006). See Neuhäuser & Forbrich (2008) for a recent review.
Casey et al. (1998) determined the distance towards the eclipsing double-lined spectroscopic binary (SB) TY CrA to be pc from their orbit solution. Because this is consistent with other earlier estimates (see discussion in Neuhäuser & Forbrich 2008) and, at the same time, the best current estimate, we use pc as the distance for the young stars in CrA.
Neuhäuser & Forbrich (2008) give a list of all known optically visible members compiled from various sources. Only a few multiples have been published among the CrA members so far; see Table 1 for a listing. Hence, while six out of seven Herbig Ae/Be stars are known or suspected to be multiple, only five T Tauri stars (TTS) were known to be multiple, a low number compared to other star-forming regions. In addition, the brown dwarf member Denis1859 is a known binary (Bouy et al. 2004).
| Designation | Separation | Position | Brightness ratio (a) | Epoch | Reference | ||
|---|---|---|---|---|---|---|---|
| [arc sec] | Angle [∘] | J | H | K | day/month/year | ||
| S CrA | 04/07/1942 | (1) | |||||
| (15) | |||||||
| (b) | 12/04/1995 | (2) | |||||
| 1981.25 | (3) | ||||||
| April 1991 | (4) | ||||||
| 25/08/1996 | (5) | ||||||
| 0.45 | 0.41 | 0.39 | 06-08/06/1987 | (6) | |||
| 01/07/1996 | (7) | ||||||
| TY CrA B-C | eclipsing spectroscopic binary | (13,14) | |||||
| A-BC | (15) | ||||||
| A-D | 31/03/2002 | (8) | |||||
| R CrA | spectro-astrometric binary according to Takami et al. 2003, but no binarity detected in Bailey 1998 | ||||||
| T CrA | 26/08/1996 | (5) | |||||
| 26/06/1997 | (5) | ||||||
| VV CrA | (b) | 12/04/1995 | (2) | ||||
| 1993/1994 | (9) | ||||||
| April 1991 | (4) | ||||||
| 0.98 | 0.26 | 0.12 | 06-08/06/1987 | (6) | |||
| 01/07/1996 | (7) | ||||||
| CrAPMS 3 | 58 | April 1991 | (4) | ||||
| 58 | 0.12 | 0.13 | 0.15 | 06-08/06/1987 | (6) | ||
| 0.19 | (10) | ||||||
| 01/07/1996 | (7) | ||||||
| CrAPMS 6 | 0.95 | 0.95 | 0.89 | 1997 | (10) | ||
| RXJ1857.5-3732 | (11) | ||||||
| DENIS-PJ | 24/09/2002 | (12) | |||||
| 185950-370632.9 | 24/09/2002 | (12) | |||||
| 12/09/2000 | (12) | ||||||
| 12/09/2000 | (12) | ||||||
| HR 7169 | spectroscopic binary (WDS, Worley & Douglass 1997), 13 arc sec CPM pair with HR 7170 | ||||||
| HR 7170 | spectroscopic binary (WDS, Worley & Douglass 1997), 13 arc sec CPM pair with HR 7169 | ||||||
| HD 176386 | (16) | ||||||
Remarks: (a) Always here by definition. (b) For consistency, we give here the reciprocal value of the flux ratio given by Ghez et al. (c) RXJ1846.7-3636 was listed as binary in (11), i.e. with separation above the 6” upper limit used here, hence regarded as two separate stars here. (d) The very low-mass star or brown dwarf CrA 444 may also be a binary (Lopez Marti et al. 2005).
References: (1) Joy & van Biesbroeck (1944), (2) Ghez et al. (1997), (3) Baier et al. (1985), (4) Reipurth & Zinnecker (1993), (5) Bailey (1998), (6) Chelli et al. (1995), (7) Prato et al. (2003), (8) Chauvin et al. (2003), (9) Ageorges et al. (1997), (10) Walter et al. (1997), (11) Neuhäuser et al. (2000), (12) Bouy et al. (2004), (13) Gaposchkin & Greenstein (1936), (14) Casey et al. (1998), (15) Proust et al. (1981) (16) Dommanget & Nys (2002)
Therefore, we performed this new homogeneous multiplicity survey of most CrA members with the infrared speckle camera SHARP I and the infrared adaptive optics (AO) instrument ADONIS. We explain our observations and the data reduction in Sect. 2, list all results in Sect. 3, compare our observations of multiples with previous observations in Sect. 4, and conclude in Sect. 5.
2 Observations and data reduction
We have observed the sample of 49 optically visible young members of the R CrA association listed in Table 2. This list is compiled from Glass & Penston (1975), Marraco & Rydgren (1981), Herbig & Bell (1988), Walter et al. (1997), as well as Neuhäuser (1997) and Neuhäuser et al. (2000).
| No. | Designation | Date(s) of Observation(s) | Instrum. | Filter(s) | Type (a) | SpTy | Note | ||
|---|---|---|---|---|---|---|---|---|---|
| 1 | S CrA | 19:01:08.6 | -36:57:20 | 12 July 1995, 06 July 2001 | SHARP | JHK | c | K6 | |
| 2 | TY CrA | 19:01:40.8 | -36:52:34 | 12 July 1995 | SHARP | K | H | B9 | |
| 3 | R CrA | 19:01:53.6 | -36:57:08 | 12 July 1995 | SHARP | K | H | A5 | |
| 4 | DG CrA | 19:01:55.2 | -37:23:41 | 12 July 1995 | SHARP | K | c | K0 | |
| 5 | T CrA | 19:01:58.8 | -36:57:50 | 12 July 1995 | SHARP | K | H | F0 | |
| 6 | VV CrA | 19:03:06.7 | -37:12:50 | 12 July 1995, 06 July 2001 | SHARP | JHK | c | K1 | |
| 7 | $[MR81]$ H$α$ 10 | 18:58:51.8 | -37:19:23 | 12 July 1995 | SHARP | K | n | K | (b) |
| 8 | $[MR81]$ H$α$ 6 | 19:00:01.6 | -36:37:05 | 12 July 1995 | SHARP | K | c | M1 | |
| 9 | Kn Anon 2 | 19:01:06.9 | -36:58:07 | 12 July 1995 | SHARP | K | n | G0 | (b) |
| 10 | V709 CrA | 19:01:34.9 | -37:00:57 | 12 July 1995 | SHARP | K | w | K1 | |
| 11 | $[MR81]$ H$α$ 2 | 19:01:41.6 | -36:59:53 | 12 July 1995 | SHARP | K | c | K8 | |
| 12 | V702 CrA | 19:02:02.0 | -37:07:44 | 12 July 1995 | SHARP | K | w | G5 | |
| 13 | CrAPMS 3 | 19:02:22.1 | -36:55:41 | 12 July 1995, 4 July 2001 | SHARP | JHK | w | K2 | |
| 14 | $[MR81]$ H$α$ 14 | 19:02:27.2 | -36:58:10 | 12 July 1995, 2 July 2001 | SHARP | JHK | w | M0-3 | |
| 15 | $[GP 75]$ R CrA e2 | 19:01:27.2 | -36:59:09 | 2 July 2001 | SHARP | K | T | M3-5 | |
| 16 | $[GP 75]$ R CrA f2 | 19:01:09.7 | -36:47:53 | 2 July 2001 | SHARP | K | w | K4 | |
| 17 | $[GP 75]$ R CrA n | 19:01:47.9 | -36:59:30 | 2 July 2001 | SHARP | K | c | ||
| 18 | $[MR81]$ H$α$ 12 | 19:00:01.7 | -36:27:58 | 6 July 2001 | SHARP | K | T | M3-5 | |
| 19 | $[MR81]$ H$α$ 13 | 19:02:00.1 | -37:02:22 | 6 July 2001 | SHARP | K | T | M3-5 | |
| 20 | $[MR81]$ H$α$ 15 | 19:04:17.3 | -36:59:03 | 6 July 2001 | SHARP | K | T | M3-5 | |
| 21 | V721 CrA | 19:09:45.9 | -37:04:26 | 2 July 2001 | SHARP | K | w | K | |
| 22 | $[MR81]$ H$α$ 17 | 19:10:43.4 | -36:59:09 | 6 July 2001 | SHARP | K | T | M3-5 | |
| 23 | CrAPMS 4 NW | 18:57:17.8 | -36:42:36 | 4 June 2000 | ADONIS | K | w | M0.5 | |
| 24 | CrAPMS 4 SE | 18:57:20.7 | -36:43:00 | 4 June 2000 | ADONIS | K | w | G5 | |
| 25 | CrAPMS 5 | 18:58:01.7 | -36:53:45 | 4 June 2000 | ADONIS | K | w | K5 | |
| 26 | CrAPMS 6 | 18:59:14.7 | -37:11:30 | 5 July 2001 | SHARP | K | w | M3-4 | |
| 27 | CrAPMS 8 | 19:00:28.9 | -36:56:02 | 2 July 2001 | SHARP | K | w | M3 | |
| 28 | CrAPMS 9 | 19:00:39.1 | -36:48:11 | 5 July 2001 | SHARP | K | w | M2 | |
| 29 | RXJ1855.1-3754 | 18:55:12.0 | -37:53:52 | 5 June 2000 | ADONIS | K | w | K3 | |
| 30 | RXJ1836.6-3451 | 18:36:39.5 | -34:51:26 | 6 June 2000 | ADONIS | K | w | M0 | |
| 31 | RXJ1839.0-3726 | 18:39:05.3 | -37:26:22 | 5 June 2000 | ADONIS | K | w | K1 | |
| 32 | RXJ1840.8-3547 | 18:40:53.3 | -35:46:45 | 3 July 2001 | SHARP | K | w | M4 | |
| 33 | RXJ1841.8-3525 | 18:41:48.6 | -35:25:44 | 5 June 2000 | ADONIS | K | w | G7 | |
| 34 | RXJ1842.9-3532 | 18:42:58.0 | -35:32:43 | 6 June 2000 | ADONIS | K | c | K2 | |
| 35 | RXJ1844.3-3541 | 18:44:21.9 | -35:41:44 | 5 June 2000 | ADONIS | K | w | K5 | |
| 36 | RXJ1844.5-3723 | 18:44:31.1 | -37:23:34 | 6 June 2000 | ADONIS | K | w | M0 | |
| 37 | RXJ1845.5-3750 | 18:45:34.8 | -37:50:20 | 6 July 2001 | SHARP | JHK | w | G8 | |
| 5 June 2000 | ADONIS | K | |||||||
| 38 | RXJ1846.7-3636 | 18:46:45.6 | -36:36:18 | 4 July 2001 | SHARP | JHK | w/w | K6-7 | (c) |
| 5 June 2000 | ADONIS | K | |||||||
| 39 | RXJ1852.3-3700 | 18:52:17.3 | -37:00:12 | 6 June 2000 | ADONIS | K | c | K3 | |
| 40 | RXJ1853.1-3609 | 18:53:06.0 | -36:10:23 | 5 June 2000 | ADONIS | K | w | K2 | |
| 41 | RXJ1856.6-3545 | 18:56:44.0 | -35:45:32 | 6 July 2001 | SHARP | JHK | w | M2 | |
| 6 June 2000 | ADONIS | K | |||||||
| 42 | RXJ1857.5-3732 | 18:57:34.1 | -37:32:32 | 2 July 2001 | SHARP | K | w/w | M5-6 | |
| 43 | RXJ1901.4-3422 | 19:01:28.7 | -34:22:36 | 5 June 2000 | ADONIS | K | w | F7 | (d) |
| 44 | RXJ1901.6-3644 | 19:01:40.5 | -36:44:32 | 6 July 2001 | SHARP | JHK | w | M0 | |
| 6 June 2000 | ADONIS | K | |||||||
| 45 | RXJ1917.4-3756 | 19:17:23.8 | -37:56:50 | 3 July 2001 | SHARP | K | w | K2 | |
| 5 June 2000 | ADONIS | K | |||||||
| 46 | HR 7169 | 19:01:03.3 | -37:03:39 | 1 July 2001 | SHARP | K | H | B9 | |
| 47 | HR 7170 | 19:01:04.3 | -37:03:42 | 1 July 2001 | SHARP | K | H | B8 | |
| 48 | HD 176386 | 19:01:38.9 | -36:53:27 | 1 July 2001 | SHARP | K | H | B9 | |
| 49 | SAO 210888 | 19:04:44.4 | -36:50:41 | 1 July 2001 | SHARP | K | H | B9.5 |
The majority of our targets (Table 2) were observed with the speckle interferometry method during two observing runs in July 1995 and July 2001 at the European Southern Observatory (ESO) 3.5 m New Technology Telescope (NTT) on La Silla, Chile. We used the SHARP I camera (System for High Angular Resolution Pictures) of the Max-Planck-Institut for Extraterrestrial Physics (Hofmann et al. 1992). All observations were done in the K-band at ; some of the stars, where a companion candidate was detected, were also observed in the H- and J-bands at and , respectively. For most targets, integration times of 0.5 s per frame were used. For the bright stars R and T CrA, the time was reduced to 0.2 s to avoid saturating the detector. On each target, 500 frames were taken in 1995, or 600 frames in 2001, giving a total integration time of 100 s for R and T CrA, and 250 – 300 s for the other targets. To allow background subtraction and bad pixel correction, the telescope was moved after half of the frames had been taken, to position the target at a different spot on the detector.
A few targets were observed in June 2000 with the AO system ADONIS and the SHARP II camera at the ESO 3.6 m telescope on La Silla. We used the K-band filter of this instrument, which has a central wavelength of . The observing strategy was similar to that used for the speckle observations, i.e. we took many frames with short integration times. This allows us to use the same programs and algorithms for data reduction. Since the AO system corrects the atmospheric turbulence, somewhat longer integration times of 1 – 2 s per frame could be used. The targets were observed at 4 different positions on the detector. In total, 120 – 240 frames were recorded to obtain a total integration time of 240 s for each target. Both SHARP I and ADONIS/SHARP II were used in a configuration with a field-of-view of about .
The detectors of the SHARP cameras use separate read-out electronics for the four quadrants, which leads to discontinuities at the quadrant borders. To avoid distortions in the images of our stars, we positioned the targets in the centers of one quadrant. This implies that companions at separations larger than about might be outside the field-of-view. To make sure we did not miss any companions, we searched the 2MASS point source catalog (Skrutskie et al. 2006) for sources near our targets. We did not find any additional companions within .
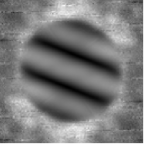
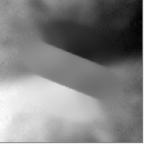
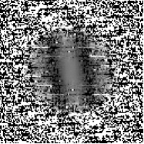
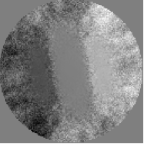
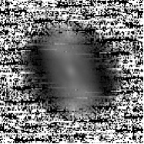
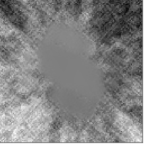
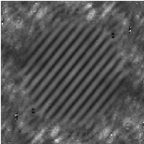
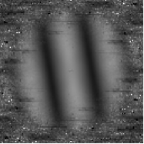
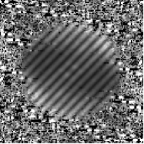
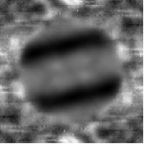
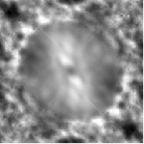
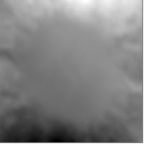
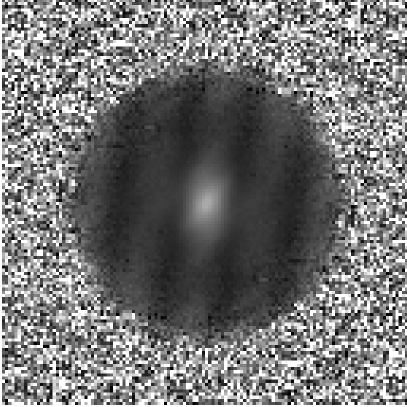
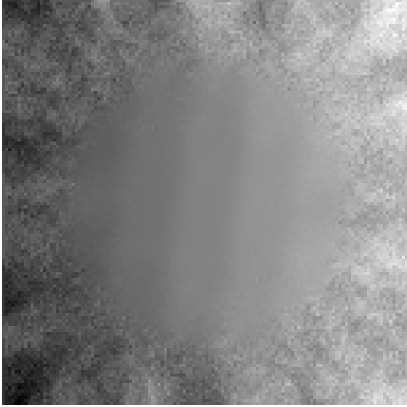
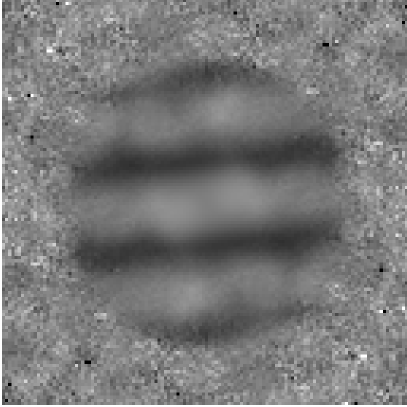
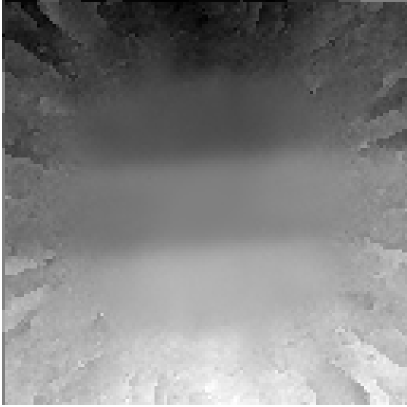
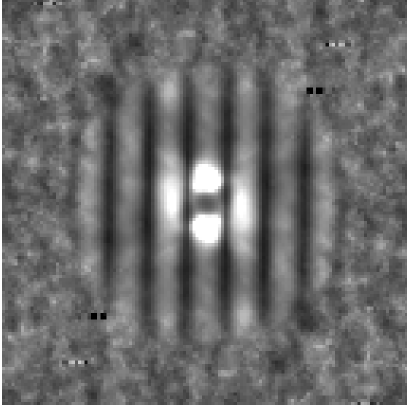
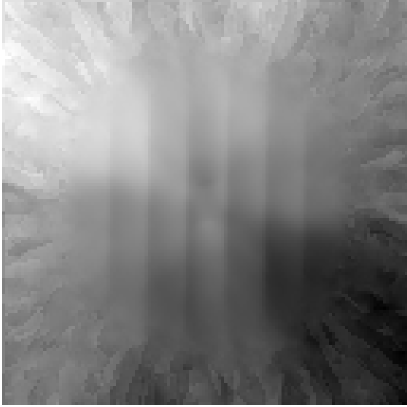
Although speckle interferometry can be considered by now a standard technique (Leinert 1994), no program for speckle data reduction was publicly available at the time this survey was started. Therefore we used our speckle program, which was already used for binary surveys in a number of other star-forming regions, e.g. Taurus-Auriga (Köhler & Leinert 1998), Scorpius-Centaurus (Köhler et al. 2000), and Chamaeleon (Köhler 2001). In this program, the modulus of the complex visibility (i.e. the Fourier transform of the object brightness distribution) is determined from power-spectrum analysis, the phase is computed using the Knox-Thompson algorithm (Knox & Thompson 1974) and from the bispectrum (Lohmann et al. 1983). Figure 1 shows examples of reconstructed complex visibilities. For a more detailed description see Köhler et al. (2000).
[MR81] H 14
 [MR81] H 15
CrA PMS 8
 RXJ1845.5-3750

RXJ1846.7-3636 NE
 RXJ1901.6-3644

RXJ1917.4-3756
 HR 7170
CrA PMS 4NW
RXJ1844.3-3541
RXJ1853.1-3609


If the object appeared unresolved, we computed the maximum brightness ratio of a companion that could be hidden in the noise of the data. The principle was to determine how far the data deviated from the nominal result for a point source (modulus, phase), and then to compute the maximum brightness ratio of a companion that would be compatible with this amount of deviation. This was repeated for different position angles, and the maximum was used as upper limit for the brightness ratio of an undetected companion. See Leinert et al. (1997a) for a more detailed description of this procedure.
If the complex visibility showed the fringe pattern typical of a binary, we computed a multidimensional least-squares fit using the amoeba algorithm (Press et al. 1992). Our program tried to minimize the difference between modulus and phase computed from a model binary and the observational data by varying the separation, position angle, and brightness ratio of the model. This was necessary because the reconstructed images are a complex function of the 2-dimensional separation vector and flux ratio that cannot be solved to compute the binary parameters directly from the data. Fits to different subsets of the data yielded an estimate for the standard deviation of the binary parameters. We then subtracted the contribution of the companion from the images and applied the procedure described in the previous paragraph to find limits for the brightness of an undetected companion.
| Designation | Date of | Filter | Separation | Position | Brightness | Remarks | ||||
| Observation | [] | Angle [∘] | Ratio | |||||||
| S CrA | 12 July 95 | K | 1.346 | 0.003 | 149.3 | 0.1 | 0.432 | 0.014 | known | |
| 6 July 01 | K | 1.330 | 0.004 | 150.5 | 0.2 | 0.401 | 0.016 | |||
| 6 July 01 | H | 1.340 | 0.009 | 150.7 | 0.3 | 0.356 | 0.012 | |||
| 6 July 01 | J | 1.334 | 0.003 | 150.3 | 0.2 | 0.380 | 0.011 | |||
| VV CrA | 12 July 95 | K | 2.082 | 0.003 | 43.5 | 0.1 | 0.515 | 0.004 | known | |
| 6 July 01 | K | 2.079 | 0.007 | 43.5 | 0.2 | 0.358 | 0.013 | |||
| 6 July 01 | H | 2.083 | 0.006 | 43.7 | 0.2 | 0.111 | 0.008 | |||
| 6 July 01 | J | 2.075 | 0.015 | 43.8 | 0.2 | 0.017 | 0.001 | |||
| CrAPMS 3 | 12 July 95 | K | 4.403 | 0.018 | 57.8 | 0.2 | 0.146 | 0.003 | known | |
| 4 July 01 | K | 4.442 | 0.003 | 57.5 | 0.2 | 0.151 | 0.005 | |||
| 4 July 01 | H | 4.452 | 0.007 | 57.5 | 0.2 | 0.125 | 0.005 | |||
| 4 July 01 | J | 4.455 | 0.009 | 57.4 | 0.2 | 0.106 | 0.005 | |||
| MR81 H 14 | 12 July 95 | K | 0.229 | 0.003 | 341.0 | 0.4 | 0.877 | 0.096 | ||
| 2 July 01 | K | 0.216 | 0.003 | 158.9 | 0.3 | 0.891 | 0.041 | |||
| 2 July 01 | H | 0.214 | 0.005 | 339.4 | 0.6 | 0.860 | 0.062 | |||
| 2 July 01 | J | 0.217 | 0.003 | 338.7 | 0.6 | 0.830 | 0.034 | |||
| MR81 H 15 | 6 July 01 | K | 0.220 | 0.022 | 278.1 | 2.8 | 0.57 | 0.285 | ||
| MR81 H 17 | 6 July 01 | K | 1.289 | 0.030 | 46.4 | 1.9 | 0.046 | 0.004 | ||
| CrAPMS 4 NW | 4 June 00 | K | 0.361 | 0.006 | 261.7 | 0.2 | 0.178 | 0.018 | ||
| CrAPMS 6 | 5 July 01 | K | 2.363 | 0.009 | 45.4 | 0.2 | 0.835 | 0.043 | known | |
| CrAPMS 8 | 2 July 01 | K | 0.132 | 0.009 | 110.4 | 4.3 | 0.70 | 0.300 | ||
| RXJ1844.3-3541 | 5 June 00 | K | 0.227 | 0.003 | 184.6 | 0.3 | 0.396 | 0.023 | ||
| RXJ1845.5-3750 | 5 June 00 | K | 0.904 | 0.003 | 38.8 | 0.2 | 0.602 | 0.007 | ||
| 6 July 01 | K | 0.886 | 0.006 | 38.6 | 0.2 | 0.542 | 0.039 | |||
| 6 July 01 | H | 0.898 | 0.004 | 38.5 | 0.2 | 0.568 | 0.027 | |||
| 6 July 01 | J | 0.891 | 0.003 | 38.5 | 0.4 | 0.508 | 0.060 | |||
| RXJ1846.7-3636 | NE-SW | 5. June 00 | K | 7.847 | 0.003 | 226.2 | 0.2 | 0.371 | 0.002 | |
| NE-SW | 4 July 01 | K | 7.840 | 0.011 | 226.0 | 0.2 | 0.442 | 0.021 | ||
| NE-SW | 4 July 01 | J | 7.863 | 0.050 | 226.0 | 1.0 | 0.454 | 0.003 | ||
| RXJ1846.7-3636 | NE AB | 5 June 00 | K | 0.171 | 0.004 | 96.6 | 0.3 | 0.577 | 0.031 | |
| NE AB | 4 July 01 | K | 0.171 | 0.003 | 99.9 | 0.3 | 0.680 | 0.013 | ||
| NE AB | 4 July 01 | J | 0.168 | 0.003 | 100.1 | 0.4 | 0.620 | 0.015 | ||
| RXJ1853.1-3609 | 5 June 00 | K | 0.516 | 0.006 | 88.7 | 0.6 | 0.518 | 0.036 | ||
| RXJ1856.6-3545 | 6 June 00 | K | 3.678 | 0.013 | 88.2 | 0.2 | 0.259 | 0.007 | ||
| 6 July 01 | K | 3.644 | 0.003 | 88.3 | 0.2 | 0.226 | 0.003 | |||
| 6 July 01 | H | 3.661 | 0.003 | 88.3 | 0.2 | 0.205 | 0.001 | |||
| 6 July 01 | J | 3.670 | 0.006 | 88.3 | 0.2 | 0.223 | 0.003 | |||
| RXJ1857.5-3732 | 2 July 01 | K | 2.861 | 0.003 | 281.8 | 0.2 | 0.516 | 0.011 | known | |
| RXJ1901.6-3644 | 6 June 00 | K | 0.942 | 0.003 | 45.8 | 0.2 | 0.458 | 0.010 | ||
| 6 July 01 | K | 0.931 | 0.003 | 45.3 | 0.4 | 0.463 | 0.009 | |||
| 6 July 01 | H | 0.935 | 0.014 | 45.9 | 0.6 | 0.469 | 0.020 | |||
| 6 July 01 | J | 0.941 | 0.012 | 46.2 | 0.5 | 0.478 | 0.018 | |||
| RXJ1917.4-3756 | 5 June 00 | K | 0.148 | 0.005 | 198.7 | 1.4 | 0.404 | 0.035 | ||
| 3 July 01 | K | 0.138 | 0.003 | 194.2 | 0.9 | 0.350 | 0.024 | |||
| HR 7170 | 1 July 01 | K | 0.073 | 0.027 | 98.6 | 13.4 | 0.30 | 0.153 | ||
| HD 176386 | 1 July 01 | K | 4.104 | 0.004 | 137.4 | 0.2 | 0.128 | 0.013 | known | |
To derive the exact pixel scale and orientation of the detector, we took images of fields in the Orion Trapezium and the Galactic center during the observing campaigns at the NTT. The instrumental positions of the stars in the Trapezium were compared with the coordinates given in McCaughrean & Stauffer (1994) by the astrometric software ASTROM111see http://www.starlink.rl.ac.uk/star/docs/sun5.htx/sun5.html. The pixel scale was in 1995 and in 2001. In 1995, the detector was rotated clockwise with respect to north on the sky, while it was rotated counterclockwise in 2001. We crosschecked the results with an astrometric calibration derived independently from images of the Galactic center (calibrated with Menten et al. 1997) and found that they agree within the uncertainties.
During the ADONIS observations in June 2000, Orion could not be observed during the night. Instead, we used images of fields near the Galactic center and positions given by Menten et al. (1997) for the astrometric calibration. The pixel scale was , and the detector was rotated clockwise.
3 Results
We have observed the sample of 49 stars listed in Table 2. Only a few known TTS members of CrA were not observed by us, namely the stars Patten R1c, R17c, and R13a, as well as the M6-8 objects LS-CrA 1 & 2, Denis1859, and CrA 432 & 444, all discovered after our runs. See Neuhäuser & Forbrich (2008) for a full up-to-date list of all optically visible young members of R CrA.
Of those 49 stars or systems, we now dismiss two ([MR 81] H 10 and Kn Anon 2) from the statistical analysis, because they are nonmembers (Neuhäuser et al. 2000). We also disregard RXJ1901.4-3422 from statistics, because it has a Hipparcos-measured distance of just ; i.e. it is a foreground young star, but not a member of R CrA (Neuhäuser et al. 2000). (We note that neither [MR 81] H 10 nor Kn Anon 2 nor RXJ1901.4-3422 was found to be multiple.) Then, the stars RXJ1846.7-3636 NW and SE are counted as two separate TTS, because their separation is about 8 arcsec, more than the outer limit we adopt to avoid contamination by chance alignments (see Sect. 3.2). Those two objects were observed in one single observation, both within the SHARP-I field-of-view. The stars CrAPMS 4 NW and SE are also two separate TTS, because their separation is about one arc minute. We are left with 47 separately counted R CrA member systems observed, seven Herbig Ae/Be stars, and 40 TTS. In this sample of 47 member systems observed, we find 19 binary stars.
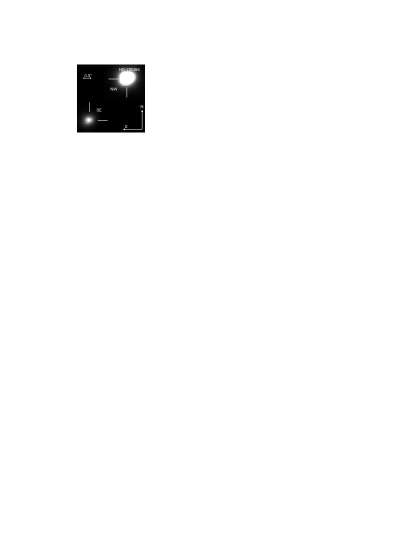
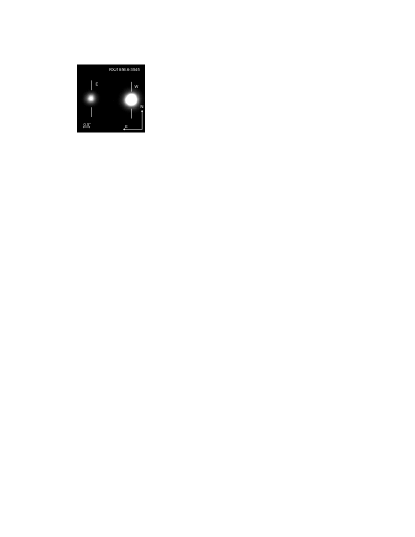
Results on separations, position angles (measured from N over E to S), and the corresponding flux ratios in the filters used are listed in Table 3 for all companions observed in this work, both previously known companions that we detected again and newly discovered companion candidates. The newly discovered binaries are shown in Figs. 1, 2, and 3. Figure 4 shows separation and brightness ratio of all companions.

3.1 Detection limits and completeness
The modulus of the complex visibility of a binary is a cosine-shaped function (Fig. 1). If the separation of the binary is equal to the diffraction limit ( for a telescope at K), exactly one period of the modulus of the visibility fits within the radius where the optical transfer function of the telescope is not zero. Under good circumstances, it is possible to discover binaries with even smaller separations, down to about half the diffraction limit.222We detected a close faint companion 0.073 arc sec east of HR 7170 (late B-type SB according to Wilson & Joy 1952), a projected separation of only 4 to 8 AU at the Hipparcos distance of pc.
However, in these cases we can only detect the first minimum, but not the second maximum of the modulus of the visibility. Therefore, we cannot distinguish a close binary star with certainty from an elongated structure. Even more important, we cannot be sure that we find all companions at separations less than the diffraction limit. For these reasons, we limit ourselves to companions in the separation range between and . The upper limit was chosen so that contamination with background stars has little effect (see Sect. 3.2 for a detailed discussion of this problem).
Figure 4 shows not only the stars where we find companions, but also the sensitivity of our survey, i. e. the maximum brightness ratio of a possible undetected companion as a function of the separation. This sensitivity depends on factors like the atmospheric conditions at the time of the observations and the brightness of the target star. We computed sensitivity limits for each star in our survey, both stars where we find a companion and stars where we do not find one. Fig. 4 shows the average sensitivity limit and the maximum of all limits, i.e. the envelope of the worst cases.
Only the data of a few stars are too noisy to allow detection of all companions down to magnitude differences to the primary of 2.5 mag (corresponding to a brightness ratio of 1:10). These stars are , , CrAPMS 8, and RXJ1855.1-3754. Based on the number of companions actually found, we expect less than 0.1 additional companions above a brightness ratio of 1:10 at separations . Therefore, we are confident we have found all companions with separations between and and with a magnitude difference of less than 2.5 mag.
3.2 Chance alignments with background stars
We observed most of our companion candidates only on one occasion; there is no way to tell from these data if two stars indeed form a gravitationally bound system or if they are simply two unrelated stars that happen to be close to each other projected onto the plane of the sky. To confirm companionship, we would need a 2nd-epoch image some time later to show that both objects are co-moving; or even better, one would have to find curvature in the orbital motion (see e.g. Neuhäuser et al. 2008). To estimate the number of chance projections, we used the 2MASS point source catalog (Skrutskie et al. 2006). Within the area of our survey (Right Ascension 279°…294°, Declination ), the catalog contains 26180 sources brighter than K=12 mag, the sensitivity limit of our imaging survey for close separations; 2MASS is complete down to about K mag. This corresponds to a surface density of 218 sources per square degree, or sources per square arcsecond. Therefore, within distance from one of our targets, we expect field stars. We conclude that we can safely assume that all the companions we find are indeed gravitationally bound to their primary.
4 Comparison with previous observations
Among the 40 TTS observed, we detected the five known binaries again and discovered 12 new binaries. TY CrA BC was outside the field-of-view of SHARP, and TY CrA D is too faint to be detected reliably, although we see some indication of binarity in our speckle data. There are no known multiples among the three TTS not observed by us. There are no known triples or higher order multiples among these 40 TTS.
We did not detect the companion to T CrA found in spectro-astrometric observations by Bailey (1998) and Takami et al. (2003). This companion was also not detected in the IR speckle observations of Ghez et al. (1997) and Leinert et al. (1997b). The companion is only detected through its effect in H, but Bailey (1998) reports that the width and displacement of the H line is inconsistent with emission nebulosity or an outflow. They conclude that T CrA is a binary, and suggest that the companion might have strong H emission, but is too faint in the K-band to be detected by speckle interferometry.
Among the 7 Herbig Ae/Be stars observed, we resolved HR 7170 (new) and HD 176386 (known, Dommanget & Nys 2002). Among all seven known Herbig Ae/Be stars in R CrA, there is one quadruple (TY CrA as eclipsing SB plus two resolved objects), one triple (HR 7170 as SB plus one new resolved companion discovered in this work), and four more binaries (HR 7169 and R CrA as SBs, T CrA and HD 176386 as resolved binaries)333The two SBs HR 7170 and HR 7169 form a common proper motion pair with only 13 arc sec separation, i.e. may form together a quintuple (including the newly resolved visual companion to HR 7170).. Hence, among a total of 50 member systems (43 TTS plus 7 Herbig Ae/Be stars), there are one quadruple, one triple, and 21 binaries, i.e. 23 multiples444Among the 13 newly discovered binaries, three are detected only by AO with ADONIS, stars not observed with SHARP I in speckle mode; five binaries are detected with both ADONIS and SHARP I speckle interferometry; five detected binaries were observed only with SHARP I speckle; among the new binaries found with SHARP I, five were detected only with speckle interferometry, not by simple shift+add imaging.. Since the triple system contains two, and the quadruple system three companions, there are 26 companion stars. In addition, among the five M6-8 type very low-mass stars and brown dwarfs known in R CrA, there are one to two binaries; however, we have left out the brown dwarfs and brown dwarf candidates in our statistics, because the brown dwarf completeness is very poor in CrA.
Given 23 multiples among 50 systems, we have a multiplicity fraction (number of multiples divided by number of systems) of . Counting all binaries within triples and quadruples, 26 companions in 50 systems give a companion-star frequency of . If we restrict these numbers to those systems observed in this work and to those companions within the completeness limits of this work (magnitude difference of lower than 2.5 mag for separations between 0.13 and 6 arc sec), we have 17 binaries among the 47 systems observed here, i.e. a percentage of . Since we do not find any triples or higher order multiples, the multiplicity and companion-star frequency are the same.
Since we have observed young CrA members both on the dark R CrA cloud and (new ROSAT TTS) around the cloud, we can also compare the multiplicity on-cloud with off-cloud: We have nine binaries among 30 on-cloud members (18:56 to 19:24 and to 36°), i.e. , and also eight binaries among 17 off-cloud new ROSAT TTS, i.e. . While the binaries percentage off-cloud is higher than on-cloud, there is no statistically significant difference.
We can now compare these numbers to other star-forming regions, which have been observed before with a similar technique and similar completness and sensitivity limits.
4.1 Comparison to Main-Sequence stars
The binary survey most commonly used for comparison is the work of Duquennoy & Mayor (1991, hereafter DM91), who studied a sample of 164 solar-type main-sequence stars in the solar neighborhood. They used spectroscopic observations, complemented by direct imaging; therefore they give the distribution of periods of the binaries. Before we can compare this to our results, we have to convert it into a distribution of projected separations. We follow the method described in Köhler (2001). In short, we simulate 10 million artificial binaries with orbital elements distributed according to DM91. Then we compute the fraction of those binaries that could have been detected by our observations, i.e. those having projected separations between and at the distance of CrA (130 pc). The result is that 38.4 binaries out of the DM91 sample of 164 systems fall into this separation range, which corresponds to a companion-star frequency of % (where the error is computed according to binomial statistics).
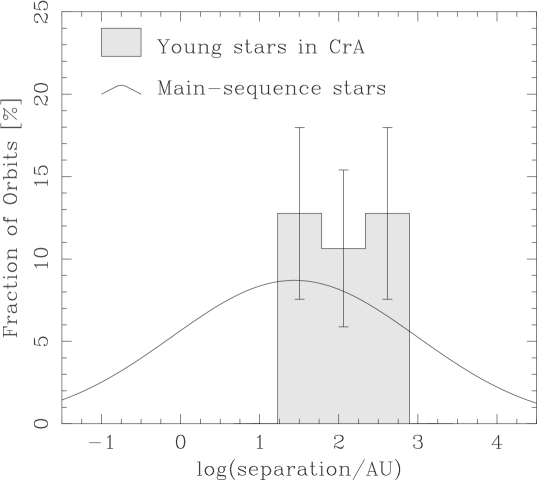
Among the 47 systems in CrA, we find 17 binaries, which corresponds to companions per 100 systems, more than among main-sequence stars. Thus, the companion-star frequency in our sample is higher by a factor of compared to main-sequence stars. Figure 5 shows the separation distribution of our sample and the sample of DM91. The overabundance of binaries in CrA is somewhat more pronounced for larger separations, which might indicate that the peak of the separation distribution is shifted to larger separations in CrA compared to main-sequence stars. However, due to the relatively small number of stars surveyed in CrA, this is not statistically significant.
The TTS observed in our study have spectral types from G5 to M6 with luminosity classes III and IV and with ages on the order of one to a few Myrs, so that they have masses between and 1.5 M⊙ according to Neuhäuser et al. (2000). These are somewhat lower masses than in the DM91 sample. Unfortunately, no multiplicity survey of M-dwarfs comparable in size to DM91 has been published. Reid & Gizis (1997) studied the largest sample so far, which contains 81 late K- or M-dwarfs. They find 22 companions in the separation range of our survey in CrA, which yields a companion-star frequency of . Within the errors, this is comparable to the companion-star frequency of DM91 in the same separation range (although the overall multiplicity found by Reid & Gizis (1997) is lower than in DM91). We conclude that the companion-star frequency in CrA is also higher than among main-sequence M-dwarfs, by a factor of .
If we assume that the separation distributions of our sample in CrA and the main-sequence sample of DM91 are the same, we can extrapolate the number of companions to all separations. Of DM91’s 101 companions, 38.4 fall on average into the separation range surveyed by us. This means that the extrapolation factor is 101/38.4, which yields a total companion-star frequency of about . This does not imply that 95 % of the stars in CrA are multiple, but only that the average number of companions per primary is about 0.95. Since, e.g., triple systems contain two companions and one primary, the fraction of multiples can be lower than 95 %. We do not know the ratio of binary to higher order multiples in CrA, therefore we have no way to extrapolate the total number of multiples.
| Region | Multiplicity | Companion-Star | relative | Separation | Ref. | Remarks | |
| (a) | Frequency | to DM91 | range [”] | ||||
| Tau-Aur | 0.13 – 13 | (1) | on-cloud | ||||
| Tau-Aur | 0.09 – 2.5 | (2) | on-cloud | ||||
| Tau-Aur | 0.13 – 13 | (3) | off-cloud | ||||
| Lupus | 0.10 – 12 | (4) | on-cloud | ||||
| Cha | 0.10 – 12 | (4) | on-cloud | ||||
| Cha | 0.13 – 6 | (5) | off-cloud | ||||
| Oph-Sco | 0.09 – 2.5 | (2) | on-cloud | ||||
| Oph | 0.13 – 6.4 | (6) | on-cloud | ||||
| Sco-Cen | 0.13 – 6 | (7) | off-cloud | ||||
| CrA | 0.13 - 6 | (8) | total | ||||
| CrA | 0.13 - 6 | (8) | on-cloud | ||||
| CrA | 0.13 - 6 | (8) | off-cloud |
4.2 Comparison to other star-forming regions
Table 4 lists the results of multiplicity surveys in several star-forming regions. Since the separation ranges where these surveys could detect companions are not always the same, it is not useful to compare the companion-star frequencies directly. Instead, it is standard practice to divide the companion-star frequency by the frequency of binaries among main-sequence stars (DM91) in the same separation range, and compare the resulting relative factors.
In most T- and OB-associations, the companion-star frequency is found to be significantly higher than among main-sequence stars, by factors of 1.5 – 2 or even more. CrA shows the same high number of binaries and multiples, with a factor of .
If the separations of all the binaries found in two surveys are published, it is possible to count the companions in the separation range common to both surveys and to compare the numbers directly. We did this with our survey in CrA and the survey in Taurus-Auriga by Leinert et al. (1993) and Köhler & Leinert (1998). The separation range in CrA (013 – 6′′) corresponds to 16.9 – 780 AU, or 012 – 557 at the distance of Taurus-Auriga. This range is fully covered by the survey of Leinert et al. (1993) and Köhler & Leinert (1998). They find 65 companions in this separation range, resulting in a companion-star frequency of . In CrA, we find , which is almost identical. We conclude that the companion-star frequency in CrA is as high as in similar star-forming regions.
5 Summary and conclusions
We found 13 new binaries among young stars in the R CrA association by simple speckle imaging, speckle interferometry, and AO imaging, all with 3.5–3.6 meter telescopes.
The companion found next to [MR 81] H 17 should be mentioned explicitely (Fig. 3): It has a brightness ratio of only between the faint NE component and the bright SW component (Table 3). The unresolved system (i.e. the bright component) has a spectral type of M3-5 (Patten 1998). Hence, the fainter object () may be a substellar companion or a so-called infrared companion (e.g. with edge-on circumstellar disk) or a background object. We continue to observe it in more detail (AO at larger telescopes and spectroscopy). All other companions found are almost certainly normal TTS.
Among eight known cTTS, there are only two binaries (), but among 28 known wTTS, there are 13 binaries found (). No mixed systems were found, but for most companions and even some primaries, its not known whether they are wTTS or cTTS. The system [MR 81] H 17 SW-NE may be mixed.
The multiplicity in CrA is high and not significantly different from other similar star-forming regions like Sco-Cen or Tau-Aur. The multiplicity among new ROSAT TTS around the dark cloud is high, just as it is in the case Tau-Aur. There is no significant difference between on-cloud TTS and off-cloud TTS in CrA, but a tendency to more binaries among the off-cloud TTS.
The multiplicity among the seven Herbig Ae/Be stars is high: one quadruple, one triple, and four binaries (from SBs to 6 arcsec separation). If going out to 13 arcsec separation, we would even have one quintuple. However, the sample of known Herbig Ae/Be stars in CrA is too small to compare to other regions. All triples and quadruples known in CrA are hierarchical.
For a comparison of the distribution of separations (or orbital periods) found here in CrA with those of nearby solar-type, main-sequence stars (DM91), see Fig. 5. We can extrapolate to the total companion-star frequency (at any separation) in CrA being , also similar to Sco-Cen and Tau-Aur.
Acknowledgements.
We thank the referee A. Brandeker for a thorough referee report. This research has made use of the SIMBAD database, operated at CDS, Strasbourg, France. This publication makes use of data products from the Two Micron All Sky Survey, which is a joint project of the University of Massachusetts and the Infrared Processing and Analysis Center/California Institute of Technology, funded by the National Aeronautics and Space Administration and the National Science Foundation.References
- Ageorges et al. (1997) Ageorges, N., Eckart, A., Monin, J.-L., & Menard, F. 1997, A&A, 326, 632
- Baier et al. (1985) Baier, G., Keller, E., Weigelt, G., Bastian, U., & Mundt, R. 1985, A&A, 153, 278
- Bailey (1998) Bailey, J. 1998, MNRAS, 301, 161
- Bouy et al. (2004) Bouy, H., Brandner, W., Martín, E. L., et al. 2004, A&A, 424, 213, astro-ph/0404576
- Casey et al. (1998) Casey, B. W., Mathieu, R. D., Vaz, L. P. R., Andersen, J., & Suntzeff, N. B. 1998, AJ, 115, 1617
- Chauvin et al. (2003) Chauvin, G., Lagrange, A.-M., Beust, H., et al. 2003, A&A, 406, L51, astro-ph/0304271
- Chelli et al. (1995) Chelli, A., Cruz-Gonzalez, I., & Reipurth, B. 1995, A&AS, 114, 135
- Dommanget & Nys (2002) Dommanget, J. & Nys, O. 2002, VizieR Online Data Catalog, 1269, 0, (CCDM)
- Duquennoy & Mayor (1991) Duquennoy, A. & Mayor, M. 1991, A&A, 248, 485, (DM91)
- Gaposchkin & Greenstein (1936) Gaposchkin, S. & Greenstein, J. L. 1936, Harvard College Observatory Bulletin, 904, 8
- Ghez et al. (1997) Ghez, A. M., McCarthy, D. W., Patience, J. L., & Beck, T. L. 1997, ApJ, 481, 378
- Ghez et al. (1993) Ghez, A. M., Neugebauer, G., & Matthews, K. 1993, AJ, 106, 2005
- Glass & Penston (1975) Glass, I. S. & Penston, M. V. 1975, MNRAS, 172, 227
- Herbig & Bell (1988) Herbig, G. H. & Bell, K. R. 1988, Third Catalog of Emission-Line Stars of the Orion Population (Lick Observatory Bulletin No. 1111, Santa Cruz: Lick Observatory)
- Hofmann et al. (1992) Hofmann, R., Blietz, M., Duhoux, P., et al. 1992, in Progress in Telescope and Instrumentation Technologies, ESO Conference and Workshop Proceedings No. 42, ed. M.-H. Ulrich (ESO Garching), 617
- James et al. (2006) James, D. J., Melo, C., Santos, N. C., & Bouvier, J. 2006, A&A, 446, 971, astro-ph/0510596
- Joy & van Biesbroeck (1944) Joy, A. H. & van Biesbroeck, G. 1944, PASP, 56, 123
- Knox & Thompson (1974) Knox, K. T. & Thompson, B. J. 1974, ApJ, 193, L45
- Köhler (2001) Köhler, R. 2001, AJ, 122, 3325, astro-ph/0109103v1
- Köhler et al. (2000) Köhler, R., Kunkel, M., Leinert, C., & Zinnecker, H. 2000, A&A, 356, 541
- Köhler & Leinert (1998) Köhler, R. & Leinert, C. 1998, A&A, 331, 977
- Leinert (1994) Leinert, C. 1994, in Lecture Notes in Physics, Berlin Springer Verlag, Vol. 431, Star Formation and Techniques in Infrared and mm-Wave Astronomy, ed. T. P. Ray & S. V. W. Beckwith, 215–283
- Leinert et al. (1997a) Leinert, C., Henry, T., Glindemann, A., & McCarthy, D. W. 1997a, A&A, 325, 159
- Leinert et al. (1997b) Leinert, C., Richichi, A., & M., H. 1997b, A&A, 318, 472
- Leinert et al. (1993) Leinert, C., Zinnecker, H., Weitzel, N., et al. 1993, A&A, 278, 129
- Lohmann et al. (1983) Lohmann, A. W., Weigelt, G., & Wirnitzer, B. 1983, Appl. Opt.,, 22, 4028
- Lopez Marti et al. (2005) Lopez Marti, B., Eislöffel, J., & Mundt, R. 2005, A&A, 444, L175
- Marraco & Rydgren (1981) Marraco, H. G. & Rydgren, A. E. 1981, AJ, 86, 62
- McCaughrean & Stauffer (1994) McCaughrean, M. J. & Stauffer, J. R. 1994, AJ, 108, 1382
- Menten et al. (1997) Menten, K. M., Reid, M. J., Eckart, A., & Genzel, R. 1997, ApJ, 475, l111
- Neuhäuser (1997) Neuhäuser, R. 1997, Science, 276, 1363
- Neuhäuser & Forbrich (2008) Neuhäuser, R. & Forbrich, J. 2008, in Handbook of Star Forming Regions, ed. B. Reipurth (Astronomical Society of the Pacific), in press
- Neuhäuser et al. (2008) Neuhäuser, R., Mugrauer, M., Seifahrt, A., Schmidt, T. O. B., & Vogt, N. 2008, A&A, 484, 281, astro-ph/0801.2287
- Neuhäuser et al. (2000) Neuhäuser, R., Walter, F. M., Covino, E., et al. 2000, A&A, 146, 323
- Patten (1998) Patten, B. M. 1998, in Astronomical Society of the Pacific Conference Series, Vol. 154, Cool Stars, Stellar Systems, and the Sun, ed. R. A. Donahue & J. A. Bookbinder, 1755
- Prato et al. (2003) Prato, L., Greene, T. P., & Simon, M. 2003, ApJ, 584, 853
- Press et al. (1992) Press, W. H., Teukolsky, S. A., Vetterling, W. T., & Flannery, B. P. 1992, Numerical recipes in C. The art of scientific computing, 2nd ed. (Cambridge: University Press)
- Proust et al. (1981) Proust, D., Ochsenbein, F., & Pettersen, B. R. 1981, A&AS, 44, 179
- Ratzka et al. (2005) Ratzka, T., Köhler, R., & Leinert, C. 2005, A&A, 437, 611, astro-ph/0504593
- Reid & Gizis (1997) Reid, I. N. & Gizis, J. E. 1997, AJ, 113, 2246
- Reipurth & Zinnecker (1993) Reipurth, B. & Zinnecker, H. 1993, A&A, 278, 81
- Skrutskie et al. (2006) Skrutskie, M. F., Cutri, R. M., Stiening, R., et al. 2006, AJ, 131, 1163
- Takami et al. (2003) Takami, M., Bailey, J., & Chrysostomou, A. 2003, A&A, 397, 675
- Walter et al. (1997) Walter, F. M., Vrba, F. J., Wolk, S. J., Mathieu, R. D., & Neuhäuser, R. 1997, AJ, 114, 1544
- Wilson & Joy (1952) Wilson, R. E. & Joy, A. H. 1952, ApJ, 115, 157
- Worley & Douglass (1997) Worley, C. E. & Douglass, G. G. 1997, A&AS, 125, 523