A decade of radio imaging the relativistic outflow in the peculiar X-ray binary Circinus X-1
Abstract
We present observations of the neutron star X-ray binary and relativistic jet source Circinus X-1 made at 4.8 and 8.6 GHz with the Australia Telescope Compact Array during a time interval of almost 10 years. The system shows significant variations in the morphology and brightness of the radio features on all timescales from days to years. Using the time delay between the successive brightening of the different components of the radio emission we were able to provide further evidence for the relativistic nature of the arcsec scale outflow, with an apparent velocity 12. No compelling evidence for an evolution of the orientation of the jet axis was found. We also place an upper limit on the proper motion of the system which is consistent with previous optical studies. Besides the previously reported radio flares close to the orbital phase 0.0 (interpreted as enhanced accretion at periastron passage), we also identified outbursts with similar properties near the orbital phase 0.5. The global spectral index revealed a preferentially steep spectrum over the entire period of monitoring with a mean value and standard deviation =-0.9 0.6 (), which became significantly flatter during the outbursts. Polarization was detected in one third of the epochs and in one case Faraday rotation close to the core of the system was measured.
keywords:
accretion, accretion discs – stars: individual: Circinus X-1 – ISM: jets and outflows – radio continuum: stars – radiation mechanisms: non-thermal – X-rays: stars.1 Introduction
Circinus X-1 is one of the most exotic X-ray binary systems. The detection of type I X-ray bursts (Tennant, Fabian & Shafer, 1986a, b) and twin kHz quasi-periodic oscillations in the X-ray power spectra (Boutloukos et al., 2006) strongly suggests that the compact object in the system is a neutron star. The nature of the companion star is more debatable: some evidence is pointing towards a low-mass object (Johnston et al., 1999), while other towards a high-mass one (Murdin et al., 1980; Jonker, Nelemans & Bassa, 2007). If the companion star is a supergiant, as recent evidence seems to suggest (Jonker et al., 2007), then this is at odds with the low magnetic field that must be present in the system (as inferred from type I X-ray bursts observations, for instance). Thus Circinus X-1 appears to be a very exotic system, harbouring a young neutron star with a low magnetic field.
Neutron star X-ray binaries (XRBs) are classified according to their X-ray spectral and timing properties as Z and Atoll sources. The Z class comprises seven objects accreting near the Eddington limit. All of them have been detected in the radio band and show variable emission at cm wavelengths. The Atoll type form the largest class of neutron star XRBs and have X-ray properties similar to black hole XRBs. Due to their systematic lower radio fluxes, one order of magnitude less radio loud than Z sources, only five of them have been detected in the radio band. The behaviour of Circinus X-1 is puzzling, exhibiting similarities with Z sources (e.g. Shirey, Bradt & Levine 1999), but at times showing characteristics reminiscent of Atoll sources (Oosterbroek et al., 1995). The orbit of the binary system probably has a relatively high eccentricity (e 0.4-0.9) that produces variations in the accretion rate on the compact object (Murdin et al., 1980; Nicolson, Glass & Feast, 1980; Tauris et al., 1999; Jonker, Nelemans & Bassa, 2007). This offers an explanation for the periodic flares (P16.6 d) observed in X-ray (Kaluzienski et al., 1976), infrared (Glass, 1978, 1994) and radio (Whelan et al., 1977; Haynes et al., 1978), which are interpreted as enhanced accretion near the periastron passage.
Circinus X-1 is associated with an arcmin scale synchrotron nebula (Haynes et al., 1986; Stewart et al., 1993) which is probably powered by the jet originating close to the binary system (Heinz, 2002; Tudose et al., 2006). The jet is observed in radio at arcmin as well as arcsec scales and was recently detected in X-ray band by Chandra (Heinz et al. 2007; Soleri et al. 2008). Observations at cm wavelengths offered evidence for the presence of a relativistic outflow aligned very close to the line of sight (Fender et al., 2004). However, X-ray (Schulz et al., 2008; Iaria et al., 2008) and optical (Jonker et al., 2007) spectroscopy seem to favour a significantly higher angle between the jet axis and the line of sight.
Besides the flux modulation at the orbital period, Circinus X-1 also exhibits ‘secular’ changes, documented in X-ray and radio. The ASM/RXTE (All Sky Monitor/Rossi X-ray Timing Explorer) light curve (2-10 keV) shows that after a quasi-constant X-ray output, the flux decreased starting from 2000 up to now by one order of magnitude (Fig. 1, left, bottom panel). The picture is even more dramatic in radio. In the 1970s-1980s the radio flares reached up to 1 Jy (e.g. Whelan et al. 1977; Haynes et al. 1978), then they were detected at mJy level only (Stewart et al., 1991; Fender, 1997; Fender et al., 1998), until recently when a relatively increased radio activity from Circinus X-1 was noticed (Fender, Tzioumis & Tudose, 2005; Nicolson, 2007; Deller et al., 2007). This offered the opportunity to obtain new VLBI (Very Large Baseline Interferometry) observations of the system within the framework of the first Southern e-VLBI (electronic VLBI) experiment (Phillips et al., 2007), after almost 25 years since the last successful VLBI observations (Preston et al., 1983).
2 Observations
We have observed the X-ray binary Circinus X-1 during a time interval of almost 10 years, between 1996 and 2006, simultaneously at 4.8 and 8.6 GHz with the Australia Telescope Compact Array (ATCA). As primary calibrators we used PKS J0825-5010 (PKS B0823-500) for epochs 15 and 37 (see Table 1) and PKS J1939-6342 (PKS B1934-638) for the rest. PMN J1524-5903 (B1520-58) was used as secondary calibrator for the entire data set. Its positional uncertainty is, according to the ATCA calibrator catalog, between 100 and 250 mas. Throughout the paper we assumed conservatively the above upper limit as the systematic error in our determinations of positions. Standard calibration techniques were applied using the software MIRIAD (Sault, Teuben & Wright, 1995).
The observations were carried out at different spatial resolutions, although very similar (see the array configuration column in Table 1 and the ATCA website111http://www.narrabri.atnf.csiro.au/observing/configs.html). To aid an homogeneous analysis, in obtaining the final radio images we have used the same restoring beams (size and orientation) for the entire data set at each of the two observed frequencies, for each weighting scheme, natural and uniform. The size of these beams is in general less than 5 percent different than the sizes of the default synthesized beams. The exceptions are the observations from epoch 14 when the difference was up to 40 percents (array configuration 1.5D) and most of the observations from 1996 July for which the default synthesized beams were very elongated due to the short observational runs. Because of this limitation the radio images from the 1996 July epochs 3-7, 9 and 10 are very likely to contain artifacts. However, we note that the calibration process was successful and the uv data should not be significantly affected. The only special case is epoch 10, for which the phase-referencing calibration was only partially successful, but we are including it in the analysis for completeness.
The flux density within a run varied sometimes by up to 30 percent. In general the variations were smooth over the duration of the observing sessions and tests made by selecting only parts of the data showed that the maps are not affected significantly by this behaviour. However, when a radio flare happened during an observational run the flux density changed by almost a factor 2 on timescales of hours. In these few cases artifacts could be present in the radio maps (see section 3, paragraph 4).
As mentioned in the previous section, Circinus X-1 periodically flares at radio wavelengths. We used the ephemeris derived from the onset times of 21 well observed such outbursts spanning the past 28 years (Nicolson, 2007) to illustrate in Fig. 2 the orbital phase coverage of our observations. During the 10 years of data we have swept the entire orbit of the system, even though more often than not only once for a given orbital phase, and gaps in the coverage are present.
| Epoch | Date | Array config. | MJD beginning | Total time [h] | Orbital phase | [mJy] | [mJy] |
|---|---|---|---|---|---|---|---|
| 1 | 1996 July 01 | 6C | 50265.282 | 11.5 | 0.102 - 0.131 | 30.8 7.0 | 24.6 5.0 |
| 2 | 1996 July 02 | 6C | 50266.291 | 8.4 | 0.163 - 0.184 | 31.5 6.4 | 26.6 5.1 |
| 3 | 1996 July 03 | 6C | 50267.275 | 0.8 | 0.223 - 0.225 | 23.2 5.3 | 24.1 5.7 |
| 4 | 1996 July 04 | 6C | 50268.276 | 0.8 | 0.283 - 0.285 | 23.7 5.6 | 22.7 5.0 |
| 5 | 1996 July 05 | 6C | 50269.252 | 1.2 | 0.342 - 0.345 | 14.9 3.3 | 10.6 2.5 |
| 6 | 1996 July 07 | 6C | 50271.247 | 1.2 | 0.463 - 0.466 | 5.9 1.5 | 3.9 0.8 |
| 7 | 1996 July 08 | 6C | 50272.249 | 0.8 | 0.523 - 0.525 | 6.8 1.8 | 5.9 1.2 |
| 8 | 1996 July 09 | 6C | 50273.187 | 4.4 | 0.580 - 0.591 | 9.4 1.9 | 8.5 1.3 |
| 9 | 1996 July 10 | 6C | 50274.267 | 1.2 | 0.645 - 0.648 | 21.9 4.9 | 19.4 4.0 |
| 10 | 1996 July 13 | 6C | 50277.172 | 0.8 | 0.821 - 0.823 | 8.2 2.0 | 4.7 1.1 |
| 11 | 1998 February 05/06 | 6A | 50849.573 | 12.3 | 0.424 - 0.455 | 9.2 1.6 | 6.8 0.8 |
| 12 | 1998 February 23/24 | 6B | 50867.555 | 12.3 | 0.512 - 0.543 | 10.8 1.7 | 7.4 0.9 |
| 13 | 1998 October 03/04 | 6A | 51089.883 | 13.1 | 0.954 - 0.987 | 7.5 1.0 | 4.0 0.4 |
| 14 | 1998 October 16/17 | 1.5D | 51102.829 | 9.2 | 0.736 - 0.759 | 6.0 0.9 | 3.9 0.3 |
| 15 | 1998 October 29/30 | 6D | 51115.810 | 7.6 | 0.521 - 0.540 | 7.9 1.3 | 4.1 0.6 |
| 16 | 1998 November 02 | 6D | 51119.100 | 7.6 | 0.720 - 0.739 | 5.0 0.7 | 2.8 0.2 |
| 17 | 2000 February 05/06 | 6A | 51579.647 | 12.7 | 0.568 - 0.600 | 16.2 2.2 | 8.9 0.9 |
| 18 | 2000 October 01 | 6A | 51818.081 | 8.8 | 0.987 - 0.009 | 21.1 1.9 | 9.2 0.6 |
| 19 | 2000 October 07/08 | 6A | 51824.875 | 4.0 | 0.398 - 0.408 | 18.1 2.2 | 8.3 0.7 |
| 20 | 2000 October 09/10 | 6A | 51826.950 | 11.5 | 0.524 - 0.553 | 20.0 2.5 | 10.4 0.8 |
| 21 | 2000 October 14/15 | 6A | 51831.998 | 10.0 | 0.829 - 0.854 | 27.4 3.3 | 14.5 1.2 |
| 22 | 2000 October 19 | 6C | 51836.067 | 8.8 | 0.075 - 0.097 | 34.1 3.9 | 21.0 1.5 |
| 23 | 2000 October 20/21 | 6C | 51837.922 | 11.5 | 0.187 - 0.216 | 30.9 4.2 | 18.7 1.9 |
| 24 | 2000 October 23 | 6C | 51840.185 | 6.4 | 0.324 - 0.340 | 25.1 2.8 | 14.2 1.0 |
| 25 | 2000 October 25/26 | 6C | 51842.909 | 11.5 | 0.489 - 0.518 | 24.4 3.0 | 13.9 1.0 |
| 26 | 2001 May 23 | 6F | 52052.277 | 10.7 | 0.151 - 0.178 | 19.2 2.5 | 12.6 1.1 |
| 27 | 2001 May 25 | 6F | 52054.230 | 9.2 | 0.269 - 0.292 | 14.6 1.9 | 9.5 0.7 |
| 28 | 2001 May 27 | 6F | 52056.235 | 9.2 | 0.390 - 0.413 | 16.9 1.9 | 10.0 0.7 |
| 29 | 2001 May 29 | 6F | 52058.219 | 10.0 | 0.510 - 0.535 | 15.7 2.0 | 9.6 0.7 |
| 30 | 2001 September 08 | 6B | 52160.190 | 6.4 | 0.677 - 0.693 | 9.3 0.8 | 4.0 0.3 |
| 31 | 2002 December 02/03 | 6A | 52610.795 | 11.5 | 0.933 - 0.962 | 3.3 0.2 | 0.7 0.1 |
| 32 | 2002 December 03/04 | 6A | 52611.813 | 11.9 | 0.994 - 0.024 | 3.7 0.2 | 1.7 0.1 |
| 33 | 2002 December 04/05 | 6A | 52612.848 | 11.5 | 0.057 - 0.086 | 14.9 1.4 | 15.2 1.8 |
| 34 | 2002 December 05/06 | 6A | 52613.850 | 11.9 | 0.117 - 0.147 | 11.7 1.9 | 6.8 1.1 |
| 35 | 2002 December 06/07 | 6A | 52614.813 | 12.3 | 0.176 - 0.207 | 6.9 0.9 | 3.7 0.5 |
| 36 | 2002 December 07/08 | 6A | 52615.811 | 11.5 | 0.236 - 0.265 | 4.3 0.4 | 1.8 0.1 |
| 37 | 2002 December 08/09 | 6A | 52616.822 | 10.0 | 0.297 - 0.322 | 2.8 0.3 | 0.9 0.1 |
| 38 | 2003 December 23/24 | 6A | 52996.829 | 11.5 | 0.285 - 0.313 | 1.7 0.2 | 0.4 0.1 |
| 39 | 2005 April 06 | 6A | 53466.476 | 11.5 | 0.699 - 0.727 | 1.4 0.1 | 0.12 (3 ) |
| 40 | 2005 June 17 | 6B | 53538.266 | 11.5 | 0.043 - 0.071 | 42.8 8.0 | 40.0 7.7 |
| 41 | 2006 March 22/23 | 6C | 53816.562 | 11.5 | 0.882 - 0.910 | 0.09 (1.4 ) | 0.08 (1.6 ) |
3 “Secular” evolution
Fig. 1 shows the “secular” light curves of Circinus X-1 in radio and X-ray, between 1996-2006. The averaged X-ray output in the 2-10 keV band was constant around 75 counts s-1 ( 1 Crab) up to the beginning of 2000 when it started to decrease relatively fast reaching only a few tens of counts s-1 by the end of 2003. The radio fluxes plotted (presented in columns 6 and 7 of Table 1) are determined in the image-plane and are total flux densities, in the sense that contain both the contribution of the core and other radio emitting regions (jet features, knots) associated with the system. The radio data offer a totally different picture than in the 1970-1980s when the flares usually reached flux density levels of up to 1 Jy. From 1996 till 2006 the outbursts only peaked at a few tens of mJy. Admittedly, we only observed a few times close to the orbital phase 0.0, but the flux densities measured at other phases further support the evidence that indeed dramatic changes took place in the system since the 1980s. The true nature of these changes is unclear.
At a shorter temporal scale, whether the decrease in the X-ray output observed starting with 2000 can be correlated with a change in the radio behaviour is hard to assess with confidence. On the one hand it does seem that the radio flux density levels became lower by comparison with those observed at similar orbital phases before, however the limited number of observations cannot exclude the possibility of this being an observational bias. On the other hand the flare observed on 2005 June 17 (epoch 40, Table 1) had the highest flux densities in the whole data set, although this might just as well be associated with an increase in the radio activity of Circinus X-1 as was observed in the last few years (Fender et al., 2005; Nicolson, 2007; Deller et al., 2007).
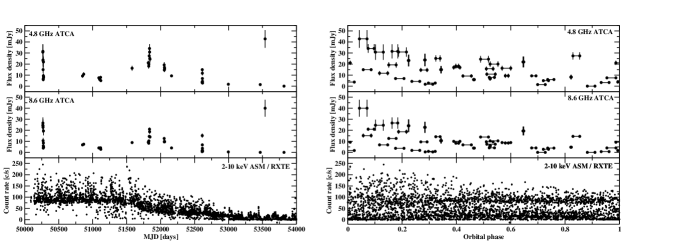
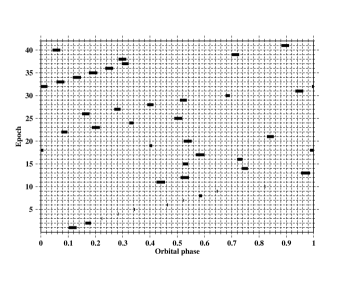
Fig. 3 and Fig. 4 present the radio images of Circinus X-1 at 4.8 and 8.6 GHz. In most of the images a jet-like structure is evident towards SE. This is interpreted as the approaching jet in a system (a microquasar; e.g. Mirabel & Rodríguez 1999) in which the ejection of matter is along a direction close to the line of sight (e.g. Fender et al. 1998, 2004). This arcsec scale jet has roughly the same position angle as the observed arcmin scale jet (e.g. Stewart et al. 1993) and might constitute part of the channel through which the energy is transferred from the core to the radio nebula (Tudose et al., 2006). In the same frame-work of the microquasar interpretation, at a few epochs (e.g. 23, 25, 28) the receding jet was identified as the excess of emission towards NW.
Some of the observations close to phase 0.0 (images A,B - 18, 22, 32, 33 , 40 in Fig. 3 and Fig. 4) show a significant different orientation of the jet axis than the “normal” NW-SE direction. This is very likely an artifact, resulting from variability of the source during the aperture synthesis. Test maps made in these cases with uv-plane selected data outside the instants of the outbursts, show that the radio emission has a NW-SE orientation. In order to accommodate the radio observations, which require a small angle between the jet axis and the line of sight (Fender et al., 2004), with the optical and X-ray data, which prefer a larger angle between the two (Jonker et al., 2007; Schulz et al., 2008; Iaria et al., 2008), it was suggested (Iaria et al., 2008) that the jet is precessing. Although the data analyzed here cannot entirely rule out this possibility, we did not find any unequivocal evidence for significant changes in the orientation of the jet axis with respect to the line of sight.
The radio images between 1996-2006 reveal a system in which the variations in the morphology and brightness of the radio features are characterized by timescales of days. Individual, well defined emitting regions are seen sometimes as far as 10 arcsec from the core (0.05 pc, with the distance to Circinus X-1 expressed in kpc), along a NW-SE direction (e.g. images A - 35, 39). Unfortunately, the limited amount of data (mainly the lack of enough closely spaced observations) and the magnitude of the systematic errors didn’t allow a confident measurement of the proper motion of the various features.
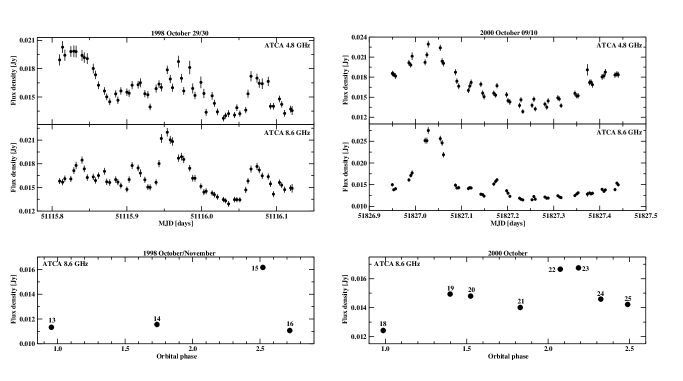
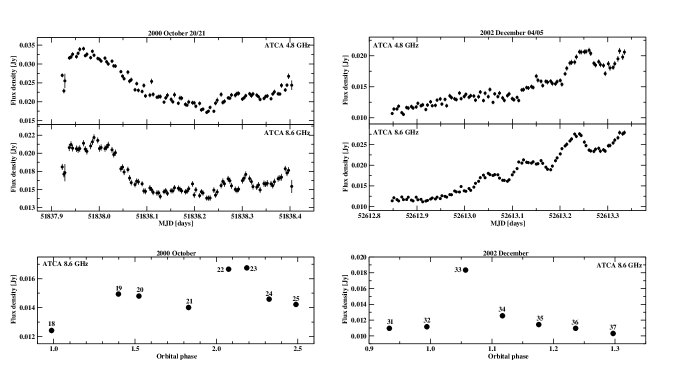
In addition to the usual radio flares close to the orbital phase 0.0, we have identified outbursts also near the orbital phase 0.5 at epochs 15 and 20 (Fig. 5). Strong evidence for similar outbursts was also present at epochs 8, 11 and 25. This has been noted just once previously in the literature (Fender, 1997). As is often the case for the flares close to the orbital phase 0.0, these outbursts also seem to appear preferentially as a series of flares, with a time separation of a few hours. Their relative amplitudes look similar, independent of their association with the periastron or apastron passage (Figs. 5, 6). We stress that according to the ephemeris used (Nicolson, 2007), orbital phase 0.0 (which is interpreted as periastron passage) corresponds to the moment of the onset, not peak, of the flare. Although given the orbital coverage we cannot totally rule out observational biases (i.e. flares at other orbital phases), from our sample we can conclude that all the flaring events were associated with the orbital phases 0.0 and 0.5 (within a region of 0.1 in phase) and that this correlation suggests the existence of a causal relation between the increase in flux density and these particular positions along the orbit.
As remarked before, the outbursts near orbital phase 0.0 are interpreted as episodes of enhanced accretion at the periastron passage (Murdin et al., 1980). The accreting material is provided via Roche lobe overflow and wind accretion from the massive star (if indeed the companion is a supergiant as suggested by Murdin et al. 1980 and more recently by Jonker et al. 2007). The explanation for the radio flares close to the orbital phase 0.5 is less clear. We suggest that the wind accretion is responsible for producing them. The wind accretion rate is given by (e.g. Bondi & Hoyle 1944):
| (1) |
where is the gravitational constant, is the mass of the compact object, is the density of the stellar wind and is the relative velocity between the compact object and the stellar wind. In an eccentric binary system, assuming homogeneous wind, the accretion rate has two peaks: one near the periastron, the other where the decrease in the relative velocity overcompensates for the decrease in the density of the wind. The exact position and width of this second maximum depend on the properties of the system, notably on the characteristics of the stellar wind (e.g. Martí & Paredes 1995). In this frame-work the multiple flaring components observed during an outburst can naturally be explained by invoking inhomogeneities present in the wind. However, given the uncertainties in the parameters characterizing the system, a more quantitative test of the hypothesis is not viable at the present time. Alternatively, the flares close to the orbital phase 0.5 might be related to the disc settling down into another increased accretion rate state after a period of reduced or suppressed accretion or settling down into a radio-loud state after a radio-quiet one (cf. black holes; e.g. Fender 2006).


In order to provide a more quantitative record of the evolution of Circinus X-1 over the period 1996-2006 we have fitted the data in the image-plane using the task IMFIT in MIRIAD. The number of components (admittedly subjective) used in the fitting process varied between one and three, according to the appearance of the radio images. As a general rule, a new component was added to the fitting only in the case the residual map (obtained by subtracting the model map from the original, CLEAN-ed map) was showing compact emission at more than 3 level. All the components were refitted then simultaneously. The results are presented in Appendix A and Figures 3 and 4. To check the reliability of the image-plane fittings, we have also performed uv-plane fittings of the data at 8.6 GHz using the software DIFMAP. The two different approaches gave similar results, within the errors.
4 Ultra-relativistic outflow
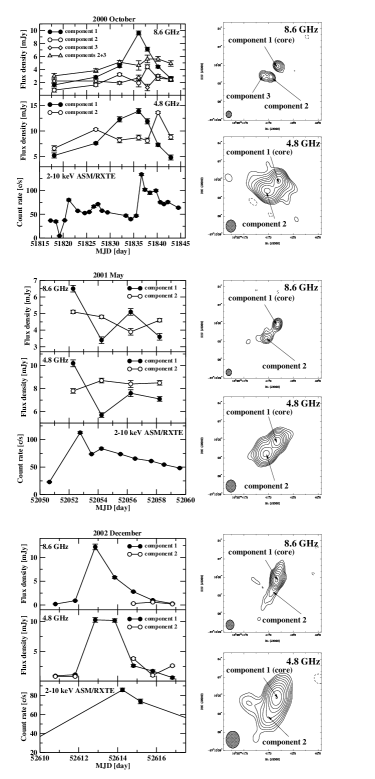
Using a sub-sample of our data at 4.8 GHz, Fender et al. (2004) found evidence for an underlying relativistic flow in the arcsec scale jet of Circinus X-1. We have reanalyzed their data set in this context, taking also into account the simultaneous 8.6 GHz data. Only the observations made in 2000 October, 2001 May and 2002 December were suitable for such a study due to their dense temporal coverage (see Table 1). These are the same data presented in Fender et al. (2004). The 1996 July subset was disqualified because of the many short individual observations and the likely artifacts that might be thus generated in the images. For each of the three subsets mentioned the data were selected such as to ensure a quasi-identical uv-plane coverage for the observations. For 2000 October and 2001 May we used for the image-plane fitting uniformly weighted radio maps since they revealed with a higher spatial resolution the structure of the radio emission. For 2002 December this was not possible because on many epochs Circinus X-1 was too weak and so we used the naturally weighted radio maps instead. The data from epoch 19 (2000 October 7/8) were not included in the analysis as a consequence of the limited common uv-plane coverage with the other observations from the same month. On a few epochs in 2002 December, the component 2 was not detected or it was impossible to identify with certainty. The approximate location of the components fitted to the data is indicated in Fig. 7 along with the corresponding light curves. Assuming that the peaks of the flux density of component 1 (the core) and component 2 observed at timescales of days are causally related (see for instance Fig. 8 showing the successive variations in the relative brightness of the different features of the radio emission) then the radio brightening of the core and of the knots further away appear to happen with a delay of days. The X-ray burst peaks in the same time interval and at least for some events evidence is mounting that the radio and X-ray outputs are correlated (Soleri et al., 2007). This phenomenology can be interpreted as evidence for a flow propagating outward from the core. If that is the case, then the outflow is indeed relativistic in Circinus X-1. The apparent velocity of the outflow in the plane of the sky can be expressed as:
| (2) |
where is the speed of light, is the angular distance traveled by the flow in the time interval and is the distance to Circinus X-1. Allowing for different possible identifications of the succession of the peaks of the flux densities, estimations of the apparent velocity of the outflow can be made (Table 2). The formal error in column 5 of Table 2 is up to 30 percent. The most confident results are obtained for 2000 October, when relatively more observations are available and the identification of the peaks in the light curves is more evident. A minimum apparent velocity of around seems to be favoured by this data. The other two data subsets tend to suggest a slightly higher value. Even though the apparent velocities of the outflow might have different values during different outburst events, it is likely that this interval of variation cannot be very large. In conclusion, given the limited amount of information that could be extracted from the data, we consider that there is enough circumstantial evidence that a minimum apparent velocity of around 3 1 can be confidently assigned to the outflow in Circinus X-1. For a distance between 4 and 10.5 (e.g. Jonker & Nelemans 2004; Iaria et al. 2005) this confirms the status of Circinus X-1 as harbouring the most relativistic outflow discovered so far in the Milky Way (Fender et al., 2004), with .

| Leading peak | Following peak | t | ||
|---|---|---|---|---|
| [MJD] | [MJD] | [arcsec] | [day] | [kpc-1] |
| 2000 October | ||||
| 51836.067 | 51837.922 | 2.3 | 1.86 | 7.2 |
| 51836.067 | 51840.185 | 2.3 | 4.12 | 3.2 |
| 2001 May | ||||
| 52052.277 | 52054.230 | 2.85 | 1.95 | 8.5 |
| 52052.277 | 52058.219 | 2.85 | 5.94 | 2.8 |
| 52056.235 | 52058.219 | 2.85 | 1.98 | 8.4 |
| 2002 December | ||||
| 52612.848 | 52614.813 | 3.6 | 1.96 | 10.6 |
| 52612.848 | 52616.822 | 3.6 | 3.97 | 5.3 |
| 52613.850 | 52614.813 | 3.6 | 0.96 | 21.7 |
| 52613.850 | 52616.822 | 3.6 | 2.97 | 7.0 |
5 System proper motion
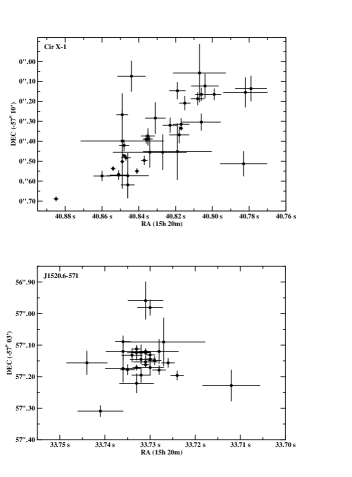
Circinus X-1 complex is on the plane of the sky just 10 arcmin away from the boundary of the supernova remnant SNR G321.9-0.3. This offered circumstantial evidence for the so called “runaway binary” scenario in which the binary system and the supernova remnant are physically associated (Clark, Parkinson & Caswell, 1975). However, optical observations taken 8.6 years apart (Mignani et al., 2002) placed a 3 upper limit to the proper motion of the source of 5 mas yr-1, much less than the expected value between 15 and 75 mas yr-1 predicted by the “runaway binary” hypothesis.
In Fig. 9 (top) we plot the positions of the core of Circinus X-1 between 1996-2006 as determined from the 8.6 GHz data. The observations from epoch 10 were excluded from the sample due to the phase-referencing problems encountered in calibrating this particular data set, which resulted in unaccountable errors in the position of the object, as can be actually clearly seen in the radio maps not only at 8.6, but also 4.8 GHz (Figs. 3 and 4, images A10 and B10). The diagram shows an apparent tendency of the points to align along a NW-SE direction (this tendency is also observed at 4.8 GHz). However, the position of the object “jumps” randomly from one epoch to another, with no preferential direction. To test if this could be explained by errors in the phase-referencing process, we used a compact source 7 away from Circinus X-1, designated J1520.6-571 by Fender et al. (1998) which was observed during the runs starting with epoch 11. After phase-referencing it with respect to PMN J1524-5903 we fitted the data in the image plane. The resulting positions are reported in Fig. 9 (bottom). The lack in this case of a similar trend in the distribution of positions as observed for Circinus X-1 strongly suggests that the phase-referencing process is not responsible for the tendency (or, more conservatively, is not the dominant factor). Instead, given the magnitude of the errors and the fact that the bulk of the radio emission in Circinus X-1 is oriented on a NW-SE direction (the jet axis), it is very likely that this tendency is an artifact of the fitting process, due to different jet structures at different epochs. Therefore, our roughly estimated upper limit to the proper motion of Circinus X-1 of 50 mas yr-1 is extremely conservative. This nevertheless places an independent constraint on the velocity of the system in the plane of the sky of 240 km s-1, where is the distance to Circinus X-1 expressed in kpc.
The errors in the position of the core are dominated at most of the epochs by the positional error of the phase-referencing calibrator (the exact value of which being unknown and assumed here to be the upper limit quoted in the catalog; see section 2). Future long-term observations of Circinus X-1 combined with a better knowledge of the systematic errors due to the calibrator will enable to further constrain the proper motion down to, and ultimately even better than the presently available optical limits.
6 Spectrum
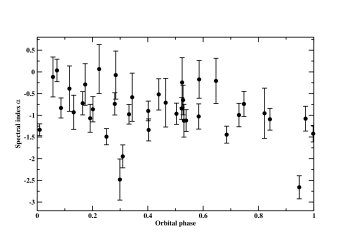
The global spectral index of Circinus X-1, determined between 4.8 and 8.6 GHz, over the 10 years period of observations shows preferentially a steep spectrum with mean value and standard deviation (characterizing the scatter over the entire observed period) (Fig. 10). This is, unsurprisingly, indicative of optically thin synchrotron emission.
In the observational runs in which flares were detected, clear evidence was found, both close to orbital phases 0.0 and 0.5, for a significant flattening of the spectrum during these outbursts. This behaviour is due to the fact that the flux density peaks first at 8.6 GHz, then at 4.8 GHz. The time lag is of the order of a few hours (see Figs. 5 and 6). The peak flux density is higher at 8.6 GHz than at 4.8 GHz (however see epoch 23 in Fig. 6). Such phenomenology was pointed out before, notably by Haynes et al. (1978).
These properties of the flares are roughly consistent both with a model in which the synchrotron radiation is produced in a cloud of relativistic particles expanding adiabatically (van der Laan, 1966; Haynes et al., 1980), and with the internal shock model, in which the particles are accelerated in successive shocks produced in a quasi-continuous jet (Kaiser, Sunyaev & Spruit, 2000; Vadawale et al., 2003; Fender, Belloni & Gallo, 2004). The data do not clearly rule out either of the two. Free-free absorption in the wind of the companion might also be at work in the system thus complicating any attempt to an interpretation at the moment.
7 Polarization properties
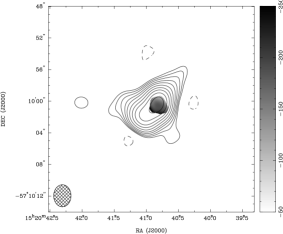
Polarization was detected at more than 3 confidence level on 13 epochs at 4.8 GHz and 1 epoch at 8.6 GHz. Faraday rotation (i.e. rotation of the plane of polarization due to the propagation of radiation through magnetized plasma) was observed on epoch 21 at a level of -175 30 rad m-1 (Fig. 11). A less confident detection ( 3 ), consistent with the previous one, was made on epoch 22. We warn the reader that N ambiguities might be affecting the calculations, especially since only 2 frequencies were available. The compact source J1520.6-571 located 7’ away from Circinus X-1 (see section 5) is also polarized. Its Faraday rotation measure is +185 30 rad m-1. Since these two objects are so close on the plane of the sky, although the exact galactic or extragalactic nature of J1520.6-571 is not known, it is reasonable to assume that the galactic contribution to the detected Faraday rotation is about the same in both cases. Then, given the opposite sign of the rotation measure values observed in the two sources, the conclusion is that the galactic contribution has to be small in absolute value, of the order of a few tens of rad m-1. Otherwise the intrinsic Faraday rotation measure (i.e. due to the immediate environment of the objects) would have to be fairly large for one or the other of the sources. Another hint suggesting a low galactic Faraday rotation measure towards Circinus X-1 comes from the attempts to mapping the whole sky. Containing around 800 reliable Faraday rotation measure, the map of Johnston-Hollitt, Hollitt & Ekers (2004) seems to favour a small in absolute value, likely negative rotation measure towards Circinus X-1 (galactic coordinates: l=32212; b=+004). We can therefore tentatively estimate that the galactic Faraday rotation measure in the direction of Circinus X-1 is probably somewhere between -50 and 50 rad m-1. If this is true, it means that most of the rotation measure in Fig. 11 is likely intrinsic, originating in a Faraday screen in the vicinity of the object.
The polarization maps are shown in Fig. 12. Assuming a -50 / +50 rad m-1 Faraday rotation measure within the galaxy, the electric vector position angles in Fig. 12 have to be corrected by rotating them counter-clockwise / clockwise by 11°at 4.8 GHz and 35 at 8.6 GHz. For an optically thin emitting region (as it is the case; see section 6) the magnetic field vectors are practically perpendicular to the electric field vectors. Although it is difficult to make strong statements, in the jet the electric field vectors seem to be oriented preferentially along its axis (e.g. maps C - 12, 17, 22, 23 in Fig. 12) thus suggesting the presence of shocks at the interface between the ejected matter and the surrounding environment, while close to the core the electric vectors tend to be oriented perpendicular to the jet axis. Moreover, the orientation of the electric vectors position angles seems to be stable over the almost 10 year period covered by the observations. The fractional linear polarization is of the order of a few percents.

8 Conclusions
We have presented ATCA radio data of the XRB Circinus X-1 at 4.8 and 8.6 GHz covering a period of time of almost 10 years. The radio maps reveal a complex structure of the radio emission with variations in the morphology and brightness of the different compact emitting regions (sometimes seen as far as 10 arcsec from the core, corresponding to a physical scale of 0.05 pc, with the distance to Circinus X-1 expressed in kpc) at timescales of days. The orientation of the radio emission is on a NW-SE direction in the plane of the sky and remains unchanged during the period covered by our observations. This suggests that if the jet is indeed precessing, as proposed by Iaria et al. (2008), then its precession period should be much larger then the time span of our data set.
We were able to confirm the claim of Fender (1997) for a radio flare not associated with the orbital phase 0.0. Further evidence was found that such outbursts do occur near the orbital phase 0.5 (within a region of 0.1 in phase). Their properties are similar to those of the outbursts commonly observed near the orbital phase 0.0. We suggested that the wind accretion from the massive companion might be responsible for producing them.
Fender et al. (2004) showed that the outflow in the arcsec scale jet of Circinus X-1 is relativistic. Reanalyzing the data in some more detail and determining the time delay between the successive brightening of the various compact radio emitting regions, it was found that indeed the outflow seems to be relativistic with an apparent velocity 12.
A study of the proper motion of the system was carried out. The errors in determining the positions of the core (dominated by the errors associated with the coordinates of the phase-referencing calibrator) allowed only an upper limit to be estimated, namely 50 mas yr-1( 240 km s-1, where is the distance to Circinus X-1 expressed in kpc). This is however a conservative value and future observations together with improvements in the systematic errors of the calibrators will pull down the limit and offer a better constraint.
The global spectral index of Circinus X-1 (between 4.8 and 8.6 GHz) had a mean value and standard deviation of during the monitoring period. The spectrum was flattening when flares were active, either close to phase 0.0 or 0.5.
Polarization emission was detected in one third of the epochs and in one epoch Faraday rotation was observed at a level of -175 30 rad m-1. The nature of the Faraday screen is unknown. Circumstantial evidence points towards an intrinsic origin, related to the immediate vicinity of Circinus X-1 itself, however this has to be tested in detail in future observations. In the jet the electric field vectors seem to be oriented preferentially along its axis tentatively suggesting the presence of shocks at the interface between the ejected matter and the surrounding environment.
Acknowledgments
The Australia Telescope is funded by the Commonwealth of Australia for operation as a national facility managed by CSIRO. The X-ray data was provided by the ASM/RXTE teams at MIT and at the RXTE SOF and GOF at NASA’s GSFC.
References
- Bondi & Hoyle (1944) Bondi H., Hoyle F., 1944, MNRAS, 104, 273
- Boutloukos et al. (2006) Boutloukos S., van der Klis M., Altamirano D., Klein-Wolt M., Wijnands R., Jonker P.G., Fender R.P., 2006, ApJ, 653, 1435
- Clark et al. (1975) Clark D.H., Parkinson J.H., Caswell J.L., 1975, Nature, 254, 674
- Deller et al. (2007) Deller A., Phillips C.J., Amy, S.W., Tzioumis A.K., Reynolds J.E., Jauncey D.L., Stevens J., Ellingsen S.P., Dickey J., Fender R.P., Nicolson G.D., Tudose V., 2007, Astron. Tel., 1037, 1
- Fender (1997) Fender, R., 1997, in Dermer C.D., Strickman M.S., Kurfess J.D., eds, Proceedings of the Fourth Compton Symposium, AIP Conference Proceedings 410, p. 798
- Fender et al. (1998) Fender R., Spencer R., Tzioumis T., Wu K., van der Klis M., van Paradijs J., Johnston H., 1998, ApJ, 506, L121
- Fender et al. (2004) Fender R., Wu K., Johnston H., Tzioumis T., Jonker P., Spencer R., van der Klis M., 2004, Nature, 427, 222
- Fender et al. (2004) Fender R.P., Belloni T.M., Gallo E., 2004, MNRAS, 355, 1105
- Fender et al. (2005) Fender R., Tzioumis T., Tudose V., 2005, Astron. Tel., 563, 1
- Fender (2006) Fender R.P., in Cambridge Astrophysics Series, No. 39, Compact Stellar X-ray Sources, eds. W. Lewin & M. van der Klis, p. 381
- Glass (1978) Glass I.S., 1978, MNRAS, 183, 335
- Glass (1994) Glass I.S., 1994, MNRAS, 268, 742
- Haynes et al. (1978) Haynes R.F., Jauncey D.L., Murdin P.G., Goss W.M., Longmore A.J., Simons L.W., Milne D.K., Skellern D.J., 1978, MNRAS, 185, 661
- Haynes et al. (1980) Haynes R.F., Lerche I., Murdin P., 1980, A&A, 87, 299
- Haynes et al. (1986) Haynes R.F., Komesaroff M.M., Little A.G., Jauncey D.L., Caswell J.L., Milne D.K., Kesteven M.J., Wellington K.J., Preston R.A., 1986, Nature, 324, 233
- Heinz (2002) Heinz S., 2002, A&A, 388, L40
- Heinz et al. (2007) Heinz S., Schulz N.S., Brandt W.N., Galloway D.K., 2007, ApJ, 663, L93
- Iaria et al. (2005) Iaria R., Spanó M., Di Salvo T., Robba N.R., Burderi L., Fender R., van der Klis M., Frontera F., 2005, ApJ, 619, 503
- Iaria et al. (2008) Iaria R., D’Aí A., Lavagetto G., Di Salvo T., Robba N.R., Burderi L., 2008, ApJ, 673, 1033
- Johnston et al. (1999) Johnston H.M., Fender R., Wu K., 1999, MNRAS, 308, 415
- Johnston-Hollitt et al. (2004) Johnston-Hollitt M., Hollitt C.P., Ekers R.D., 2004, in The Magnetized Interstellar Medium, eds. B. Uyaniker, W. Reich, and R. Wielebinski
- Jonker & Nelemans (2004) Jonker P.G., Nelemans G., 2004, MNRAS, 354, 355
- Jonker et al. (2007) Jonker P.G., Nelemans G., Bassa C.G., 2007, MNRAS, 374, 999
- Kaiser et al. (2000) Kaiser C.R., Sunyaev R., Spruit H.C., 2000, A&A, 356, 975
- Kaluzienski et al. (1976) Kaluzienski L.J., Holt S.S., Boldt E.A., Serlemitsos P.J., 1976, ApJ, 208, L71
- Martí & Paredes (1995) Martí J., Paredes J.M., 1995, A&A, 298, 151
- Mignani et al. (2002) Mignani R.P., De Luca A., Caraveo P.A., Mirabel I.F., 2002, A&A, 386, 487
- Mirabel & Rodríguez (1999) Mirabel I.F., Rodríguez L.F., 1999, ARA&A, 37, 409
- Murdin et al. (1980) Murdin P., Jauncey D.L., Haynes R.F., Lerche I., Nicolson G.D., Holt S.S., Kaluzienski L.J., 1980, A&A, 87, 292
- Nicolson et al. (1980) Nicolson G.D., Glass I.S., Feast M.W., 1980, MNRAS, 191, 293
- Nicolson (2007) Nicolson G.D., 2007, Astron. Tel., 985, 1
- Oosterbroek et al. (1995) Oosterbroek T., van der Klis M., Kuulkers E., van Paradijs J., Lewin W. H. G., 1995, A&A, 297, 141
- Phillips et al. (2007) Phillips C.J., Deller A., Amy S.W., Tingay S.J., Tzioumis A.K., Reynolds J.E., Jauncey D.L., Stevens J., Ellingsen S.P., Dickey J., Fender R.P., Tudose V., Nicolson G.D., 2007, MNRAS, 380, L11
- Preston et al. (1983) Preston R.A., Morabito D.D., Wehrle A.E., Jauncey D.L., Batty M.J., Haynes R.F., Wright A.E., Nicolson G.D., 1983, ApJ, 268, L23
- Sault et al. (1995) Sault R.J., Teuben P.J., Wright M.C.H., 1995, in Shaw R.A., Payne H.E., Hayes J.J.E., eds, Astronomical Data Analysis Software and Systems IV, ASP Conf. Ser., 77, p. 433
- Schulz et al. (2008) Schulz N.S., Kallman T.E., Galloway D.K., Brandt W.N., 2008, ApJ, 672, 1091
- Shirey et al. (1999) Shirey R.E., Bradt H.V., Levine A.M., 1999, ApJ, 517, 472
- Soleri et al. (2007) Soleri P., Tudose V., Fender R.P., van der Klis M., 2007, in Bursts, Pulses and Flickering: Wide-Field Monitoring of the Dynamic Radio Sky, eds. T.J. Lazio, R.P. Fender, A.K. Tzioumis, PoS(Dynamic2007)037, arXiv:0803.1765
- Soleri et al. (2008) Soleri P., Heinz S., Fender R.P., Wijnands R., Tudose V., Altamirano D., Jonker P.G., van der Klis M., Kuiper L., Casella P., 2008, submitted to MNRAS
- Stewart et al. (1991) Stewart R.T., Nelson G.J., Penninx W., Kitamoto S., Miyamoto S., Nicolson G.D., 1991, MNRAS, 253, 212
- Stewart et al. (1993) Stewart R.T., Caswell J.L., Haynes R.F., Nelson G.J., 1993, MNRAS, 261, 593
- Tauris et al. (1999) Tauris T.M., Fender R.P., van den Heuvel E.P.J., Johnston H.M., Wu K., 1999, MNRAS, 310, 1165
- Tennant et al. (1986a) Tennant A.F., Fabian A.C., Shafer R.A., 1986a, MNRAS, 219, 871
- Tennant et al. (1986b) Tennant A.F., Fabian A.C., Shafer R.A., 1986b, MNRAS, 221, 27
- Tudose et al. (2006) Tudose V., Fender R.P., Kaiser C.R., Tzioumis A.K., van der Klis M., Spencer, R.E., 2006, MNRAS, 372, 417
- Vadawale et al. (2003) Vadawale S.V., Rao A.R., Naik S., Yadav J.S., Ishwara-Chandra C.H., Pramesh Rao A., Pooley G.G., 2003, ApJ, 597, 1023
- van der Laan (1966) van der Laan H., 1966, Nature, 211, 1131
- Whelan et al. (1977) Whelan J.A.J., Mayo S.K., Wickramasinghe D.T., Murdin P.G., Peterson B.A., Hawarden T.G., Longmore A.J., Haynes R.F., Goss W.M., Simons L.W., Caswell J.L., Little A.G., McAdam W.B., 1977, MNRAS, 181, 259
Appendix A Image-plane fits
The methodology employed was the following. We first fitted the data iteratively with a single Gaussian component and at each iteration subtracted the resulting model from the residual map obtained in the previous iteration. We then used the fitting parameters thus obtained as initial estimations in re-fitting the data this time with all the components simultaneously included. Tables A1 and A2 show the results obtained by fitting the natural weighted radio maps at 4.8 and 8.6 GHz respectively.
For coordinates, the quoted errors take into account the systematic error associated with the position of the phase-referencing calibrator (250 mas) and the formal errors due to the fitting process.
| Ep | Date | RA [h:m:s] | DEC [] | [mJy] | Size [arcsec arcsec] | PA [] |
|---|---|---|---|---|---|---|
| 1 | 96/07/01 | 15:20:40.856 (0.032) | -57:10:00.498 (0.267) | 29.6 (0.4) | 2.8 2.2 | - |
| 15:20:41.141 (0.082) | -57:10:02.513 (0.720) | 1.1 (0.3) | 2.8 2.2 | - | ||
| 15:20:40.645 (0.093) | -57:09:56.844 (0.924) | 0.7 (0.3) | 2.8 2.2 | - | ||
| 2 | 96/07/02 | 15:20:40.861 (0.032) | -57:10:00.545 (0.266) | 29.7 (0.3) | 2.8 2.2 | - |
| 15:20:40.446 (0.071) | -57:09:56.797 (0.639) | 1.6 (0.3) | 2.8 2.2 | - | ||
| 15:20:41.570 (0.072) | -57:10:05.709 (0.670) | 1.0 (0.2) | 2.8 2.2 | - | ||
| 3 | 96/07/03 | 15:20:40.862 (0.031) | -57:10:00.582 (0.258) | 22.5 (0.1) | 2.8 2.2 | - |
| 15:20:41.610 (0.048) | -57:10:05.966 (0.416) | 1.0 (0.1) | 1.7 (0.4) 0.7 (0.3) | -46.0 (21.6) | ||
| 4 | 96/07/04 | 15:20:40.816 (0.032) | -57:10:00.271 (0.261) | 22.4 (0.2) | 2.8 2.2 | - |
| 15:20:39.679 (0.046) | -57:09:50.584 (0.385) | 2.0 (0.2) | 2.8 2.2 | - | ||
| 5 | 96/07/05 | 15:20:40.865 (0.032) | -57:10:00.544 (0.267) | 13.8 (0.2) | 2.8 2.2 | - |
| 15:20:41.666 (0.051) | -57:10:05.440 (0.477) | 1.7 (0.1) | 2.8 (0.6) 1.2 (0.4) | -25.9 (13.6) | ||
| 6 | 96/07/07 | 15:20:40.902 (0.034) | -57:10:00.576 (0.282) | 6.2 (0.1) | 0.9 (0.1) 0.4 (0.1) | -37.8 (4.4) |
| 7 | 96/07/08 | 15:20:40.926 (0.032) | -57:10:00.862 (0.266) | 6.9 (0.1) | 2.8 2.2 | - |
| 15:20:41.666 (0.059) | -57:10:04.671 (0.492) | 0.5 (0.1) | 2.8 2.2 | - | ||
| 8 | 96/07/09 | 15:20:40.896 (0.034) | -57:10:00.685 (0.280) | 9.6 (0.2) | 1.7 (0.1) 0.5 (0.1) | -54.2 (4.5) |
| 9 | 96/07/10 | 15:20:40.854 (0.032) | -57:10:00.483 (0.261) | 20.7 (0.2) | 0.8 (0.1) 0.3 (0.1) | -50.4 (1.6) |
| 15:20:41.604 (0.050) | -57:10:06.415 (0.425) | 1.9 (0.1) | 2.6 (0.4) 1.1 (0.4) | -47.5 (16.0) | ||
| 10 | 96/07/13 | 15:20:41.065 (0.035) | -57:10:01.022 (0.292) | 8.5 (0.3) | 0.9 (0.1) 0.6 (0.1) | -81.2 (7.6) |
| 11 | 98/02/05-06 | 15:20:40.892 (0.036) | -57:10:00.560 (0.295) | 9.5 (0.2) | 2.1 (0.1) 1.4 (0.1) | 88.4 (53.4) |
| 12 | 98/02/23-24 | 15:20:40.894 (0.034) | -57:10:00.721 (0.276) | 10.5 (0.1) | 2.3 (0.1) 0.8 (0.1) | -73.7 (5.6) |
| 15:20:41.803 (0.091) | -57:10:11.592 (0.894) | 0.3 (0.1) | 2.8 2.2 | - | ||
| 13 | 98/10/03-04 | 15:20:40.892 (0.037) | -57:10:00.725 (0.289) | 7.9 (0.1) | 3.5 (0.1) 0.8 (0.1) | -77.5 (3.3) |
| 14 | 98/10/16-17 | 15:20:40.910 (0.037) | -57:10:00.700 (0.294) | 6.4 (0.1) | 3.1 (0.1) 0.8 (0.1) | -75.3 (4.9) |
| 15 | 98/10/29-30 | 15:20:40.886 (0.035) | -57:10:00.663 (0.283) | 8.2 (0.1) | 2.6 (0.1) 0.7 (0.1) | -76.6 (5.9) |
| 16 | 98/11/02 | 15:20:40.876 (0.037) | -57:10:00.663 (0.288) | 5.4 (0.1) | 3.1 (0.1) 1.2 (0.1) | -87.9 (5.2) |
| 17 | 00/02/05-06 | 15:20:40.791 (0.045) | -57:09:59.941 (0.381) | 4.3 (0.6) | 2.8 2.2 | - |
| 15:20:41.018 (0.040) | -57:10:01.496 (0.317) | 11.6 (0.3) | 1.6 (0.1) 1.5 (0.1) | 13.5 (10.4) | ||
| 18 | 00/10/01 | 15:20:40.739 (0.068) | -57:10:00.096 (0.437) | 5.6 (1.1) | 2.8 2.2 | - |
| 15:20:41.013 (0.058) | -57:10:01.692 (0.448) | 13.4 (0.6) | 2.5 (0.4) 1.8 (0.2) | -73.8 (41.1) | ||
| 19 | 00/10/07-08 | 15:20:40.768 (0.044) | -57:10:00.048 (0.409) | 5.6 (0.8) | 2.8 2.2 | - |
| 15:20:41.043 (0.050) | -57:10:01.578 (0.342) | 12.5 (0.4) | 2.4 (0.1) 0.8 (0.3) | -74.8 (13.8) | ||
| 20 | 00/10/09-10 | 15:20:40.828 (0.044) | -57:10:00.305 (0.361) | 10.8 (0.3) | 2.0 (0.2) 0.6 (0.1) | -54.4 (6.4) |
| 15:20:41.068 (0.043) | -57:10:01.905 (0.310) | 9.3 (0.6) | 2.8 2.2 | - | ||
| 21 | 00/10/14-15 | 15:20:40.835 (0.041) | -57:10:00.438 (0.339) | 19.9 (0.4) | 2.4 (0.2) 0.9 (0.1) | -44.7 (4.5) |
| 15:20:41.102 (0.054) | -57:10:01.852 (0.355) | 6.6 (0.8) | 2.8 2.2 | - | ||
| 22 | 00/10/19 | 15:20:40.880 (0.042) | -57:10:00.542 (0.341) | 23.5 (0.6) | 1.8 (0.2) 1.2 (0.1) | -47.6 (9.1) |
| 15:20:41.104 (0.060) | -57:10:01.720 (0.417) | 9.0 (1.2) | 2.8 2.2 | - | ||
| 23 | 00/10/20-21 | 15:20:40.812 (0.042) | -57:10:00.038 (0.460) | 11.6 (2.6) | 2.8 2.2 | - |
| 15:20:40.998 (0.066) | -57:10:01.650 (0.456) | 18.1 (1.6) | 2.8 2.2 | - | ||
| 15:20:40.243 (0.137) | -57:09:57.376 (0.855) | 3.1 (0.2) | 6.0 (2.7) 1.9 (0.9) | -59.7 (16.9) | ||
| 24 | 00/10/23 | 15:20:40.797 (0.046) | -57:10:00.087 (0.398) | 10.4 (0.7) | 2.8 2.2 | - |
| 15:20:41.032 (0.048) | -57:10:01.726 (0.341) | 14.5 (0.6) | 2.5 (0.1) 0.2 (0.2) | 75.2 (10.1) | ||
| 25 | 00/10/25-26 | 15:20:40.863 (0.061) | -57:10:00.619 (0.479) | 15.6 (0.8) | 2.8 2.2 | - |
| 15:20:41.088 (0.056) | -57:10:01.988 (0.391) | 9.8 (2.0) | 2.8 2.2 | - | ||
| 15:20:40.365 (0.092) | -57:09:57.374 (0.867) | 1.0 (0.4) | 2.8 2.2 | - | ||
| 26 | 01/05/23 | 15:20:40.838 (0.039) | -57:10:00.443 (0.349) | 11.6 (0.3) | 1.8 (0.2) 0.8 (0.1) | -24.3 (5.2) |
| 15:20:41.075 (0.045) | -57:10:02.322 (0.330) | 7.9 (0.5) | 1.8 (0.1) 0.6 (0.2) | 51.1 (8.3) | ||
| 27 | 01/05/25 | 15:20:40.816 (0.049) | -57:10:00.283 (0.378) | 6.3 (0.3) | 2.8 2.2 | - |
| 15:20:41.066 (0.041) | -57:10:02.138 (0.335) | 8.7 (0.4) | 1.7 (0.1) 0.7 (0.1) | 71.5 (14.3) | ||
| 28 | 01/05/27 | 15:20:40.842 (0.043) | -57:10:00.493 (0.348) | 9.2 (0.2) | 2.8 2.2 | - |
| 15:20:41.085 (0.040) | -57:10:02.380 (0.319) | 7.0 (0.5) | 2.8 2.2 | - | ||
| 15:20:41.692 (0.153) | -57:10:03.020 (0.478) | 1.6 (0.1) | 2.8 2.2 | - | ||
| 29 | 01/05/29 | 15:20:40.814 (0.036) | -57:10:00.214 (0.304) | 7.7 (0.1) | 1.4 (0.1) 0.7 (0.1) | -46.3 (4.9) |
| 15:20:41.065 (0.037) | -57:10:02.234 (0.293) | 8.4 (0.2) | 1.5 (0.1) 1.2 (0.1) | 78.2 (8.0) | ||
| 30 | 01/09/08 | 15:20:40.833 (0.058) | -57:10:00.105 (0.509) | 5.0 (0.2) | 3.0 (0.3) 1.5 (0.4) | 31.7 (11.9) |
| 15:20:41.056 (0.054) | -57:10:02.351 (0.450) | 4.5 (0.3) | 3.0 (0.3) 0.6 (0.4) | 41.4 (8.1) |
| Ep | Date | RA [h:m:s] | DEC [] | [mJy] | Size [arcsec arcsec] | PA [] |
|---|---|---|---|---|---|---|
| 31 | 02/12/02-03 | 15:20:40.749 (0.050) | -57:10:00.119 (0.450) | 1.4 (0.2) | 2.8 2.2 | - |
| 15:20:41.060 (0.054) | -57:10:02.451 (0.487) | 1.1 (0.2) | 2.8 2.2 | - | ||
| 32 | 02/12/03-04 | 15:20:40.749 (0.051) | -57:10:00.270 (0.452) | 1.4 (0.2) | 2.8 2.2 | - |
| 15:20:41.009 (0.060) | -57:10:02.129 (0.519) | 1.1 (0.2) | 2.8 2.2 | - | ||
| 15:20:41.309 (0.066) | -57:10:00.277 (0.592) | 0.8 (0.2) | 2.8 2.2 | - | ||
| 33 | 02/12/04-05 | 15:20:40.842 (0.038) | -57:10:00.670 (0.316) | 11.1 (0.3) | 2.8 2.2 | - |
| 15:20:41.447 (0.082) | -57:10:00.152 (0.770) | 1.0 (0.3) | 2.8 2.2 | - | ||
| 15:20:40.313 (0.073) | -57:10:02.107 (0.667) | 1.2 (0.3) | 2.8 2.2 | - | ||
| 34 | 02/12/05-06 | 15:20:40.839 (0.034) | -57:10:00.518 (0.292) | 10.6 (0.2) | 2.8 2.2 | - |
| 15:20:41.220 (0.067) | -57:10:03.509 (0.609) | 0.9 (0.2) | 2.8 2.2 | - | ||
| 35 | 02/12/06-07 | 15:20:40.834 (0.036) | -57:10:00.446 (0.321) | 5.4 (0.1) | 2.8 2.2 | - |
| 15:20:41.129 (0.069) | -57:10:03.140 (0.444) | 1.5 (0.1) | 3.2 (0.5) 1.2 (0.5) | 70.3 (21.02) | ||
| 15:20:41.796 (0.071) | -57:10:10.397 (0.667) | 0.35 (0.09) | 2.8 2.2 | - | ||
| 36 | 02/12/07-08 | 15:20:40.866 (0.045) | -57:10:00.793 (0.369) | 4.1 (0.1) | 4.7 (0.4) 1.5 (0.2) | -46.0 (4.1) |
| 15:20:41.388 (0.075) | -57:10:02.634 (0.650) | 0.5 (0.1) | 2.8 2.2 | - | ||
| 37 | 02/12/08-09 | 15:20:40.775 (0.092) | -57:09:59.857 (0.952) | 0.5 (0.2) | 2.8 2.2 | - |
| 15:20:40.936 (0.075) | -57:10:01.364 (0.633) | 3.1 (0.1) | 6.6 (0.9) 1.7 (0.4) | -45.3 (6.5) | ||
| 38 | 03/12/23-24 | 15:20:40.822 (0.071) | -57:10:00.495 (0.671) | 0.9 (0.2) | 2.8 2.2 | - |
| 15:20:41.075 (0.074) | -57:10:03.070 (0.692) | 0.9 (0.2) | 2.8 2.2 | - | ||
| 39 | 05/04/06 | 15:20:40.780 (0.063) | -57:10:00.737 (0.579) | 0.8 (0.2) | 2.8 2.2 | - |
| 15:20:41.784 (0.083) | -57:10:11.419 (0.791) | 0.47 (0.15) | 2.8 2.2 | - | ||
| 40 | 05/06/17 | 15:20:40.841 (0.032) | -57:10:00.561 (0.265) | 38.8 (0.5) | 2.8 2.2 | - |
| 15:20:40.453 (0.065) | -57:10:03.678 (0.607) | 1.7 (0.3) | 2.8 2.2 | - | ||
| 15:20:41.130 (0.081) | -57:09:56.866 (0.779) | 1.1 (0.3) | 2.8 2.2 | - | ||
| 41 | 06/03/22-23 | - | - | - | - | - |
| Ep | Date | RA [h:m:s] | DEC [] | [mJy] | Size [arcsec arcsec] | PA [] |
|---|---|---|---|---|---|---|
| 1 | 96/07/01 | 15:20:40.847 (0.033) | -57:10:00.483 (0.264) | 22.1 (0.4) | 0.4 (0.1) 0.2 (0.1) | -8.3 (3.7) |
| 15:20:40.983 (0.058) | -57:10:00.910 (0.406) | 1.9 (0.7) | 1.6 1.3 | - | ||
| 2 | 96/07/02 | 15:20:40.854 (0.032) | -57:10:00.537 (0.262) | 24.5 (0.4) | 0.6 (0.1) 0.2 (0.1) | -47.8 (3.6) |
| 15:20:41.256 (0.054) | -57:10:03.360 (0.488) | 1.1 (0.3) | 1.6 1.3 | - | ||
| 15:20:40.601 (0.051) | -57:09:58.230 (0.472) | 1.5 (0.4) | 1.6 1.3 | - | ||
| 3 | 96/07/03 | 15:20:40.851 (0.031) | -57:10:00.566 (0.256) | 23.6 (0.2) | 1.6 1.3 | - |
| 15:20:41.392 (0.047) | -57:10:04.468 (0.400) | 2.5 (0.1) | 3.1 (0.4) 0.8 (0.2) | -43.0 (6.5) | ||
| 4 | 96/07/04 | 15:20:40.817 (0.032) | -57:10:00.335 (0.260) | 20.0 (0.2) | 1.6 1.3 | - |
| 15:20:40.124 (0.042) | -57:09:54.482 (0.345) | 3.9 (0.2) | 1.6 1.3 | - | ||
| 5 | 96/07/05 | 15:20:40.849 (0.032) | -57:10:00.502 (0.260) | 10.1 (0.1) | 1.6 1.3 | - |
| 15:20:41.441 (0.054) | -57:10:03.781 (0.412) | 1.4 (0.1) | 2.5 (0.5) 0.9 (0.3) | -60.1 (13.8) | ||
| 6 | 96/07/07 | 15:20:40.849 (0.034) | -57:10:00.267 (0.276) | 3.4 (0.1) | 1.6 1.3 | - |
| 15:20:40.973 (0.047) | -57:10:00.943 (0.380) | 0.7 (0.1) | 1.6 1.3 | - | ||
| 7 | 96/07/08 | 15:20:40.885 (0.032) | -57:10:00.689 (0.262) | 5.3 (0.1) | 0.2 (0.1) 0.1 (0.1) | 10.6 (3.5) |
| 15:20:41.102 (0.043) | -57:10:01.715 (0.378) | 0.7 (0.1) | 1.1 (0.3) 0.3 (0.2) | 0.9 (18.1) | ||
| 15:20:40.501 (0.045) | -57:09:58.457 (0.377) | 0.5 (0.1) | 1.6 1.3 | - | ||
| 8 | 96/07/09 | 15:20:40.860 (0.035) | -57:10:00.574 (0.276) | 6.5 (0.2) | 0.7 (0.1) 0.2 (0.1) | -28.1 (5.5) |
| 15:20:41.022 (0.051) | -57:10:01.357 (0.379) | 1.7 (0.2) | 0.9 (0.2) 0.4 (0.2) | -24.8 (21.7) | ||
| 15:20:40.639 (0.047) | -57:09:57.470 (0.413) | 0.5 (0.1) | 1.6 1.3 | - | ||
| 9 | 96/07/10 | 15:20:40.848 (0.031) | -57:10:00.472 (0.255) | 17.3 (0.1) | 0.5 (0.1) 0.1 (0.01) | -46.1 (1.4) |
| 15:20:41.288 (0.036) | -57:10:03.928 (0.298) | 1.9 (0.1) | 0.8 (0.1) 0.3 (0.1) | -51.8 (14.4) | ||
| 15:20:40.471 (0.043) | -57:09:56.609 (0.377) | 0.7 (0.1) | 0.6 (0.3) 0.3 (0.2) | -30.5 (33.0) | ||
| 10 | 96/07/13 | 15:20:41.075 (0.033) | -57:10:01.068 (0.273) | 4.6 (0.1) | 0.5 (0.054) 0.3 (0.1) | -65.0 (8.2) |
| 15:20:40.572 (0.045) | -57:09:59.757 (0.400) | 0.7 (0.1) | 1.6 1.3 | - | ||
| 11 | 98/02/05-06 | 15:20:40.848 (0.033) | -57:10:00.421 (0.279) | 4.0 (0.1) | 0.7 (0.1) 0.3 (0.1) | -15.9 (5.4) |
| 15:20:40.994 (0.058) | -57:10:00.697 (0.416) | 3.8 (0.1) | 5.0 (0.5) 2.3 (0.3) | 44.1 (6.0) | ||
| 12 | 98/02/23-24 | 15:20:40.851 (0.035) | -57:10:00.570 (0.274) | 5.7 (0.1) | 1.1 (0.1) 0.4 (0.1) | -68.8 (8.8) |
| 15:20:41.046 (0.050) | -57:10:01.004 (0.361) | 1.7 (0.1) | 2.2 (0.3) 0.9 (0.2) | 24.9 (8.4) | ||
| 13 | 98/10/03-04 | 15:20:40.834 (0.051) | -57:10:00.455 (0.327) | 2.9 (0.1) | 1.6 1.3 | - |
| 15:20:41.082 (0.068) | -57:10:01.209 (0.357) | 1.2 (0.2) | 2.1 (0.3) 0.3 (0.2) | 83.7 (15.3) | ||
| 14 | 98/10/16-17 | 15:20:40.806 (0.041) | -57:10:00.304 (0.293) | 2.3 (0.1) | 1.7 (0.2) 0.7 (0.1) | 89.0 (11.8) |
| 15:20:41.058 (0.040) | -57:10:00.929 (0.313) | 1.8 (0.1) | 1.8 (0.1) 0.8 (0.1) | 40.0 (7.3) | ||
| 15 | 98/10/29-30 | 15:20:40.831 (0.036) | -57:10:00.284 (0.329) | 1.6 (0.2) | 1.6 1.3 | - |
| 15:20:40.894 (0.045) | -57:10:00.801 (0.317) | 2.9 (0.1) | 3.2 (0.3) 0.4 (0.1) | -78.9 (3.6) | ||
| 16 | 98/11/02 | 15:20:40.783 (0.044) | -57:10:00.513 (0.313) | 2.0 (0.1) | 1.9 (0.2) 0.6 (0.2) | 81.7 (9.8) |
| 15:20:40.993 (0.064) | -57:10:01.372 (0.482) | 1.8 (0.1) | 4.6 (0.7) 1.7 (0.4) | 46.4 (6.7) | ||
| 17 | 00/02/05-06 | 15:20:40.819 (0.035) | -57:10:00.147 (0.293) | 3.6 (0.1) | 1.2 (0.1) 0.4 (0.1) | -32.8 (6.5) |
| 15:20:41.038 (0.034) | -57:10:01.637 (0.279) | 5.4 (0.1) | 1.1 (0.1) 0.9 (0.1) | 14.0 (7.3) | ||
| 18 | 00/10/01 | 15:20:40.779 (0.039) | -57:10:00.136 (0.314) | 4.2 (0.1) | 1.9 (0.2) 0.9 (0.1) | 89.0 (12.5) |
| 15:20:41.014 (0.040) | -57:10:01.873 (0.298) | 5.5 (0.1) | 2.6 (0.2) 0.8 (0.1) | 76.7 (4.6) | ||
| 19 | 00/10/07-08 | 15:20:40.782 (0.043) | -57:10:00.155 (0.325) | 4.0 (0.2) | 2.2 (0.3) 0.3 (0.1) | -63.5 (6.3) |
| 15:20:41.066 (0.038) | -57:10:01.795 (0.297) | 4.9 (0.2) | 1.4 (0.1) 0.6 (0.1) | 80.8 (20.7) | ||
| 20 | 00/10/09-10 | 15:20:40.806 (0.034) | -57:10:00.165 (0.283) | 4.8 (0.1) | 1.0 (0.1) 0.9 (0.1) | 53.0 (11.6) |
| 15:20:41.038 (0.035) | -57:10:01.824 (0.278) | 6.2 (0.1) | 1.7 (0.1) 1.0 (0.1) | 75.4 (10.0) | ||
| 21 | 00/10/14-15 | 15:20:40.808 (0.034) | -57:10:00.187 (0.282) | 8.2 (0.2) | 1.4 (0.1) 0.7 (0.1) | -54.4 (6.3) |
| 15:20:41.044 (0.037) | -57:10:01.789 (0.290) | 6.4 (0.2) | 1.8 (0.1) 0.8 (0.1) | 62.2 (6.7) | ||
| 22 | 00/10/19 | 15:20:40.835 (0.035) | -57:10:00.374 (0.289) | 12.5 (0.3) | 1.3 (0.1) 0.9 (0.1) | 13.1 (7.7) |
| 15:20:41.021 (0.040) | -57:10:02.017 (0.339) | 3.5 (0.3) | 1.6 1.3 | - | ||
| 15:20:40.771 (0.051) | -57:09:57.183 (0.458) | 1.4 (0.3) | 1.6 1.3 | - | ||
| 23 | 00/10/20-21 | 15:20:40.823 (0.035) | -57:10:00.320 (0.288) | 10.7 (0.3) | 1.6 1.3 | - |
| 15:20:41.037 (0.040) | -57:10:01.778 (0.300) | 7.5 (0.2) | 1.6 1.3 | - | ||
| 15:20:40.517 (0.047) | -57:09:58.979 (0.412) | 1.2 (0.2) | 1.6 1.3 | - | ||
| 24 | 00/10/23 | 15:20:40.799 (0.035) | -57:10:00.165 (0.279) | 5.8 (0.1) | 1.5 (0.1) 0.5 (0.1) | 68.7 (6.4) |
| 15:20:41.034 (0.035) | -57:10:01.772 (0.274) | 8.5 (0.1) | 2.2 (0.1) 0.8 (0.1) | 68.0 (3.2) | ||
| 25 | 00/10/25-26 | 15:20:40.804 (0.038) | -57:10:00.123 (0.311) | 5.4 (0.2) | 1.4 (0.1) 0.8 (0.1) | 88.8 (51.2) |
| 15:20:41.058 (0.038) | -57:10:01.703 (0.293) | 8.9 (0.2) | 2.1 (0.1) 1.0 (0.1) | -89.5 (8.5) | ||
| 15:20:40.524 (0.051) | -57:09:58.650 (0.449) | 0.9 (0.2) | 1.6 1.3 | - |
| Ep | Date | RA [h:m:s] | DEC [] | [mJy] | Size [arcsec arcsec] | PA [] |
|---|---|---|---|---|---|---|
| 26 | 01/05/23 | 15:20:40.836 (0.032) | -57:10:00.390 (0.272) | 7.2 (0.1) | 1.3 (0.1) 0.3 (0.1) | -16.1 (2.2) |
| 15:20:41.058 (0.035) | -57:10:02.296 (0.279) | 5.5 (0.1) | 1.6 (0.1) 0.9 (0.1) | 63.1 (7.0) | ||
| 27 | 01/05/25 | 15:20:40.817 (0.035) | -57:10:00.315 (0.280) | 4.3 (0.1) | 1.5 (0.1) 0.5 (0.1) | -85.3 (9.5) |
| 15:20:41.060 (0.034) | -57:10:02.102 (0.281) | 5.5 (0.1) | 1.6 (0.1) 1.2 (0.1) | 65.4 (11.5) | ||
| 28 | 01/05/27 | 15:20:40.818 (0.036) | -57:10:00.368 (0.292) | 4.6 (0.1) | 1.7 (0.1) 0.3 (0.1) | -58.6 (4.7) |
| 15:20:41.063 (0.037) | -57:10:02.197 (0.292) | 5.5 (0.1) | 1.9 (0.1) 1.3 (0.1) | 80.2 (15.5) | ||
| 29 | 01/05/29 | 15:20:40.815 (0.034) | -57:10:00.209 (0.286) | 4.4 (0.1) | 1.5 (0.1) 0.7 (0.1) | -21.2 (3.8) |
| 15:20:41.055 (0.035) | -57:10:02.164 (0.277) | 5.3 (0.1) | 1.6 (0.1) 1.1 (0.1) | 80.0 (17.5) | ||
| 30 | 01/09/08 | 15:20:40.844 (0.038) | -57:10:00.074 (0.327) | 2.1 (0.1) | 1.9 (0.2) 0.4 (0.1) | 38.3 (6.5) |
| 15:20:41.065 (0.039) | -57:10:02.198 (0.317) | 2.7 (0.1) | 2.2 (0.2) 0.7 (0.1) | 48.2 (5.6) | ||
| 31 | 02/12/02-03 | 15:20:40.807 (0.045) | -57:10:00.058 (0.396) | 0.35 (0.05) | 1.6 1.3 | - |
| 15:20:41.010 (0.045) | -57:10:02.442 (0.397) | 0.34 (0.05) | 1.6 1.3 | - | ||
| 32 | 02/12/03-04 | 15:20:40.819 (0.049) | -57:10:00.452 (0.392) | 1.7 (0.1) | 2.7 (0.4) 2.1 (0.4) | -74.8 (43.8) |
| 33 | 02/12/04-05 | 15:20:40.846 (0.034) | -57:10:00.619 (0.314) | 10.8 (0.5) | 1.6 1.3 | - |
| 15:20:41.095 (0.112) | -57:09:59.010 (0.590) | 3.7 (0.2) | 3.4 (1.4) 1.2 (0.4) | 67.1 (15.4) | ||
| 15:20:40.587 (0.048) | -57:10:01.862 (0.419) | 1.5(0.3) | 1.6 1.3 | - | ||
| 34 | 02/12/05-06 | 15:20:40.837 (0.032) | -57:10:00.496 (0.273) | 6.2 (0.1) | 1.6 1.3 | - |
| 15:20:41.117 (0.046) | -57:10:02.735 (0.408) | 0.6 (0.1) | 1.6 1.3 | - | ||
| 35 | 02/12/06-07 | 15:20:40.835 (0.033) | -57:10:00.389 (0.283) | 2.7 (0.1) | 1.6 1.3 | - |
| 15:20:41.045 (0.061) | -57:10:02.769 (0.416) | 1.6 (0.1) | 4.1 (0.6) 1.8 (0.3) | -75.5 (10.0) | ||
| 15:20:40.650 (0.052) | -57:09:59.398 (0.421) | 0.34 (0.07) | 1.6 1.3 | - | ||
| 36 | 02/12/07-08 | 15:20:40.827 (0.041) | -57:10:00.455 (0.339) | 1.4 (0.1) | 2.5 (0.3) 0.3 (0.1) | -47.8 (4.9) |
| 15:20:41.133 (0.045) | -57:10:03.096 (0.393) | 0.36 (0.05) | 1.6 1.3 | - | ||
| 15:20:40.691 (0.092) | -57:09:58.070 (0.966) | 0.09 (0.06) | 1.6 1.3 | - | ||
| 37 | 02/12/08-09 | 15:20:40.846 (0.042) | -57:10:00.573 (0.364) | 0.44 (0.05) | 1.6 1.3 | - |
| 15:20:41.012 (0.047) | -57:10:02.392 (0.416) | 0.30 (0.05) | 1.6 1.3 | - | ||
| 15:20:40.644 (0.050) | -57:09:58.952 (0.440) | 0.26 (0.05) | 1.6 1.3 | - | ||
| 38 | 03/12/23-24 | 15:20:40.849 (0.053) | -57:10:00.399 (0.489) | 0.24 (0.06) | 1.6 1.3 | - |
| 15:20:40.945 (0.057) | -57:10:02.492 (0.524) | 0.19 (0.05) | 1.6 1.3 | - | ||
| 15:20:40.722 (0.058) | -57:09:58.897 (0.526) | 0.20 (0.05) | 1.6 1.3 | - | ||
| 39 | 05/04/06 | - | - | - | - | - |
| 40 | 05/06/17 | 15:20:40.841 (0.032) | -57:10:00.550 (0.264) | 36.1 (0.6) | 1.6 1.3 | - |
| 15:20:40.959 (0.050) | -57:09:58.450 (0.449) | 2.4 (0.5) | 1.6 1.3 | - | ||
| 15:20:40.645 (0.051) | -57:10:02.649 (0.454) | 2.2 (0.5) | 1.6 1.3 | - | ||
| 41 | 06/03/22-23 | - | - | - | - | - |