A hard X-ray view of two distant VHE blazars: 1ES 1101-232 and 1ES 1553+113
Abstract
TeV-blazars are known as prominent non-thermal emitters across the entire electromagnetic spectrum with their photon power peaking in the X-ray and TeV-band. If distant, absorption of -ray photons by the extragalactic background light (EBL) alters the intrinsic TeV spectral shape, thereby affecting the overall interpretation. Suzaku observations for two of the more distant TeV-blazars known to date, 1ES 1101-232 and 1ES 1553+113, were carried out in May and July 2006, respectively, including a quasi-simultaneous coverage with the state of the art Cherenkov telescope facilities. We report on the resulting data sets with emphasis on the X-ray band, and set into context to their historical behaviour. During our campaign, we did not detect any significant X-ray or –ray variability. 1ES 1101-232 was found in a quiescent state with the lowest X-ray flux ever measured. The combined XIS and HXD PIN data for 1ES 1101-232 and 1ES 1553+113 clearly indicate spectral curvature up to the highest hard X-ray data point ( keV), manifesting as softening with increasing energy. We describe this spectral shape by either a broken power law or a log-parabolic fit with equal statistical goodness of fits. The combined 1ES 1553+113 very high energy spectrum ( GeV) did not show any significant changes with respect to earlier observations. The resulting contemporaneous broadband spectral energy distributions of both TeV-blazars are discussed in view of implications for intrinsic blazar parameter values, taking into account the -ray absorption in the EBL.
1 Introduction
Blazars are among the most extreme sources in the high energy sky. They constitute a subclass of the jet-dominated radio-loud population of active galactic nuclei (AGN), which in turn are sub-divided into flat spectrum radio quasars (FSRQ) and BL Lac objects where the absence or depression of strong emission lines characterizes the latter. Their observational properties include non-thermal continuum emission and irregular variability across the whole electromagnetic band, ranging from subhours at gamma-ray energies to week-long time scales in the radio band, often high optical and radio polarization, and a core-dominated radio morphology. In some sources, superluminal motion has been detected, indicating a relativistically enhanced emission region close to the line-of-sight Blandford & Rees (1978). As a consequence of this, any jet emission is highly beamed.
The spectral energy distribution (SED) of blazars shows two broad peaks in the representation. The low energy hump is generally agreed to stem from synchrotron radiation of relativistic electrons and/or positrons in the jet whereas the origin of the high energy one is still under debate. Leptonic models explain the complete non-thermal SED as synchrotron and inverse Compton emission from relativistic electrons or pairs which upscatter their self-produced synchrotron radiation or external photon fields. Hadronic models produce the high energy peak either via interactions of relativistic protons with matter Pohl & Schlickeiser (2000), ambient photons (e.g. Mannheim, 1993), magnetic fields Aharonian (2000), and/or both, magnetic fields and photons (e.g. Mücke & Protheroe, 2001; Mücke et al., 2003).
Almost all of the 19 blazars (except for BL Lacertae Albert et al. 2007b and 3C 279 Teshima et al. (2007)) detected reliably to date at the TeV energy belong to the subclass of high-frequency peaked BL Lacs (HBLs), with their two peaks typically at UV/X-rays and TeV-energies. Until recently blazars have been detected preferentially in their flare state, owing to instrumental limitations. With the contemporary Cherenkov telescopes (such as H.E.S.S., MAGIC, VERITAS) it is possible to study also low activity states (subsequently referred to ”quiet state”).
TeV-blazars have also been used successfully as a powerful tool to probe the extragalactic background light (EBL) at IR/optical energies via the absorption of -rays in the cosmic diffuse radiation field. The most stringent constraints on the EBL density at m stem from observations with the H.E.S.S. telescope system of the high-redshift, hard-spectrum TeV-blazar 1ES 1101-232 Aharonian et al. 2006a . The most distant (redshift ) TeV-blazars established to date are 1ES 1101-232 (), 1ES 1218+304 (), 1ES 1011+496 (), 1ES 0347-121 (), 1ES 0229+200 (), H 2356-309 (), H 1426+428 (), PKS 2155-304 (), 1ES 1553+113 (: Perlman et al., 1996; Falomo & Treves, 1990; Aharonian et al. 2006b, ).
Extreme HBLs, as is the case for most very high energy (VHE) blazars, are characterized by their spectral extension to extremely high particle energies. TeV-blazars have been regularly observed in the past by X-ray instruments, however, not many have been detected so far in the hard X-ray range where the highest energy particles leave their imprints. The sensitivity reached by the hard X-ray detector HXD onboard the Suzaku satellite allowed for the first time to study in detail possible new spectral features and curvature at keV, even in a blazar quiet state, which may help understanding the properties and origin of the VHE emission.
We report here on our ksec Suzaku observations on each of two more distant TeV-blazars known to date: 1ES 1101-232 and 1ES 1553+113. These observations were covered by quasi-simultaneous observations with the H.E.S.S. telescope system and the MAGIC telescope. None of these sources have shown in the past significant variability in the TeV-band Aharonian et al. 2006a ; Aharonian et al. 2006b , likely owing to their low flux close to the detection limit of the TeV facilities.
The paper is organized as follows: We provide a brief overview of both TeV-blazars in Sect. 2. Sect. 3 is devoted to a technical description of our Suzaku data analysis and its results. In Sect. 4 we report on the quasi-simultanuous multiwavelength coverage during the Suzaku observations of 1ES 1101-232 and 1ES 1553+113. In Sect. 5 we discuss our results in particular in context to their historical behaviour. Sect. 6 summarizes the main results of this work.
2 The VHE blazars 1ES 1101-232 and 1ES 1553+113
The X-ray selected BL Lac object (XBL) 1ES 1101-232, hosted by an elliptical galaxy at redshift with estimated magnitude , one of the brightest BL Lac hosts known so far, is presumably located in a galaxy cluster. It has been detected by various X-ray instruments: the Ariel-5 X-ray satellite discovered this source, HEAO-1, Einstein, ROSAT, BeppoSAX, RXTE, XMM, SWIFT, Suzaku (this paper) just to name a few. Its strong X-ray-to-optical flux ratio led to the classification of an XBL Scarpa & Falomo (1997), which has later been revised to a high-frequency peaked BL Lac object Donato et al. (2001) within the HBL-LBL scheme Giommi et al. (1995). The radio maps of 1ES 1101-232 show a one-sided, not well-collimated jet structure at a few kpc distance from the core Laurent-Muehleisen et al. (1993). The optical core emission is typically varying on time scales of months (e.g. Remillard et al., 1989), although occasional intraday flares have been reported Romero et al. (1999). Based on the typical broadband characteristics of VHE AGN several authors have predicted this source to be a TeV-blazar (e.g. Wolter et al., 2000; Costamante & Ghisellini, 2002). Indeed, it was recently detected by the H.E.S.S. Cherenkov telescope system Aharonian et al. 2006b . At MeV-GeV energies, however, EGRET reported only an upper limit from 1ES 1101-232 Lin et al. (1996).
Owing to the non-detection of any lines nor resolving its host galaxy the redshift of the XBL/HBL 1ES 1553+113 is to date still unknown. Redshift limits, though, have been imposed either through HST results (: Sbarufatti et al., 2005) on the assumption that the nucleus’ host is a typical BL Lac host, or through arguments involving TeV photon absorption in the EBL ((, : Aharonian et al. 2006b, ); (: Mazin & Göbel, 2007)) and no anomalies in the source intrinsic high energy SED. Like 1ES 1101-232, 1ES 1553+113 is a strong X-ray source and has been visited by several X-ray instruments, however, focusing mainly towards the soft part of its X-ray spectrum (Einstein, ROSAT, BeppoSAX, RXTE, XMM). Its weak radio flux (a few tens of a mJy at 5GHz: Falomo & Treves, 1990) among the blazar class leads to its classification of an XBL and HBL Falomo & Treves (1990); Donato et al. (2005). Results from a 3-weeks multifrequency campaign in 2003 covering the radio-to-X-ray range Osterman et al. (2006) where a strong X-ray flare was detected, indicate an extremely high synchrotron cutoff energy, superceding in this respect even well-known extreme HBLs like Mkn 421, Mkn 501 or PKS 2155-304. This places 1ES 1553+113 right at the frontline of the class of extreme HBLs Rector et al. (2003). Despite its unknown redshift, it was considered as a promising source for detection at TeV energies based on its spectral broad band properties. The H.E.S.S. collaboration reported recently its discovery at VHEs with a integral flux detection on a level, and a very soft spectrum Aharonian et al. 2006b . This was confirmed by MAGIC Albert et al. 2007a . The Third EGRET catalog Hartman et al. (1999) does not list this blazar as identified in the MeV-GeV energy band.
3 Suzaku observations and data analysis
The two objects have been observed by Suzaku’s X-ray Imaging Spectrometer (XIS: Koyama et al., 2007) and the Hard X-ray Detector (HXD: Takahashi et al., 2007) in May 25-27 2006 for a total of 53.1 sec on-source for 1ES 1101-232, and in July 24-25 2006 for a total of 41.1 sec on-source for 1ES 1553+113. XIS is a CCD instrument with three front-illuminated and one back-illuminated CCD camera at the focal plane of the four X-ray telescopes (XRT: Serlemitsos et al., 2007), and sensitive in the energy range 0.2-12 keV. During our observations of the two TeV-blazars, XIS was operated in the and observation modes. No charge injection procedures were carried out during these observations.
The HXD consists of an array of detectors (well units) and 20 surrounding crystal scintillators for active shielding. Each unit consists of four Si PIN diodes (PIN), sensitive in the 10-70 keV energy range, and four GSO/BGO phoswitch counters (GSO) for detecting photons in the 40 - 600 keV regime. Since the focus of these observations were the hard part of the X-ray energy regime, the HXD was chosen as the nominal point to ensure optimal sensitivity.
One day before our Suzaku observations of 1ES 1101-232 started, the HXD team started changing the bias voltage, affecting potentially HXD’s UNIDIDs 0 to 3, to suppress the rapid increase of noise events noted at this time. In particular, on May 26 2006, the bias voltage of the HV-P0 was increased in two steps, affecting the measurements of the PIN during the 1ES 1101-232 observations: we found two huge background ’flares’ in UNIDID 1, towards the end of this observation beyond MJD 53941.7.
Our data analysis is based on the version 2 processed data with the standard mkf filtering, and using tools of the HEASoft version 6.4. The CALDB release from February 1 2008 contains the calibration files used in this analysis. For the data reduction we followed the “The Suzaku Data Reduction Guide”111http://suzaku.gsfc.nasa.gov/docs/suzaku/analysis/abc/ and specifically Ver. 2.0 if not noted otherwise.
3.1 XIS data reduction and analysis
We started the XIS data analysis with the unscreened version 2 of the data. We computed the XIS pulse invariant and grade values and updated the CTI calibration via the tool xispi. The subsequent reduction, including cleaning of hot and flickering pixels, selection of grades 0, 2, 3, 4, and 6, filtering out the epochs of high background (e.g. due to the satellite crossing through the South Atlantic Anomaly) was performed using the tool xselect (and specifically a script xisrepro. Source events were then extracted in a circle around the source with radius of . The extraction of background events were performed from a region devoid of any obvious X-ray sources. We ensured that the use of other background regions within the XIS field does not significantly affect the results from our spectral analysis. We generated the corresponding response (rmf) and auxillary (arf) files by utilizing the tools xisresp and xissimarfgen, using the default energy steps; the latter is a Monte-Carlo code provided by the Suzaku team, and it also accounts for the hydrocarbon contamination that has been built-up in the optical path of each XIS sensor. With the most recent calibration the spectra do not show calibration anomalies down to keV, which we therefore included into the analysis. Our spectral results do not change significantly even when limiting the XIS bandpass to above 0.7 keV.
3.2 HXD data reduction and analysis
As was the case for the XIS, here we also used the version 2 processed data. Here, we started with the filtered data, where standard cleaning criteria were used; however, for the extraction of the spectrum of 1ES 1101-232 we selected only the data before MJD 53941.7 to avoid any contamination with the two huge background flares. We also extracted the non-X-ray background spectrum from the background files provided by HEASARC, but applied the same time selection criteria as to the source files. The source spectrum was dead-time corrected using the tool hxddtcorr; we note that the application of hxddtcorr resulted in a live time of 93.4% for the 1ES 1101-232 and 93.8% for the 1ES 1553+113 observations. We applied analogous procedure to the GSO data, but since neither source was detected in the GSO, we did not use those data in the subsequent analysis.
3.3 Results
We detected 1ES 1101-232 and 1ES 1553+113 with Suzaku up to energies above 30 keV. This is the highest X-ray energy measurement so far obtained for 1ES 1553+113.
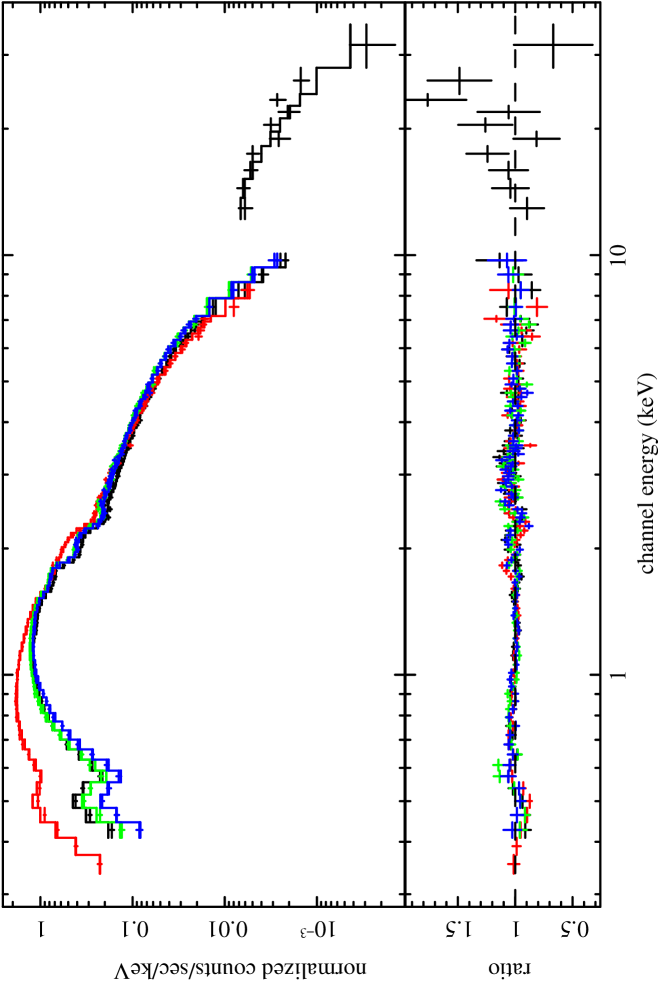
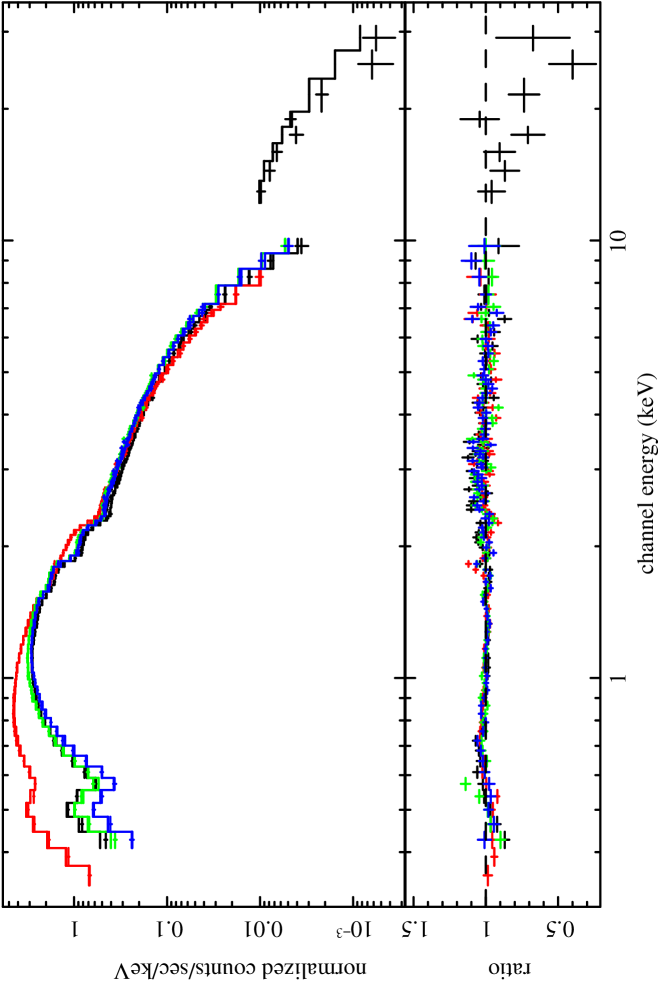
The combined XIS-PIN data has been fitted to both, simple and broken power laws. For both sources we found a significantly improved -value when fitting to a broken power law as compared to a single power law. The absorbing column densities were fixed to the respective Galactic values here ( cm-2 for 1ES 1101-232, cm-2 for 1ES 1553+113). The best-fit parameters and goodness-of-fits are summarized in Table 1. Both sources show the break to be around 1.4 keV with 1ES 1553+113 having a somewhat steeper overall spectrum than 1ES 1101-232. We determined the average 2-10 keV flux from 1ES 1101-232 to be erg cm-2s-1, and the 10-30 keV flux to be erg cm-2s-1 (source flux only). This is the lowest flux level so far measured from this source. The average 2-10 keV source flux from 1ES 1553+113 is erg cm-2s-1, about a factor 2 higher than for 1ES 1101-232. The 10-30 keV flux is at erg cm-2s-1. This X-ray flux level is comparable to the 2001 XMM data, and lies at an intermediate value between the so far highest (found during the 2005 SWIFT observations) and lowest (detected during the 2003 RXTE campaign) flux state of 1ES 1553+113. The best-fit and residuals for both sources are shown in Fig. 1 and 3.
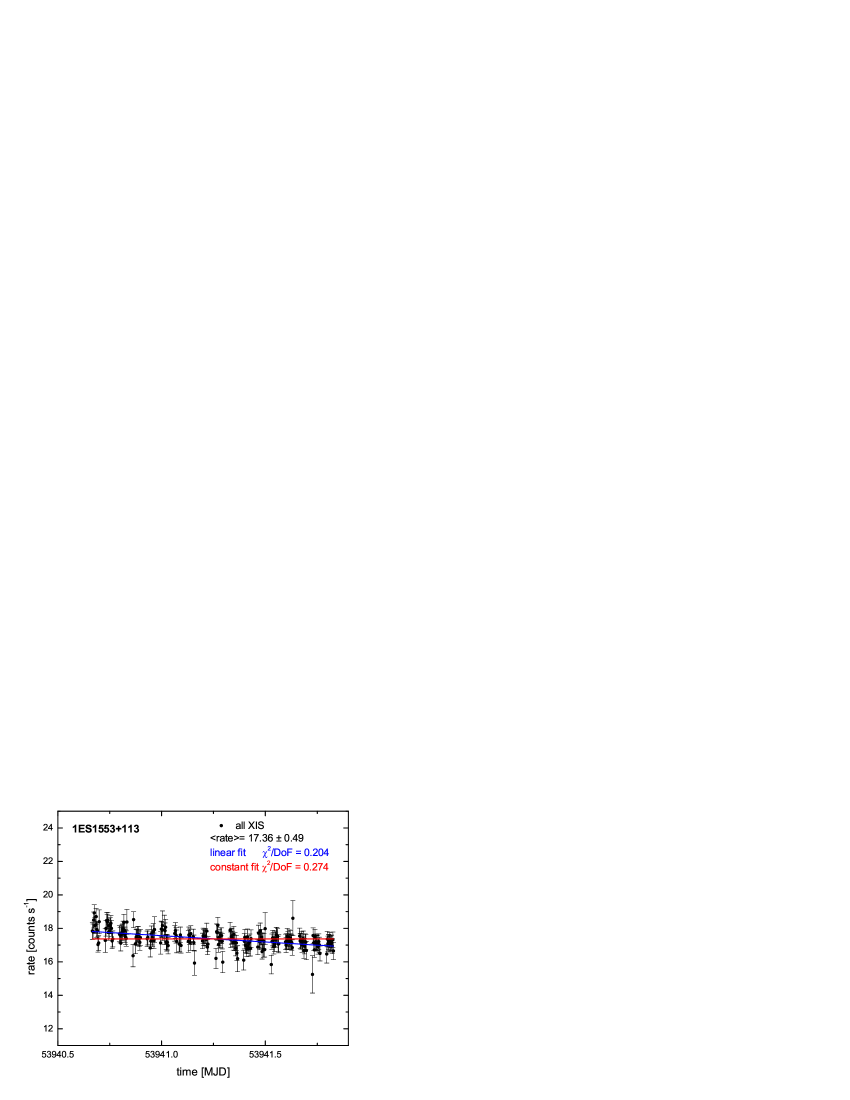
We tested for variability in both Suzaku data sets using the method. No flux variability on subhour or intraday time scales were found (Fig. 2, 4). The lack of variability, otherwise often observed on these time scales during high flux states in TeV-blazars such as Mkn 501, Mkn 421, PKS 2155-304, etc., may suggest the sources to have lingered at a quiescent activity level in 2006.
Log-parabolic shapes have been proposed to provide a better description of X-ray spectral shapes in HBL-type AGN (e.g. Perlman et al., 2005). A -test to the shape of the combined XIS-PIN spectrum revealed a statistically comparable goodness of fit as compared to the broken power law representation up to the highest reported energy point for both sources. Best-fit parameters for the log-parabolic shapes are in Table 1. Although the best-fit curvature value for both sources is similar, we note a tendency of a further steepening in the PIN data with respect to the model (log-parabolic or broken power law shape) describing the 1ES 1553+113 data set (see e.g. Fig. 3). A log-parabolic shape spanning the whole decline of the synchrotron component can be the result of energy-dependent acceleration (e.g. Protheroe & Stanev, 1999; Massaro et al., 2004), episodic Perlman et al. (2005) or fluctuating particle energy gains Tramacere et al. (2007). If this interpretation holds, the present result indicates acceleration operating also in a quiet state of source activity. According to Protheroe & Stanev (1999) the spectral shape of 1ES 1101-232 is in agreement with a cutoff due to either particle energy losses or a finite size of the emission region for an energy dependence of acceleration and/or escape or weaker.
Our investigation of the Suzaku data found no convincing signatures of spectral hardening up to the highest detected X-ray energy point, as would be expected from a synchrotron emitting Compton loss dominated source in an energy range affected by the Klein-Nishina decline of the cross section, or the onset of the -ray component. We therefore conclude that the measured X-ray radiation is entirely due to the synchrotron component, and that losses are either not Compton loss dominated in the X-ray band, or are still in the Thomson loss regime.

| Object | |||||||
|---|---|---|---|---|---|---|---|
| (d.o.f.) | (d.o.f.) | ||||||
| 1101-232 | 1.11 (3328) | 1.10 (3329) | |||||
| 1553+113 | 1.08 (4354) | 1.06 (4355) |
4 Simultaneous multifrequency observations
4.1 Observations in the optical band
The KVA observatory on La Palma is monitoring 1ES 1553+113 regularly since early 2006. KVA observed this source between 21 and 27 July 2006 in the R-band Albert et al. (2008). The KVA pointing date that falls into the Suzaku observing time is MJD=53941.43495. The measured flux was corrected for Galactic extinction using a R-band extinction of mag Schlegel et al. (1998). Since a host galaxy contribution for 1ES 1553+113 is negligible, no host galaxy correction for the flux has been made. A flux value of mJy was derived.
4.2 Simultaneous TeV-observations
1ES 1101-232 was visited by the High Energy Stereoscopic System (H.E.S.S.) atmospheric Cherenkov telescope array several times between 2004 and 2007 Aharonian et al. 2007a ; Aharonian et al. 2006a ; Benbow et al. (2007). In May 2006 H.E.S.S. observations were scheduled to cover the epoch of the Suzaku measurements towards 1ES 1101-232. The 4.3 h good-quality data revealed only a marginal detection of (51 excess events) and a corresponding flux of cm-2s-1 Benbow et al. (2007); Aharonian et al. 2008b . The complete 2006 data set showed a excess in 13.7 h live time. In comparison, the 2004-2005 TeV-data on this source revealed an integral flux of cm-2s-1 () Aharonian et al. 2007a . The low X-ray flux level during the Suzaku compaign was therefore accompanied with a comparable VHE flux when compared to the 2004/05 activity state. All 2004/05 VHE data are compatible with a differential power law spectrum cm-2 s-1 TeV-1 Aharonian et al. 2007a .
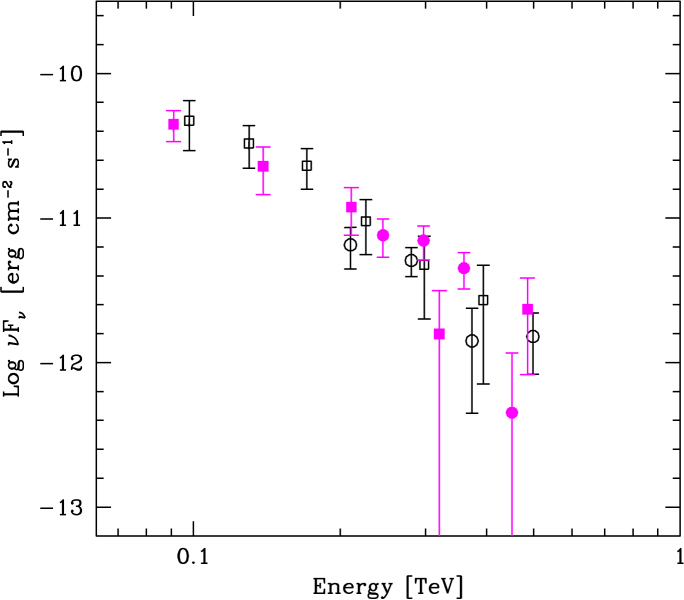
The Suzaku observations of 1ES 1553+113 in July 2006 were also accompanied by simultaneous VHE observations, with H.E.S.S. and MAGIC. The total available live time data in July 2006 from H.E.S.S. encompasses 10.1 hours, out of which 3.1 hours live time observations were carried out simultaneously with the Suzaku pointing Aharonian et al. 2008a . An excess of 101 events were found, corresponding to a significance of . For the total July 2006 data the significance increased to with an integrated flux of erg cm-2 s-1 Aharonian et al. 2008a . A daily light curve did not show any convincing evidence of variability, as did a run-by-run light curve from the Suzaku epoch observations (see Fig. 5). The low significance found by the H.E.S.S. observations during the Suzaku campaign did not justify to produce a reliable fit to the -ray data Aharonian et al. 2008a . The whole July 2006 data set was reported with a power law fit with spectral photon index . The spectral data points derived from this epoch are shown in Fig. 6. This is in very good agreement (within ) with the TeV-spectra derived from the past observations in 2005 and 2006. The combined 2005/2006 data set is compatible with a spectral index of Aharonian et al. 2008a .
In July 2006 MAGIC was also observing 1ES 1553+113 for a total of 9.5 hours. These observations suffered from a sand-dust coming from the Sahara (Calima). The effects of this weather condition on the data has been corrected using extinction measurements from the Carlsberg Meridian Telescope (Albert et al., 2008, for details). With a live time of 8.5 hours the signal significance reached Albert et al. (2008), enabling the compilation of a VHE spectrum for this time span. The spectrum above GeV can be fitted by TeV-1s-1cm-2, and is in good agreement with the corresponding H.E.S.S. data points of July 2006. For the 2 days of contemporaneous X-ray/VHE coverage the MAGIC data allowed only a result in 2.4 hours live time. The spectral data points from these 2 days observations lie within the uncertainties of the overall July 2006 spectrum, which therefore will be used in the following as an adequate description of the VHE spectrum for the time of the Suzaku observation.
Fig. 7 shows the spectral data points of the July 2006 MAGIC measurements together with the H.E.S.S. data points for this time span, covering the energy range of GeV. A fit to the combined H.E.S.S. and MAGIC data points during the July 2006 observations revealed a simple power-law representation to be adequate. When compared to broken power law with exponential cutoff spectral shapes in the 90-500 GeV energy range, the goodness of fit does not improve noticeable. The day-by-day light curve does not show any signs of variability (see Fig. 5), although the average flux GeV lies systematically above the corresponding H.E.S.S. GeV flux (because most of the VHE signal stems from below GeV). Also MAGIC confirms the surprising stability of the spectral shape of this source, even when compared to year 2005 data Albert et al. (2008).
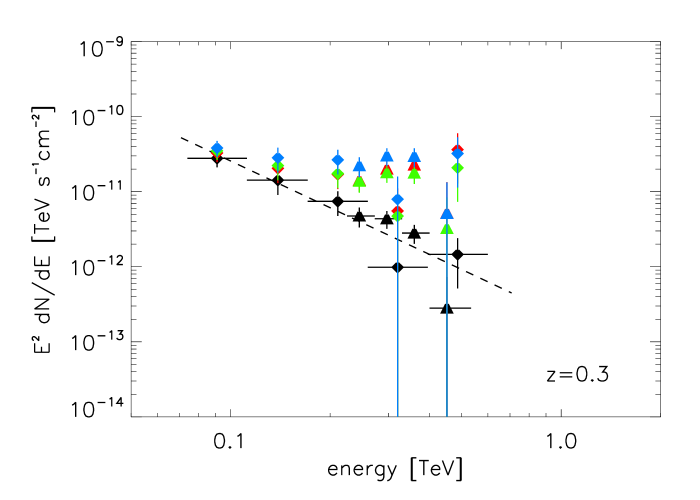
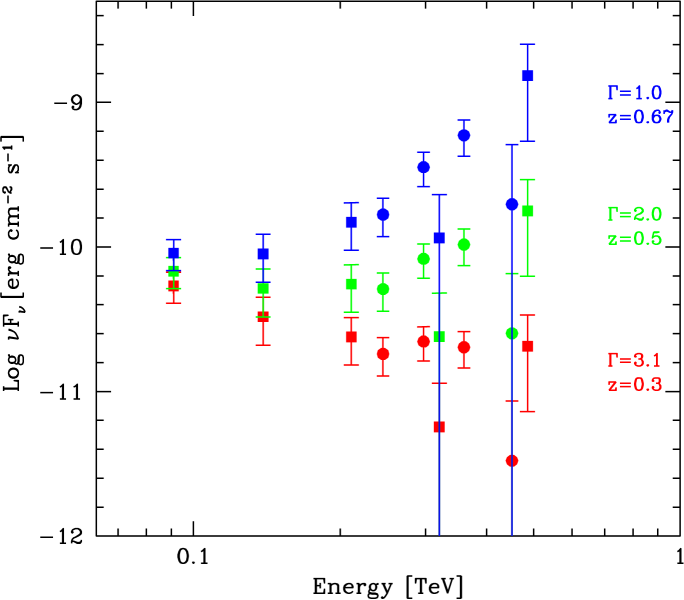
Up to now 1ES 1553+113 is lacking any confirmed redshift measurement. The initially proposed redshift of turned out an mis-interpretation of line data Falomo & Treves (1990). Constraints have been set only from indirect methods, e.g. from limits on host galaxy images Urry et al. (2000); Treves et al. (2007) one arrives at . Recent spectroscopic observations improved here to by deriving limits of the host galaxy absorption lines Sbarufatti et al. (2006). Gamma ray absorption in the EBL followed by pair production in the VHE range offers a further possibility to infer on redshift limits: The re-construction of the emitted -ray spectrum from the observed one with imposing limits on the hardness of the intrinsic source spectrum leads to the sought after redshift constraint. Such and similar concepts have been applied to past observations, and yielded Aharonian et al. 2006b ; Albert et al. (2008), and Mazin & Göbel (2007).
In Fig. 7 we show the de-absorbed TeV-spectrum of 1ES 1553+113 for a source redshift of and using various models for the EBL: the P0.45 flux level from Aharonian et al. (2006a), the “best-fit” model of Kneiske et al. (2004) and the latest version of the baseline model of Stecker et al. (2006). The P0.45 flux level corresponds to a EBL flux density with a phenomenological spectral shape that describes the EBL data points satisfactorily on the level of the integrated galaxy counts. All models support about the same m EBL-flux density, however, differ in their extension to lower and higher energies. Note that the baseline model flux at m is not based on observational constraints, but rather represents the extension of the Stecker et al. (2006) diffuse IR background calculation into the optical/UV band, and should therefore be considered with caution in this energy range. The resulting power spectra appear all at around photon index when de-absorbed by either model with the baseline model providing the highest intrinsic VHE flux level up to GeV. Still all considered EBL models lead to comparable photon powers delivered through the high and low energy SED humps. Stepping up in redshift the de-absorbed spectra are getting harder quickly. At a source redshift of a spectral photon power law is reached at GeV (see Fig. 7), the asymptotically hardest spectrum from any conservative particle acceleration scenario. We therefore consider a redshift of as unlikely for 1ES 1553+113 if the EBL flux density is at the lowest possible value (integrated galaxy counts). A search for the redshift that corresponds to an intrinsic photon spectrum concludes at (see Fig. 7). This represents the borderline for the VHE bump to lie at either tens of GeVs or TeV. When considering redshifts , the location of the VHE SED peak moves to GeV with an estimated power output at -rays again comparable to the synchrotron power peak. The intrinsic photon spectral index is then .

5 Discussion
5.1 Historical X-ray behaviour of 1ES 1101-232 and 1ES 1553+113
1ES 1101-232 has been detected during the past 15 years by a range of X-ray instruments, both covering the soft (ROSAT, XMM) and extending into the hard X-ray range (BeppoSAX, RXTE, SWIFT) at various sensitivity levels. Except for the continuous monitoring by RXTE’s ASM and the 19.6 ksec monitoring by XMM Aharonian et al. 2007a , most observations were carried out in snapshot mode, with each observation encompassing typically 1-5 ksec. The continuous Suzaku observation presented here constitutes therefore the first long ( ksec) high-sensitivity X-ray data set of this source. None of the past observations showed significant short time variability (hour). Although the continuous mode observations of Suzaku generally allow to probe intraday variability, we find no significant variability of this time scale during our observations. Year-by-year variations as derived from the historical X-ray light curve are less than a factor . The highest ever measured X-ray flux level has been reported for 2005 from the RXTE-PCA measurements Aharonian et al. 2007a . There, in eleven consecutive nights the source was observed each night for ksec. No hints for strong flux variability were found, and the AGN was categorized to be in a non-flaring state. If this is the case, 1ES 1101-232 was likely never observed in a flaring state during the past 15 years. Only 4 months later SWIFT saw the source in a smooth decline of flux level with no sub-hour variations (e.g. Massaro et al., 2008). Our Suzaku observations, made approximately months later, found the lowest ever measured X-ray flux from 1ES 1101-232.
So far, essentially all sensitive X-ray observations of 1ES 1101-232 prefer a curved or broken power-law representation instead a simple power-law (e.g., Perlman et al., 2005), independent of flux level and - as demonstrated in this work - extending into the hard X-ray range. If interpreted as signatures of the particle energy gain process, one may conclude that acceleration takes place at all flux levels observed so far. In all cases there were no indications for a significant amount of X-ray absorbing material in the line-of-sight beyond the Galactic absorption column density.
The average spectrum during our Suzaku observations was quite similar to the one from the 20% higher flux XMM observations in 2001 (: Perlman et al., 2005), where also no significant variability was noticed. The 1997/98 BeppoSAX observations Wolter et al. (2000) had a similar value of the break energy at a factor higher flux level. The flux reported from the 2004 observations with XMM was comparable to the one measured by BeppoSAX in 1997, however, the spectral break shifted to lower energies by a factor . Because of the lacking soft X-ray sensitivity, the PCA coverage of 1ES 1101-232 in 2005 revealed a break energy at much higher energies ( keV). If the 1-8 keV X-ray spectral index is compared to the observed flux level at each observation, no statistically convincing indication for a flux-index correlation is found (Spearman rank correlation coefficient with chance probability , Kendall’s with ). Comparing, e.g., the XMM measurements carried out in 2001 and 2004, no significant spectral changes within the uncertainties occured despite a factor higher flux in 2004. On the other side, the BeppoSAX observations revealed a spectral softening from the higher flux state in 1997 to the lower flux state in 1998. When compared to the high flux RXTE data from 2005 a noticable softening occured despite the overall high flux level. If following the evolution of the spectrum versus flux, no clear spectral hysteresis could be found. In summary, it seems that spectral changes observed from annual visits of this source do not follow particular patterns or relations with respect to flux changes. The overall spectral changes lie within a rather narrow range between and 2.5 for the 1-8 keV photon spectral index.
The measured so far comparably long X-ray variability time scale in 1ES 1101-232 may imply that this source was observed only in the quiescence over the last years. If one assumes the measured activity states from one year to the other to be not causally related, the annual measurements may then be treated as an independent ensemble of measurements from an HBL. In particular, it seems reasonable to probe the behaviour in the peak luminosity-peak energy diagram within the available HBL range. For a robust determination of the peak energy, low energy data, preferably in the IR/optical/UV range, are necessary. Giommi et al. (2005) used optical data from the literature in combination with the BeppoSAX measurements, while both XMM pointings had the advantage of simultaneous optical coverage with the Optical Monitor (OM) onboard the satellite, and SWIFT the onboard UVOT instrument. We did not find any convincing anti-correlation between peak energy and peak flux within the available 6 ensemble members ( with , with ).
1ES 1553+113 is known as a generally X-ray soft, bright HBL with only modest X-ray variability (factor ). SWIFT in 2005 Tramacere et al. (2007); Massaro et al. (2008) achieved a detection of this source up to only 8 keV, despite its high flux level in October 2005 that was reached within half a year from a 3.5 times lower flux level. BeppoSAX in 1998 Donato et al. (2005) saw it only with the LECS/MECS at a relatively low flux level, no detection with the PDS was possible. With our Suzaku observation, 1ES 1553+113’s spectrum could finally be measured up to 30 keV while descending from the 2005 high flux level. Like for 1ES 1101-232, past X-ray observations encompass mostly snapshot observations of typically 3-10 ksec each. RXTE’s observation campaign in 2003 Osterman et al. (2006) involved visits to the source about 3 times per day for ksec, for a total period of 21 days. During this time a very smooth rise in flux up to 3 times the lowest flux level was observed. No hints of subhour variations were recorded in any of the past observations. With our ksec continuous Suzaku measurements we tested for intraday variability, but obtained a null result also at this intermediate flux level which was quite comparable to the 2001 flux recorded by XMM Perlman et al. (2005).
No significant differences were found between the spectra reported from the 2001 and 2006 observations: the average spectrum during our Suzaku observations was, within the uncertainties, in good agreement to the one from the XMM observations in 2001 (: Perlman et al., 2005). The surprising spectral stability of this source holds even for the low flux state recorded with RXTE in 2003 Osterman et al. (2006), despite the factor 5 difference in flux. Even within the tripling of the flux during the PCA observations spectral changes were not significantly beyond their uncertainties. In particular, any systematic spectral trend with changing flux is not apparent, neither on a year-by-year time scale nor within the rising part of the RXTE monitoring data within their admittedly large uncertainties: as is the case for 1ES 1101-232, the photon index above keV typically lingered around 2 and 2.5 even during flux increases by a factor or more. Those modest spectral changes together with the smoothness of the long-term light curve may suggest that explosive events are among the least likely scenarios to account for the observed flux variations here.
The 1998 BeppoSAX observations Donato et al. (2005) had a lower break energy ( keV) at a factor lower flux level as compared to the 2006 Suzaku observations. SWIFT detected 1ES 1553+113 in both, a rather low flux state (April 2005) and relatively high flux level (October 2005), but with a surprisingly stable peak energy of keV in the XRT spectrum (e.g. Massaro et al., 2008), times lower than the Suzaku data from 2006 imply. The flux reached during the April 2005 observations with SWIFT was comparable to the one measured by BeppoSAX in 1998, however the peak energy from the XRT data shifted to lower energies by a factor . No break energies were reported from the 2003 RXTE/PCA data Osterman et al. (2006).
Following the argumentation above we probe here the dependence between peak luminosity and peak energy also for 1ES 1553+113, and utilize preferably data from the IR/optical/UV range to complement the X-ray band measurements. Among the past observations only the XMM and SWIFT pointings were quasi-simultaneous measurements with optical/UV available, namely OM, UVOT and ROTSE data, respectively. We use here our Suzaku observations with the data from the quasi-simultaneous optical coverage by the KVA optical telescope for a combined X-ray - optical spectral fit. A log-parabolic shape was used to determine the peak energy to keV with parameters and . Note, however, that this representation does only give a due to the large weight given to the only optical point (that has a small uncertainty) with respect to the many X-ray data points. More lower energy points would clarify this. We did not use the peak values given for the 2003 RXTE campaign for this undertaking to assure for a sample with equally determined peak energies: the cm radio data from Osterman et al. (2006) for determining the peak energy would give too much weight towards the longer wavelengths when compared to a procedure where only optical/UV in combination with the X-ray data are used. The peak energies from the UVOT measurements range from to 0.02 keV from the high to the low flux state, respectively. The latter is in very good agreement with the values derived from the XMM 2001 observations. Also for 1ES 1553+113 any convincing systematic correlation between peak energy and peak flux within the very limited sample of 4 ensemble members is lacking evidence ( with , with ). This may indicate that particle acceleration up to the maximum energy is not preferentially limited by Compton losses if beaming does not change significantly. Indeed, because of the lack of sufficiently dense radiation fields in HBL-type AGN, synchrotron losses may dominate the radiative particle loss channel. The absence of a link between the peak luminosity and peak energy can then be understood if either an increase of the jet’s synchrotron radiation field is not connected to an increase of the magnetic field strength alone on year time scales, or expansion losses and/or escape from the emission region sets a boundary to the maximum electron energy at the so far observed activity states in 1ES 1101-232 and 1ES 1553+113.
5.2 Spectral energy distributions
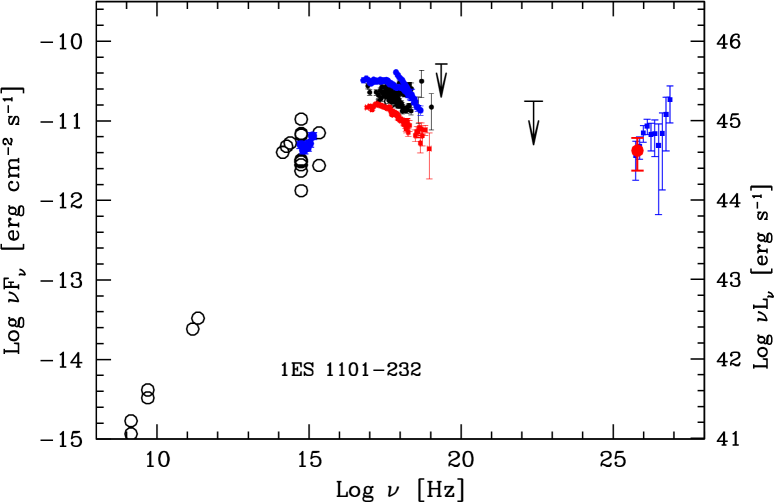
The overall SED of 1ES 1101-232, including the Suzaku spectrum obtained by us and the simultaneous H.E.S.S. data is shown in Fig. 9. If corrected by the minimal EBL (P0.45 from Aharonian et al. 2006a, ), comparable power is emitted at -rays than at the synchrotron hump with a -ray peak beyond TeVs at the time of the quasi-simultaneous Suzaku – TeV observations. In the framework of a simple one-zone SSC model a (assumed uniform) field strength of sub-equipartition strength can then be deduced. Alternatively, further target photon fields in the vicinity of the -ray emission zone can lead to an enhanced -ray photon output. In hadronic blazar emission models TeV-emission is the result of either reprocessed cascade emission initiated by pairs and/or photons produced in photomeson interactions, or by proton and/or -synchrotron radiation (e.g. Mücke & Protheroe, 2001; Mücke et al., 2003). In environments of weak ambient photon fields proton-photon interactions constitute a correspondingly sub-dominant contribution to the -ray component, which then leaves proton synchrotron (or curvature) radiation as the main -ray producer.
TeV observations of 1ES 1101-232 were used previously Aharonian et al. 2006a to set the most stringent limits on the EBL at m using spectral considerations Aharonian et al. 2006a . These limits could not be improved owing to the limited quality from the low flux TeV-data from 2006.
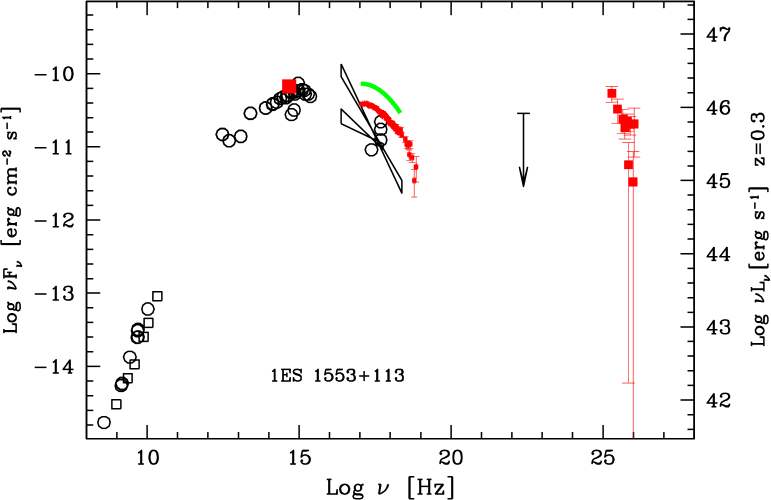
The overall SED of 1ES 1553+113 with the contemporaneous Suzaku, VHE (H.E.S.S., MAGIC) and optical (KVA) data is shown in Fig. 10, complemented with historical ones from the literature. Using a minimal EBL (P0.45) for de-absorption, approximately equal or more power is emitted at -rays than at the synchrotron hump with a -ray peak at sub-TeVs. In the framework of a simple one-zone SSC model, this ratio indicates sub-equipartition field strengths in the emission region. Furthermore, if the same electrons emit TeV- and X-ray photons co-spatially, then the intrinsic spectral index at VHEs must not be harder than at X-ray energies. For an EBL density at the galaxy counts flux level this is the case for . Alternatively, external photon fields may contribute to the target photon fields for inverse Compton scattering, or hadronic emission models may be at work here.
6 Summary
Continuous ksec Suzaku pointings towards each of the two distant TeV-blazars, 1ES 1101-232 and 1ES 1553+113, were carried out in May and July 2006, respectively, with quasi-simultaneous coverage at VHEs (H.E.S.S., MAGIC). In this work we presented the Suzaku data set, and set them into context to the VHE observations and to their behaviour in the past. Our findings can be summarized as follows:
-
•
Suzaku observations in 2006 of 1ES 1101-232 and 1ES 1553+113 found both TeV-blazars in a non-active state. We detected both blazars from soft to hard X-rays up to keV, with 1ES 1553+113 measured to so far unprecedented energy in the synchrotron emission component.
-
•
The observed X-ray flux of 1ES 1101-232 is the lowest ever measured from this source.
-
•
The combined XIS and PIN spectra of both sources showed surprisingly similar spectral shapes. This may indicate a common physical mechanism as being responsible for such spectral signature. Both show indications of curvature, and can be equally well fitted by a broken power law or log-parabolic shape. This curvature is found to extend well into the hard X-ray band ( keV). Note, however, that the PIN data of 1ES 1553+113 indicates a steepening beyond the log-parabolic or broken power law model.
-
•
Simultaneous H.E.S.S. and MAGIC observations during the Suzaku epoch revealed no variability on any time scale probed by our data. H.E.S.S. obtained a weak detection () of 1ES 1101-232 at the low flux level observed also during previous years. The combined 1ES 1553+113 VHE spectrum ( GeV) did not show any significant changes with respect to historical VHE observations. Consequently, this data set did not allow to put further constraints on the EBL flux density.
-
•
1ES 1553+113 is unlikely to reside at a redshift even if the EBL is at the minimum flux density (inferred from integral galaxy counts).
1ES 1553+113 and 1ES 1101-232, -ray blazars with surprisingly mild variability at virtually all energies, but nonetheless produce photons up to the highest TeV energies. This can be contrasted to the prominent TeV-blazars like Mkn 501, Mkn 421 or PKS 2155-304 where rapid variations on subhour time scales at X- and TeV-energies have been detected at preferentially high activity states. Are there consequently various modes of high energy production in blazar jets realized in nature – rapidly explosive and quietly smooth ones – , or are we being mislead by observations at the instrument sensitivity limit and/or sparse sampling modes? Future high-sensitivity, dense sampling observations may answer this question.
References
- Albert et al. (2008) Albert, J. et al. (MAGIC collaboration), 2008, A&A, submitted
- (2) Albert, J. et al. (MAGIC collaboration), 2007a, ApJ, 654, 119
- (3) Albert, J. et al. (MAGIC collaboration), 2007b, ApJL, 666, L17
- Aharonian (2000) Aharonian, F.A., 2000, NewA, 5, 377
- (5) Aharonian, F.A. et al. (H.E.S.S. collaboration), 2005, A&A, 442, 895
- (6) Aharonian, F., et al. (H.E.S.S. collaboration), 2006a, Nature, 440, 1018
- (7) Aharonian, F.A. et al. (H.E.S.S. collaboration), 2006b, A&A, 448, 19
- (8) Aharonian, F.A. et al. (H.E.S.S. collaboration), 2007a, A&A, 470, 475
- (9) Aharonian, F.A. et al. (H.E.S.S. collaboration), 2008a, A&A, 477, 481
- (10) Aharonian, F.A. et al. (H.E.S.S. collaboration), 2008b, A&A, 478, 387
- Benbow et al. (2007) Benbow, W. & Bühler, R. (H.E.S.S. collaboration), Proc. ICRC 2007, Meridia, Mexico
- Blandford & Rees (1978) Blandford, R.D. & Rees, M.J., 1978, Physica Scripta, 17, 265
- Costamante & Ghisellini (2002) Costamante, L. & Ghisellini, G. 2002, A&A, 384, 56
- Donato et al. (2001) Donato, D., Ghisellini, G., Tagliaferri, G. et al., 2001, A&A, 375, 739
- Donato et al. (2005) Donato, D., Sambruna, R.M., Gliozzi, M., 2005, A&A, 433, 1163
- Falomo & Treves (1990) Falomo, R. & Treves, A., 1990, PASP 102, 1120
- Giommi et al. (1995) Giommi, P., Ansari, S.G., Micol, A., 1995, A&AS, 109, 267
- Giommi et al. (2005) Giommi, P., Piramomonte, S., Perri, M. & Padovani, P., 2005, A&A, 434, 385
- Gruber et al. (1999) Gruber et al. 1999, ApJ, 520, 124
- Hartman et al. (1999) Hartman, R.C., Bertsch, D.L. Bloom, S.D. et al., 1999, ApJS, 123, 79
- Ishida et al. (2007) Ishida, M., Suzuki, K., Someya, K., 2007, JX-ISAS-SUZAKU-MEMO-2007-11
- Kneiske et al. (2004) Kneiske, T.M., Bretz, T., Mannheim, K., Hartmann, D.H., 2004, A&A, 413, 807
- Koyama et al. (2007) Koyama, K., Tsunemi, H., Dotani, T., et al., 2007, PASJ, 59, 23
- Kokubun et al. (2006) Kokubun et al., 2007, PASJ, 59, 53
- Laurent-Muehleisen et al. (1993) Laurent-Muehleisen, S. A., Kollgaard, R.I., Moellenbrock, G.A., 1993, AJ, 106, 875
- Lin et al. (1996) Lin, Y.C., Bertsch, D.L., Dingus, B.L., et al., 1996, A&AS, 120, 499
- Mannheim (1993) Mannheim, K., 1993, A&A, 269, 67
- Massaro et al. (2004) Massaro, E., Perri, M., Giommi, P. & Nesci, R., 2004, A&A, 413, 489
- Massaro et al. (2008) Massaro, E., Tramacere, A., Cavaliere, A., et al., 2008, A&A, 478, 395
- Mazin & Göbel (2007) Mazin, D. & Göbel, F., 2007, ApJ, 655, 13
- Mücke & Protheroe (2001) Mücke, A. & Protheroe, R.J., 2001, APh, 15, 121
- Mücke et al. (2003) Mücke, A., et al., 2003, APh, 18, 593
- Osterman et al. (2006) Osterman, M.A., Miller, H.R., Campbell, A.M., et al., 2006, AJ, 132, 873
- Perlman et al. (1996) Perlman, E.S., Stocke, J.T., Wang, Q.D., et al. 1996, ApJ, 456, 451
- Perlman et al. (2005) Perlman, E. S., et al., 2005, ApJ, 625, 727
- Pohl & Schlickeiser (2000) Pohl, M. & Schlickeiser, R., 2000, A&A 355, 395 & Erratum: A&A, 355, 829
- Protheroe & Stanev (1999) Protheroe, R.J. & Stanev, T., 1999, Astropart. Phys., 10, 185
- Reimer et al. (2006) Reimer, A., Costamante, L., Madejski, G. & Reimer, O., in: proceedings of the conference ”The Extreme Universe in the Suzaku Era”, Kyoto, 2006.
- Scarpa & Falomo (1997) Scarpa, R. & Falomo, R., 1997, A&A, 325, 109
- Rector et al. (2003) Rector, T.A., Gabuzda, D.C., Stocke, J.T., 2003, AJ, 125, 1060
- Remillard et al. (1989) Remillard, R.A., Tuohy, I.R., Brissenden, R.J.V., et al., 1989, ApJ, 345, 140
- Romero et al. (1999) Romero, G.E., Cellone, S.A., Combi, J.A., 1999, A&AS, 135, 477
- Sbarufatti et al. (2005) Sbarufatti, B., Treves, A., Falomo, R., 2005, ApJ, 635, 173
- Sbarufatti et al. (2006) Sbarufatti, B., Treves, A., Falomo, R., et al., 2006, AJ, 132, 1
- Schlegel et al. (1998) Schlegel, D.J., Finkbeiner, D.P., Davis, M., 1998, ApJ, 500, 525
- Serlemitsos et al. (2007) Serlemitsos, P.J., Soong, Y., Chan, K.-W. et al., 2007, PASJ, 59, 9
- Stecker et al. (2006) Stecker, F.W., Malkan, M.A. & Scully, S.T., 2006, ApJ, 648, 774 and Erratum, ApJ, 58, 1392 (2007)
- Takahashi et al. (2007) Takahashi, T., Abe, K., Endo, M., et al., 2007, PASJ, 59, 35
- Teshima et al. (2007) Teshima et al. (MAGIC collaboration), 2007, 30th ICRC, Merida
- Tramacere et al. (2007) Tramacere, A., Giommi, P., Massaro, E., et al. 2007, A&A, 467, 501
- Treves et al. (2007) Treves, A., Falomo, R. & Uslenghi, M., 2007, A&A, 473, 17
- Ueda et al. (2003) Ueda, Y., Akiyama, M., Ohta, K. & Miyaji, T., 2003, ApJ, 598, 886
- Urry & Padovani (1995) Urry, C.M. & Padovani, P., 1995, PASP, 107, 803
- Urry et al. (2000) Urry, C.M., Scarpa, R., O’Dowd, M., et al., 2000, ApJ, 532, 816
- Wolter et al. (1998) Wolter, A., Comastri, A., Ghisellini, G., et al., A&A, 355, 899
- Wolter et al. (2000) Wolter, A., Tavecchio, F., Caccianiga, A. et al., 2000, A&A, 357, 429