The LBT Panoramic View on the Recent Star-Formation Activity in IC 2574
Abstract
We present deep imaging of the star-forming dwarf galaxy IC 2574 in the M81 group taken with the Large Binocular Telescope in order to study in detail the recent star-formation history of this galaxy and to constrain the stellar feedback on its HI gas. We identify the star-forming areas in the galaxy by removing a smooth disk component from the optical images. We construct pixel-by-pixel maps of stellar age and stellar mass surface density in these regions by comparing their observed colors with simple stellar populations synthesized with STARBURST99. We find that an older burst occurred about 100 Myr ago within the inner 4 kpc and that a younger burst happened in the last 10 Myr mostly at galactocentric radii between 4 and 8 kpc. We compare stellar ages and stellar mass surface densities with the HI column densities on subkiloparsec scales. No correlation is evident between star formation and the atomic H gas on local scales, suggesting that star formation in IC 2574 does not locally expel or ionize a significant fraction of HI. Finally, we analyze the stellar populations residing in the known HI holes of IC 2574. Our results indicate that, even at the remarkable photometric depth of the LBT data, there is no clear one-to-one association between the observed HI holes and the most recent bursts of star formation in IC 2574. This extends earlier findings obtained, on this topic, for other dwarf galaxies to significantly fainter optical flux levels. The stellar populations formed during the younger burst are usually located at the periphery of the HI holes and are seen to be younger than the holes dynamical age. The kinetic energy of the holes expansion is found to be on average 10 of the total stellar energy released by the stellar winds and supernova explosions of the young stellar populations within the holes. With the help of control apertures distributed across the galaxy we estimate that the kinetic energy stored in the HI gas in the form of its local velocity dispersion is about 35 of the total stellar energy (and 20 for the HI non-circular motions), yet no HI hole is detected at the position of these apertures. In order to prevent the HI hole formation by ionization, we estimate an escape fraction of ionizing photons of about 80.
Subject headings:
galaxies: dwarf — galaxies: individual (IC 2574) — galaxies: fundamental parameters — galaxies: photometry — galaxies: stellar content1. Introduction
It is common use to summarize with the term “star formation” how stars form from the neutral gas reservoir of a galaxy, and how they evolve and affect the ambient interstellar medium (ISM). Through their winds and supernova explosions, stars release kinetic energy and freshly synthesized metals to the ISM, with the possible effect of locally suppressing the formation of new stars and triggering it on somewhat larger scales across their host galaxy (i.e. stellar feedback). The global properties of disk galaxies have been extensively studied by now, to find that the average star formation rate (SFR) of a galaxy tightly correlates with its gas surface density (Schmidt 1959, 1963, Kennicutt 1998a,b). This important result alone, however, does not put strong constraints on the physics of star formation itself; it has been indeed shown that different mechanisms can produce this observed correlation (e.g. Silk 1997, Kennicutt 1998b, Elmegreen 2002). Moreover, our knowledge of star formation is mainly based on local disk galaxies, chemically and dynamically different from local, dwarf irregulars which sometimes undergo intense starbursts (Heckman 1998). Because of their size and low metallicity, dwarf galaxies are considered to be the local analogs to the galaxy population at high redshift, where starbursts are observed to be a rather recurrent phenomenon (Steidel et al. 1996, Pettini et al. 2001, Blain et al. 2002, Scott et al. 2002). Therefore, understanding the details of star formation in nearby galaxies of different Hubble types is crucial for boot-strapping theories of galaxy formation and evolution. This is now made possible by a new generation of instruments which provide high angular resolution throughout the whole spectral range, and especially for the observations of atomic H gas at 21 cm (HI). These new data allow us to spatially resolve the star-formation activity and the gas distribution within a galaxy, and to analyze their correlation on small scales and across a wide range of local, physical conditions. This approach has been recently applied by Kennicutt et al. (2007) to M 51a and to a larger sample of galaxies by Bigiel et al. (2008) and Leroy et al. (2008).
In this paper, we apply a similar method to the dwarf galaxy IC 2574 with the aim of describing its star-formation activity (i.e. age and mass surface density of its stellar populations) and comparing those properties with the interstellar medium (i.e. HI) on a 100 parsec scale.
IC 2574 (aka UGC 5666, DDO 81) is a gas-rich dwarf, actively forming stars in the M81 group. Miller & Hodge (1994) observed it in the H emission and identified 289 HII regions, each about 50 pc in diameter. The largest complex of star-forming regions is located in the North-East of the galaxy (also known as a HI supergiant shell, Walter et al. 1998, Walter & Brinks 1999). The authors estimated a global star-formation rate SFR 0.08 M⊙yr-1 and concluded that IC 2574 is forming stars at roughly its average rate. Follow-up spectroscopy on some HII regions in the NE complex by Tomita et al. (1998) showed that the H velocity field is chaotic in all regions except two (IC2574-I and IC2574-IV), which are characterized by a V-shaped velocity distribution. This V-shaped feature is usually representitative of stellar winds blowing out the interstellar medium. Interestingly enough, Drissen et al. (1993) found three candidate Wolf-Rayet (WR) stars in IC2574-I. WRs are evolved massive stars known to develop stellar winds stronger than O stars of the same luminosity and to make up as much as 50 of the total mass and kinetic energy released by all massive stars into the interstellar medium (cf. Leitherer, Robert & Drissen 1992). Therefore, their presence in IC2574-I can well explain the bulk motion observed in this HII region, and also date the region to be a few Myrs old, given that the WR phase is as short as 2 - 5 Myr (Robert et al. 1993).
The most intriguing property of IC2574 is, however, the spatial distribution of its neutral interstellar medium. The high-resolution VLA observations of IC 2574 have resulted in a very structured HI map, with 48 holes ranging in size from 100 pc to 1000 pc. These features appear to be expanding with a radial velocity of about 10 km s-1, which, in turn, defines dynamical ages and kinetic energies consistent with being driven by stellar winds and supernova explosions (Walter & Brinks 1999). In particular, the comparison of the HI map with ultraviolet (UIT) and optical images has revealed that the HII regions located in the NE complex are distributed along the rim of the HI supergiant shell, and the shell itself is devoided of neutral and ionized gas, possibly filled with hot X-ray gas (Walter et al. 1998). Stewart & Walter (2000) identified a star cluster within the supergiant shell with no associated H emission and with an age (11 Myr) comparable to the shell dynamical age of 14 Myr. They dated the H-emitting rim of the shell to be about 3 Myr old. The authors thus concluded that the HI supergiant shell was created by this star cluster and the shell expansion triggered the star formation activity along its rim. As pointed out by Walter & Brinks (1999), the occurrence of H emission along the rim of a HI feature is common to all the HI holes found in IC 2574, even if no remnant central star cluster has been identified so far. The question is then whether these holes are the result of stellar feedback as in the case of the supergiant shell or are produced by different mechanisms. The data collected so far for the Magellanic Clouds (Kim et al. 1999, Hatzidimitriou et al. 2005), M31 and M33 (cf. van der Hulst 1996) and Holmberg II (Rhode et al. 1999) offer very little support for a one-to-one correlation between HI holes and OB associations, although the kinetic energy of the hole expansion is consistent with the expansion being triggered by the total energy released by a single stellar population. One possible explanation that has been put forward is that at least some HI holes (especially those with no indication of recent star formation) may have been produced by mechanisms unrelated to young stars. For example, Loeb & Perna (1998) and Efremov, Elmegreen & Hodge (1998) suggest they arise from Gamma-Ray bursts. HI holes may also be produced by the collision of high-velocity clouds of neutral gas with the galactic disk (cf. Tenorio-Tagle 1980, 1981), or, more simply, by the intrinsic turbulence of the interstellar medium (Elmegreen & Efremov 1999, Dib, Bell & Burkert 2006). Rhode et al. (1999) proposed the intergalactic UV radiation field as an additional mechanism to create holes in the HI gas by keeping it ionized (at least in the outskirts of the galactic disk where the HI volume density is lower), while Bureau & Carignan (2002) suggested that the HI holes detected in Holmberg II may have formed by ram pressure from the intragroup medium.
One could also imagine that the lack of a one-to-one correlation between HI holes and OB associations may be due to the limited photometric depth of the data. For example, Rhode et al. (1999) reached a limiting magnitude 23 mag in Holmberg II and may have failed to detect fainter young stars (i.e. late B spectral types). We have taken advantage of the high sensitivity and wide field of view of the LBC Blue camera mounted on the Large Binocular Telescope to perform deep optical imaging, to study in detail the stellar populations in IC 2574 and to investigate the possible stellar origin of the HI holes in this galaxy. Our aim is to identify low-luminosity star clusters within these features, to establish how their stellar content may be different from any other position across the galaxy, and whether the energy budget of the young stars in the HI holes can account for the kinetic energy of these structures. This study allows us also to derive the star-formation history of IC 2574 locally, at different galactocentric radii and in correspondence with different HI column densities. The observations and the data reduction are described in Sect. 2. The high-resolution, optical morphology of IC 2574 is presented in Sect. 3, while the stellar ages and masses resulting from our dating technique are discussed in Sect. 4. We describe the stellar populations associated with the HI holes in Sect. 5. and draw our conclusions in Sect. 6.
2. Observations
The observations presented here were carried out with the Large Binocular Telescope (LBT) located on Mount Graham, Arizona, (Hill et al. 2006). IC 2574 was observed as part of the Science Demonstration Time for the LBT blue camera (LBC-Blue, Ragazzoni et al. 2006, Giallongo et al. 2008), a wide-field imager with a 23 23′ field of view and an angular scale of 0.23 arcsec/pixel. LBC-Blue is optimized for high throughput across the spectral range from 3200 to 5000 Å and has 4 CCD detectors of 2048 4608 pixels each. Its filter set includes the Bessel , and filters, plus the and bands. At the distance of IC 2574, 4.02 Mpc (Walter et al. 2007), one LBC-Blue pixel corresponds to about 4.4 pc.
IC 2574 was imaged with the LBT/LBC-Blue on February 17, 19, 21 and 22, 2007, using a circular dithering pattern (40 arcsec in radius) with 4 different pointings in order to cover also the 3 intra-CCD gaps (about 16 arcsec each) in the LBC-Blue field of view. The total exposure time was 70 min (14 300 s) in the band, 35 min (7 300 s) and 15 min (3 300 s) in the and bands, respectively, with an average seeing of 1.0′′. The individual images were reduced with standard IRAF111IRAF is distributed by the National Optical Astronomy Observatories, which are operated by the Asssociation of Universities for Research in Astronomy, Inc., under cooperative agreement with the National Science Foundation routines. They were corrected for bias and flat-field, and then aligned to the same pixel grid using GEOMAP and GEOTRAN with an accuracy of better than 0.2 pixels. After background subtraction, the images obtained for the same filter were weighted by their seeing (weight = /, where is the best seeing measured for each filter dataset) and averaged. The astrometric solution of these combined images was updated using the package Astrometry.net (http://astrometry.net, Lang et al. 2008). We applied the flux calibration derived by the LBC-Blue team during commissioning to the combined images, and checked the consistency of these color-transformations on standard stars imaged at the same epoch as IC 2574. The systematic error of the flux calibration turns out to be 0.03 mag in each band. The combined images reach a limiting surface brightness of 26 mag arcsec-2 (in the VEGAMAG system) at a S/N ratio of 5 in each filter.
In what follows, the LBT optical data collected for IC 2574 are used together with the observations in atomic H gas (HI at 21 cm) performed by Walter & Brinks (1999) with the VLA in its B, C and D configurations. The HI observations were carried out with a 1.56 MHz bandwidth centered at a heliocentric velocity of 38 km s-1, for a velocity resolution of 2.6 km s-1 and an angular resolution of about 7 arcsec. The HI map defines a maximum rotation velocity of 70 km s-1 at a galactocentric distance of 8 kpc (Oh et al. 2008) and an average velocity dispersion of 7 km s-1 (Walter & Brinks 1999).
| (mag arcsec-2) | 23.72 | 23.94 | 23.47 |
| (kpc) | 4.1 | 3.6 | 3.4 |
| (mag) | 10.67 | 11.13 | 10.70 |
| (mag) | 10.49 | 10.98 | 10.59 |
3. The optical morphology of IC 2574
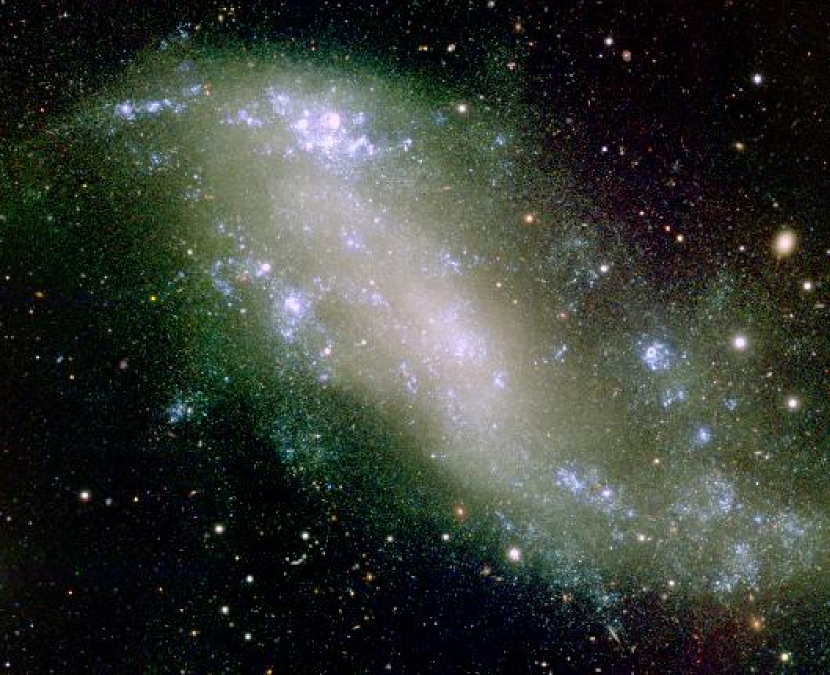
The color-composite of IC 2574 obtained with the LBT/LBC Blue camera during the Science Demonstration Time of February 2007 is shown in Figure 1, with the , and images color-coded in blue, green and red respectively. The size of the color-composite in Figure 1 is 14 11′ and covers only a quarter of the full field of view of the camera. The combination of high sensitivity with wide field of view of the camera reveals a wealth of features: the “finger”, a knotty tidal stream (oriented East-West), the Northeast complex of HII regions (the HI supergiant shell), and the extended tail of star formation in the South-West. Faint plumes of stars departing from the eastern and western sides of IC 2574 are also visible. The star-formation activity in IC 2574 appears to mostly occur in the outskirts of the galaxy, in a ring-like substructure. This is reminiscent of the optical morphology of the Large Magellanic Cloud, which, like IC 2574, is a barred late-type galaxy.
From the isophote corresponding to a limiting surface brightness of 26 mag arcsec-2 we measure an overall extend for IC 2574 of about 16 kpc 7 kpc, which includes the East-West tidal stream and the South-West tail. The ellipse that best fits the = 26 isophote is characterized by an axis ratio = = 0.47 and a position angle PA = 55o. For a disk of intrinsic flattening of = 0.12 (cf. Martimbeau et al. 1994) this implies an inclination = 63o. With these orientation parameters, we compute the surface brightness profile for concentric elliptical annuli of fixed and PA in each band. These profiles are plotted in Figure 2, where the surface brightness is corrected for inclination (assuming no dust) and Galactic extinction (E(-) = 0.036 mag, Schlegel et al. 1998) using the extinction law of Cardelli et al. (1989). These profiles nicely follow an exponential disk out to 4 kpc, with an excess of emission at 5 and 7 kpc (see Figure 1). The parameters of the best-fitting exponential disk are listed in Table 1 for each filter, where the central surface brightness () is corrected for inclination and the total observed magnitude () is corrected for Galactic extinction (). The mean scale length computed from the LBT data is 3.7 kpc and agrees well with the scale length (3.2 kpc) obtained by Martimbeau et al. (1994, adopting the same distance). The inner disk (at 4 kpc) is characterized by a mean 0.44 mag and a mean -0.3 mag (both corrected for Galactic extinction). In a model of an instantaneous starburst (i.e. a single stellar population, SSP) computed with STARBURST99 (Leitherer et al. 1999) for a metallicity similar to the Small Magellanic Cloud (SMC), these colors translate to an age of 1 Gyr and 120 Myr, respectively.
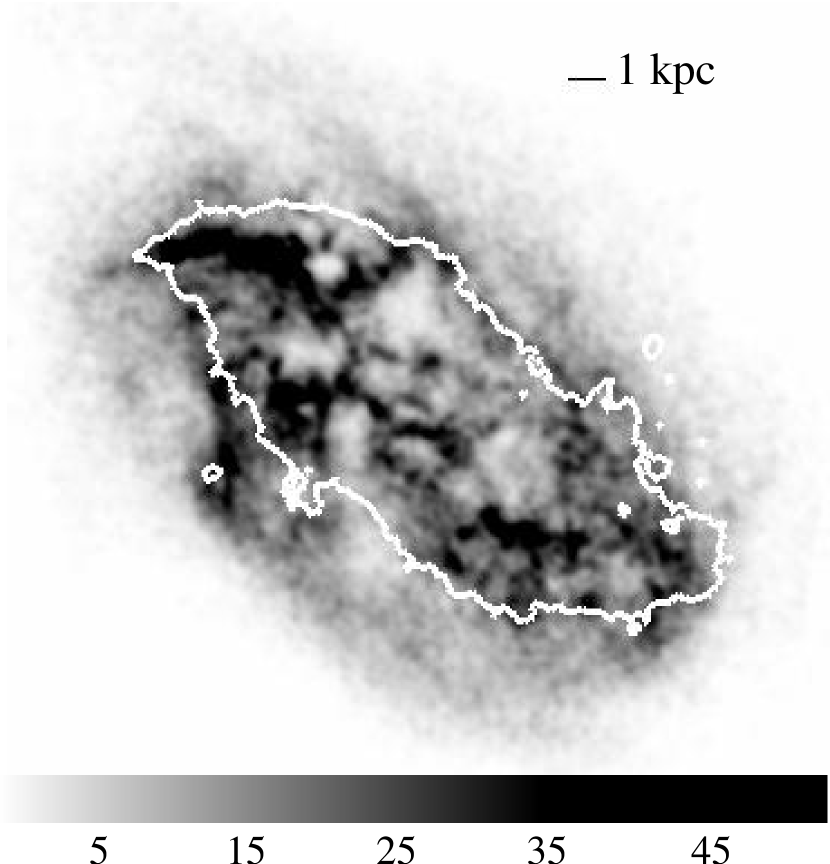
Figure 3 compares the = 26 -band isophotal contour (thick white line) to the HI distribution to illustrate the spatial relationship between the young stars and the resevoir of atomic gas. The grey scale becomes darker as the column density of the HI gas increases from 5 1020 to about 5 1021 cm-2 (not corrected for inclination). While the HI and -band light distributions share nearly the same major axis, their minor axes are quite different, with the minor axis being smaller in the optical. This could be due to differences in the scale height of the -band light and HI distributions.

4. Stellar populations
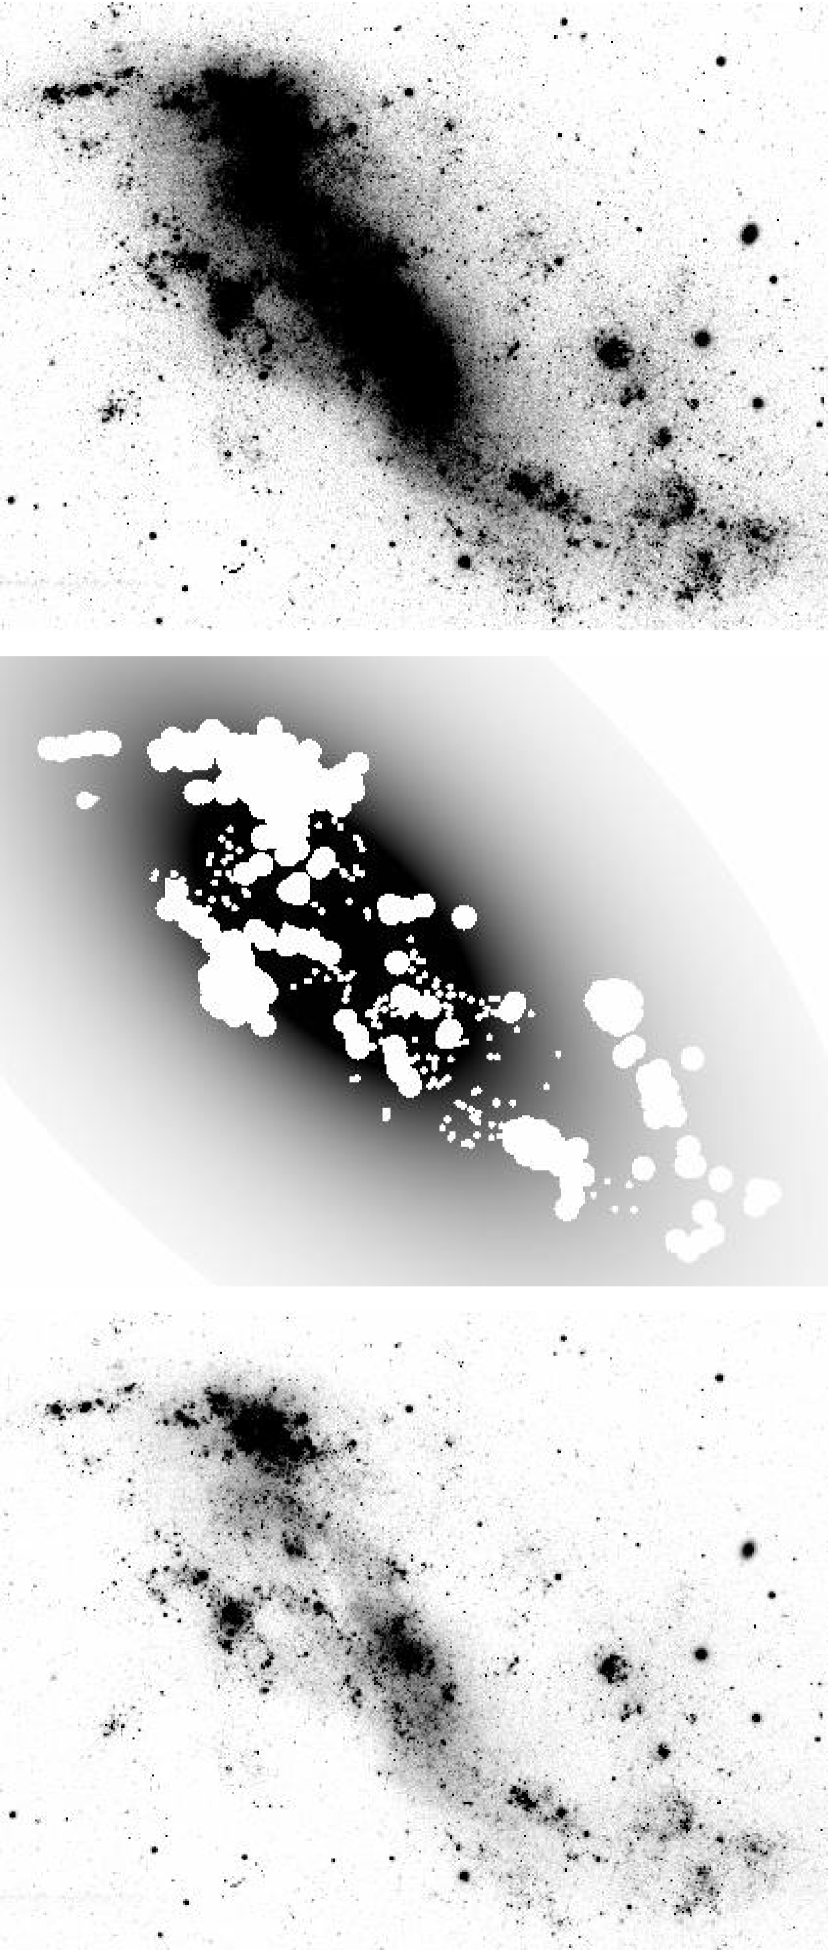
In order to derive the star-formation history of IC 2574 over the last few 108 yr from the observed photometry, we need to disentangle the colors of star-forming regions from those of the underlying smooth disk, which includes light from older episodes of star formation (see Sect. 3). This is analogous to subtracting the local background in stellar photometry. We first identify the star forming regions as those bluer than = -0.3 mag and with a S/N ratio per pixel larger than 5 (in all filters). These regions are likely to contain mostly light from young stars (younger than 100 Myr for a SSP synthesized with STARBURST99 assuming an SMC-like metallicity). We mask these regions and then fit the remaining light. We fix the galaxy center, ellipticity (1 - = 0.53), and position angle (55o) and fit the -band image together with the mask frame using the IRAF routine ELLIPSE. This yields an estimate of the diffuse light across the galaxy and we subtract this model disk component from the original image. The residual image should contain only young stars and we use it in the subsequent analysis. Figure 4 shows, as an example of the whole procedure, the original image (top panel), the model disk component with the masked regions overlaid (middle panel) and the image of the residuals (bottom panel) determined for the band. This same procedure was applied to the and images after convolving them to have the same PSF as the band. Each band was fitted with ELLIPSE separately, but with the same mask and the same fixed values for the galaxy center, position angle and ellipticity.
The resulting model disk component is characterized by a scale length of 2.7 kpc in all three filters, about 30 smaller than the average computed in Sect. 3 from the original images (disk star-forming regions). Its mean colors are 0.5 mag and -0.2, which correspond to an age of about 1 Gyr and 200 Myr, respectively, according to a SSP synthesized with STARBURST99 for an SMC-like metallicity. These values are consistent with the ages derived from the color profiles for 4 kpc; therefore, subtracting the model disk component is equivalent to removing the light from the diffuse stellar populations older than 100 Myr. The model disk component makes up about 27, 36 and 42 of the total light of the galaxy in the , and filters respectively.
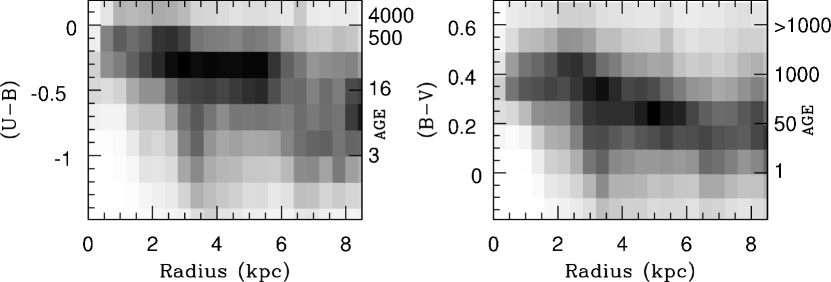
The observed and colors of the pixels in the residual images are plotted in Figure 5 as a function of distance from the galaxy center. These colors have been corrected only for Galactic extinction. The grey scale of the color distributions is based on a grid of bi-dimensional bins, 0.4 kpc 0.2 mag in size in , and 0.4 kpc 0.1 mag in size in . We count the number of pixels falling in each bin and scale the grey shades by the maximum, so that the grey colors grow darker as the number of pixels increases. The right-hand side -axis in both plots qualitatively links colors to stellar ages of a SSP synthesized with STARBURST99 for an SMC-like metallicity (in units of 106 yr). We notice that the residuals within 2 kpc from the galaxy center are relatively redder and older than those at larger distances, while there is a significant blue (few Myr old) stellar population at galactocentric radii larger than 3 - 4 kpc.
In what follows, we will restrict our analysis to the pixels in the residual images. Our aim is to estimate their stellar age and stellar mass surface density (Sect. 4.1), with which we will reconstruct the star-formation history in IC 2574 in the last 108 yr (Sect. 4.2). We will compare the star-formation activity of this galaxy with its HI properties to assess the applicability of the Schmidt law on local and global scales (Sect. 4.3). Finally, we will investigate the possible stellar origin of the HI holes detected in IC 2574 to examine the effects of stellar feedback on the interstellar medium (Sect. 5).
4.1. Age and mass estimates
In order to assign an age and a mass density for each pixel in the residual images, we compare the observed photometry to synthetic stellar populations convolved with a specific reddening law. We run STARBURST99 to compute the colors of an instantaneous starburst (SSP) with a total mass of 106 M⊙ as a function of its age. For this purpose, we adopt the default parameters of STARBURST99 except for the metallicity, which we choose to be SMC-like following Stewart & Walter (2000). We assume a multi-power law for the initial mass function (IMF) to approximate a Kroupa (2001) IMF, with an exponent of 1.3 for stars in the range 0.1 M⊙ - 0.5 M⊙, and 2.3 for the interval 0.5 M⊙ - 100 M⊙. Only stars with masses between 8 M⊙ and 120 M⊙ produce supernovae. Stellar winds and mass loss are computed with the theoretical model which solves for the radiative transfer and the momentum equation in the stellar wind (cf. Leitherer, Robert & Drissen 1992). Finally, we use the Geneva evolutionary tracks with high mass loss; as discussed by Meynet et al. (1994), these tracks better reproduce the low luminosity observed for some Wolf-Rayet (WR) stars, the surface chemical composition of WC and WO stars, and the ratio of blue to red supergiants in the star clusters in the Magellanic Clouds. The choice of an instantaneous starburst may be an over-simplified approach to the study of a star-formation history that is expected to be more complicated in reality. On the other hand, our analysis is restricted only to star forming regions younger than 108 yr and this short time interval can be represented with an instantaneous starburst reasonably well.
We select all pixels in the residual images with a S/N ratio larger than 5 in all filters and with a -band flux 5 above the background level. We compare their colors (corrected for Galactic extinction) with the synthetic colors of STARBURST99 using the technique described in Pasquali et al. (2003). Briefly, the synthetic colors of a single stellar population are reddened according to a pre-selected extinction law by a quantity E(-)i which is a free parameter varying across a pre-defined interval. This parameter represents the dust obscuration within the galaxy itself, and we refer to it as intrinsic reddening. For a given E(-)i, a is calculated as the sum of the differences between the observed and reddened synthetic colors, normalized by the observational errors. Its minimum value, , establishes the best-fitting age, intrinsic reddening and reddened synthetic magnitudes in the , and bands. The stellar mass enclosed in each pixel is then determined via the scaling relation:
Mpix = 10 106 M⊙
We compute Mpix in , and , and take the mean of these three values.
Although at mid-IR wavelengths the intrinsic reddening of IC 2574 is negligible (cf. Cannon et al. 2005, Dale et al. 2007), at optical wavelengths it appears to be more prominent. Miller & Hodge (1996) performed optical spectroscopy of the North-East complex of HII regions and measured an intrinsic reddening of the gas, E(-), between 0.3 and 0.5 mag, which translates into a stellar E(-)i of 0.13 - 0.22 mag (cf. Calzetti 2001). More recently, Moustakas et al. (2007) derived E(-) 0.15 mag over an aperture 10 arcsec in radius at the center of IC 2574 which implies even lower stellar E(-)i. Therefore, we decide to restrict the range of values available for E(-)i in our fitting procedure between 0.0 and 0.13 mag and to apply reddening with the extinction law derived for the SMC by Bouchet et al. (1985). We also use our dating technique in the assumption of a reddening-free environment (imposing E(-)i = 0.0 everywhere in the galaxy) to check for systematic effects on the output ages and mass densities due to our specific treatment of dust obscuration.
In the dating technique of Pasquali et al. (2003), the errors on each best-fitting parameter are given by the minimum and maximum value of that parameter among all the fits which realize 1.5 (corresponding to about 2). In the case of IC 2574 we compute an average uncertainty of a factor of 2 on age, reddening and mass.
4.2. The spatial distribution of stellar ages and mass densities
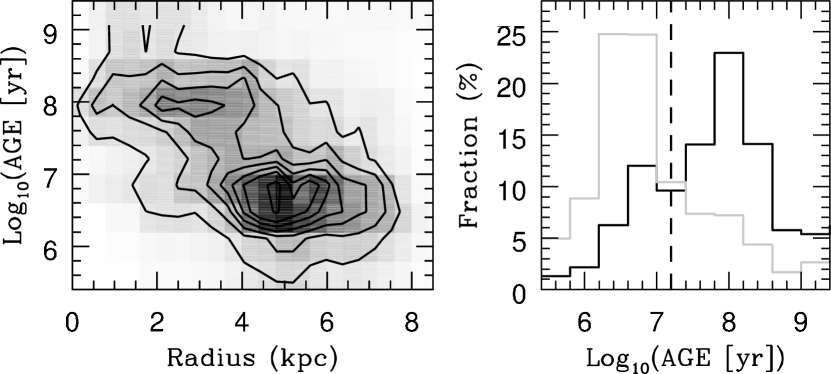
The distribution of stellar ages (obtained by correcting for intrinsic reddening) across the residual images is shown in Figure 6. The left hand-side panel plots the distribution of pixel stellar ages as a function of pixel galactocentric distance with the help of a grey scale which indicates the number of pixels in each 2D bin, 0.4 dex in age 0.4 kpc in radius. The grey shade gets darker with increasing numbers of pixels. The contours (tracing equal numbers of pixels across the bins) highlight two major epochs of star formation in IC 2574. The older burst occurred about 100 Myr within 4 kpc of the center, while the second event took place between 10 and 1 Myr ago mostly at 4 kpc. Star formation proceeded in between the two bursts, but with a somewhat lower rate. Globally, the stellar ages decrease with increasing distance from the galaxy center.
The age histograms for all pixels at a galactocentric distance smaller and larger than 4 kpc are traced in the right hand-side panel of Figure 6, with a solid black and grey line respectively. Both histograms are normalized by the total number of pixels from which they are derived. If we assume a value of 16 Myr (Log10(AGE) = 7.2) to discriminate between the younger and older burst, we can estimate the spatial coverage of the two bursts in the inner and outer disks of IC 2574. For galactocentric distances smaller than 4 kpc, the older burst has occurred over 73 of the pixels while the younger one has involved only 27 of the area. In the outer regions, instead, the younger burst has lit up 70 of the pixels, and the older burst took place only in 30 of the area.
Repeating the same analysis but switching off the reddening correction confirms these trends. The younger and older bursts are still prominent and well defined, and they turn out to have similar timescales as determined when reddening is applied. Only the spatial coverage of the two bursts varies, and this only by 5 at most.
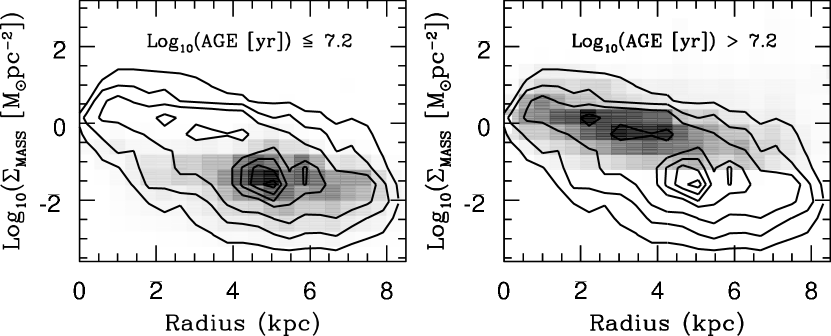
The distribution of the pixel, stellar mass surface densities (obtained including the correction for intrinsic reddening) as a function of pixel galactocentric distance is presented in Figure 7 for the younger burst (left hand-side panel) and the older burst (right hand-side panel). Here, the grey scale indicates the number of pixels in each 2D bin, 0.4 dex 0.4 kpc in size. The contours, which trace equal numbers of pixels across the bins, are computed for all the pixels with no age selection, and are the same in both panels. All stellar mass surface densities are corrected for inclination. We can see that the older burst involves stellar mass surface densities larger than 0.2 M⊙pc-2 and has a characteristic stellar mass surface density of about 1 M⊙pc-2. The younger burst is instead associated with stellar mass surface densities lower than 0.2 M⊙pc-2 with a characteristic value of about 0.04 M⊙pc-2. The stellar mass surface density contours trace a radial profile which follows an exponential disk with a scale length of about 2.7 kpc and a central mass density of 5 M⊙pc-2.
Correcting for reddening yields lower ages, higher stellar luminosities and hence larger stellar masses than assuming no extinction. With the constraint that E(-)i is 0.13 mag see Sect. 4.1), we obtain mass surface densities that are up to 40 larger than those assuming E(-)i = 0.0 everywhere. The assumption of E(-)i = 0.0 everywhere in the galaxy results in a lower characteristic stellar mass surface density, of about 0.6 M⊙pc-2 and 0.03 M⊙pc-2 for the older and younger burst respectively. It also gives a slightly larger scale length of 3 kpc and a central, stellar mass surface density of 6 M⊙pc-2.
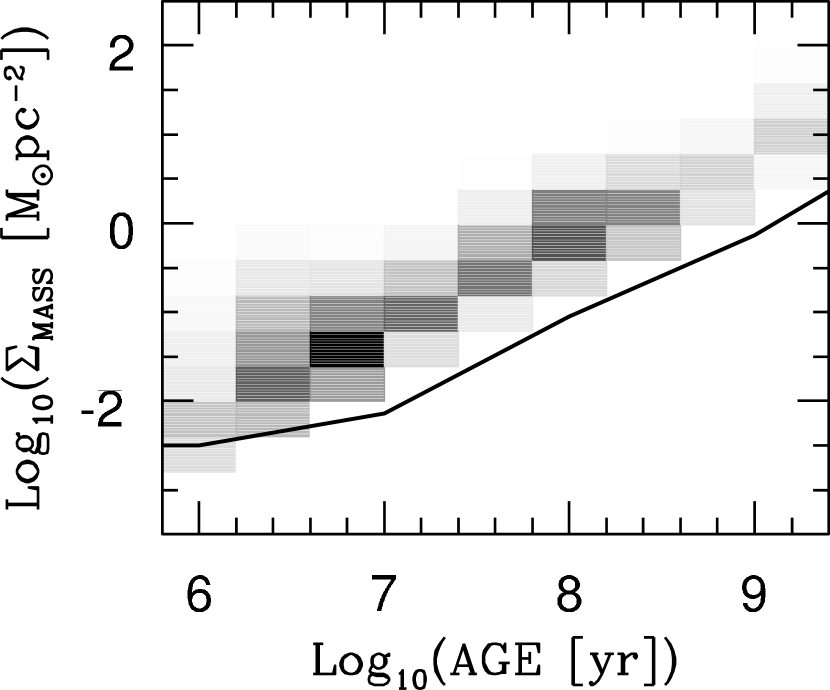
Independent of the reddening, there is a relationship between age and mass surface density in our results, in the sense that older stellar ages are associated with higher, stellar mass surface densities. This is shown in more detail in Figure 8, where the stellar mass surface density (corrected for inclination) is plotted as a function of age. The grey scale is based on the number of pixels within each 2D bin, 0.4 dex 0.4 kpc in size. The lower edge of the distribution is a selection effect created by requiring a -band detection in order to carry out the analysis. Since older stars emit less -band light, there must be more of them to reach the same surface brightness limit. The solid line in Figure 8 shows that the lower edge of the relationship matches our photometric detection threshold of 26 mag arcsec-2, corresponding to a physical detection threshold of 3.2 10-3 M⊙pc-2 or 0.12 M⊙ per pixel. There is, however, no obstacle to detecting a stellar component younger than few Myr and as massive as the older burst. The fact that such high, stellar mass surface densities are not derived for the younger burst may hint at a constant star-formation rate over the last 108 yrs, so that the younger burst has not had time yet to build-up all the stellar mass assembled by the older burst.
From all the pixels enclosed in an ellipse of semi-major axis a = 8 kpc and semi-minor axis b = 3.5 kpc (PA = 55o) we derive a total mass of about 4.4 107 M⊙ for the stars younger than 1 Gyr (from the fits that include the reddening correction), of which 3 106 M⊙ were produced during the younger burst and 4.1 107 M⊙ during the older burst. Switching off the reddening correction in our dating technique gives lower values: a total mass of about 3.9 107 M⊙ split between 2 106 M⊙ and 3.7 107 M⊙ for the younger and older burst, respectively.
Although a SSP based on the assumption of istantaneous burst does not provide a true star-formation rate, we can estimate one from the ratio of the total stellar mass produced during a burst to the mean stellar age of the same burst. This exercise is based on the pixel-by-pixel maps of stellar age and mass surface density computed by omitting the reddening correction, so that we can compare the results with the SFR derived in the literature from the galaxy observed H flux (i.e. not corrected for intrinsic reddening). Therefore, for a mean stellar age of 4 Myr and 150 Myr of the younger and older burst, respectively, and the burst total masses as listed above, we derive a SFR of about 0.5 M⊙yr-1 and 0.2 M⊙yr-1. Given that the typical uncertainty in our age and mass estimates is a factor of 2, the error on the SFR corresponds to about a factor of 3, and within this uncertainty we may infer that the SFR has been nearly constant over the last 108 yr in IC 2574. For comparison, the SFR derived from the H flux by Miller & Hodge (1994) is 0.1 M⊙yr-1. This value suffers its own uncertainties concerning the depth of the observations as well as the escape fraction of ionizing photons emitted by young and massive stars, which can be as high as 50 (cf. Weedman 1991, Pasquali & Castangia 2008).
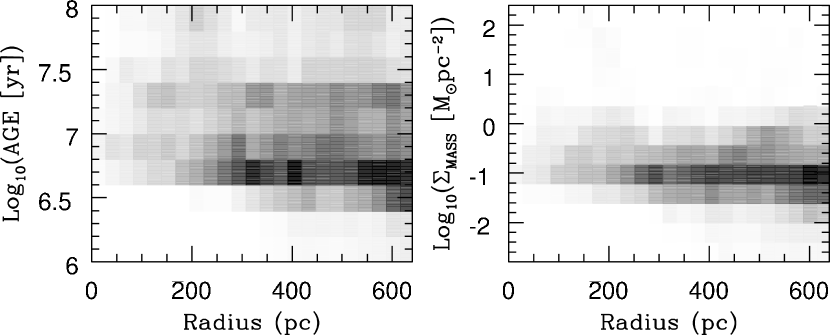
As already noted in Sect. 1 and 3, the Northeast complex of HII regions, also associated with a HI supergiant shell, is the brightest site of star formation in IC 2574. In order to investigate whether its stellar populations are different from the rest of the galaxy, we analyze the distributions of pixel stellar ages and mass surface densities within the supergiant shell. These are plotted in Figure 9 as a function of distance from the shell center. Here, each 2D bin is 0.4 dex 28 pc in size. The shell is spatially rather uniform in age, except perhaps for ages younger than 3 Myr (Log10(AGE) = 6.5), which show up only at radii larger than 400 pc. It appears that the most significant episode of star formation occurred about 5 Myr ago; a previous burst may be identified in a more modest peak of the distribution at an age of 20 Myr. As discussed by Walter et al. (1998) and Walter & Brinks (1999), the shell contains a star cluster and has 9 star-forming regions distributed along its rim. Stewart & Walter (2000) estimated an age of 11 Myr for the star cluster and 3 Myr for the star-forming regions. From the LBT data we derive an age of about 5 Myr for the cluster and 1 - 3 Myr for the shell rim. These values do not change significantly when the correction for intrinsic reddening is omitted or the diffuse large-scale disk is not removed. The discrepancy in the cluster age between this work and Stewart & Walter could be related to different IMF and evolutionary tracks, and to a different treatment of reddening which can be quite patchy within the shell. However, given the factor of 2 uncertainties in our age estimates, these two results are consistent. The stellar mass surface density of the shell varies between 0.01 and 1 M⊙pc-2, and peaks at about 0.1 M⊙pc-2.
4.3. Comparison with the HI column-density map
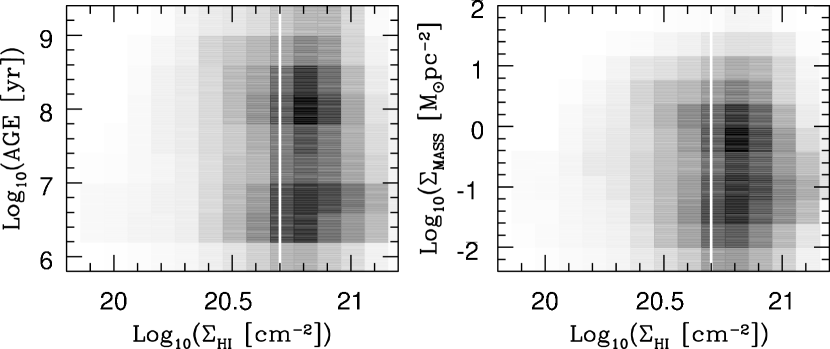
Figure 10 shows the distribution of pixel stellar ages and mass surface densities as a function of the HI column density corrected for inclination. Here, each 2D bin is 0.4 dex 0.2 dex in size. No correlation arises from these plots except for the fact that the star-formation activity in IC 2574 seems to preferably occur in regions with 6 1020 cm-2. This value is comparable with the critical density derived by Skillman (1987, 1021 cm-2) for a number of irregular galaxies and Kennicutt (1989, 5 1020 cm-2) for a sample of disk galaxies. Column densities smaller than 1020 cm-2 are measured in correspondence with HI holes and may be not representative of the local HI gas prior to the formation of the holes.
The lack of any correlation between star-formation and HI gas on local scales, was also observed in seven spiral galaxies by Wong & Blitz (2002), in NGC 6822 by de Blok & Walter (2006), in M 51a by Kennicutt et al. (2007) and for a large galaxy sample by Bigiel et al. (2008). In the case of M 51a, Kennicutt et al. showed that the local star formation density correlates with the local H2 density (and thus the local HIH2 density). In IC 2574, we expect that most the ISM is atomic, and we might expect a relationship between HI and SFR based on both formation of and feedback from young stars. From formation, the correlation observed between H2 and SFR in gas-rich spirals might suggest that the gas reservoir, here probably HI, dictates the SFR. From feedback, we would expect a correlation if HI forms via photodissociation of H2 powered by the stellar UV radiation field (Shaya & Federman 1987, Tilanus & Allen 1991, Allen et al. 1997) or an anticorrelation if the stellar radiation field ionizes HI into HII. None of these predictions appear to be borne out by the results seen in Figure 10. We are then led to conclude that there is no evidence in our data that HI either sets the star formation rate or that star formation creates or ionizes a significant fraction of the HI.
5. Stellar properties of the HI holes
The lack of correlation between HI and star formation is especially striking in IC 2574, where the HI distribution is marked by a wealth of holes. A natural explanation for these structures is that they are carved out by feedback from star formation, but the lack of a correlation between atomic gas and the SFR calls such a relationship into question. In this section we ask whether young stars have been able to produce the observed HI holes and to sustain their expansion; we also ask whether such holes are a natural consequence of the star formation we observe and investigate the implications of the lack of HI-SFR correlation for stellar feedback.
5.1. Are the HI holes powered by stars?
Walter & Brinks (1999) identified 48 holes and measured their diameter, expansion velocity, dynamical age, volume/column density and their HI mass. These holes are long-lived features; since IC 2574 largely rotates as a solid body, the shear computed from its smoothed rotation curve turns out to disrupt the HI holes over timescales larger than 0.5 Gyr. Out of the initial 48 holes, only 15 overlay with the residual images of IC 2574 obtained after subtracting the smooth disk component (see Sect. 4), have a measured velocity expansion, and more than 80 of their area filled with pixels carrying information on stellar age and mass density. Similarly to the supergiant shell whose star cluster is off-centered (Walter & Brinks, Stewart & Walter 2000), we do not detect any central star cluster in these 15 HI holes, but rather a spatial mixture of populations formed during the younger and older bursts. The spatial distribution of the younger population within each HI hole can be clumpy, with the clumps often located at the periphery of the HI hole. Figure 11 shows the radial distribution of pixels with an associated stellar age younger than 16 Myr (corresponding to the younger burst) obtained for each HI hole. The three panels of Figure 11 distinguish the holes completely filled by young stellar populations (left-hand side panel) from those where young stellar ages are found in the periphery (middle panel) and from the holes where young stellar populations are preferentially central (right-hand side panel). We express the distance of each pixel from the hole center in units of the respective hole radius and compute the number of pixels younger than 16 Myr per distance bin as well as the total number of pixels younger than 16 Myr within the hole. We use this latter quantity to normalize the former, and derive in this way the fraction of “young” pixels as a function of distance within a HI hole. Apart from the three holes in the left-hand side plot that are completely dominated by a young stellar component, in most cases (including the supergiant shell) this young stellar population lives in the outer skirts of a hole, at a distance larger than 0.4 times the hole radius (central panel). Only in two holes does the young component look more centrally concentrated (right-hand side plot).
For these 15 holes we also estimate: i) the fraction of pixels associated with a stellar age younger than 16 Myr (), defined as the ratio of pixels associated with stellar ages younger than 16 Myr to the total number of pixels within a hole; ii) the mean age of the stellar populations produced during the younger burst (with an age 16 Myr), iii) the total stellar energy released by the stellar winds and supernova explosions of the young population (), and finally iv) the kinetic energy of the HI holes in terms of a fraction of the total energy provided by their young stellar populations. We compute the stellar total energy, , from the value derived by STARBURST99 at the mean age of the young component within a hole and properly scaled by its total mass. The kinetic energy of a hole is determined from its column density, corrected for inclination ( estimated by Walter & Brinks) and its expansion velocity (): = 0.5, where is the area of the hole whose diameter is listed in Walter & Brinks. We then calculate the ratio of the hole kinetic energy to the stellar total energy ; this ratio is a measure of the efficiency at which the total stellar energy is transformed into kinetic energy of the HI gas.

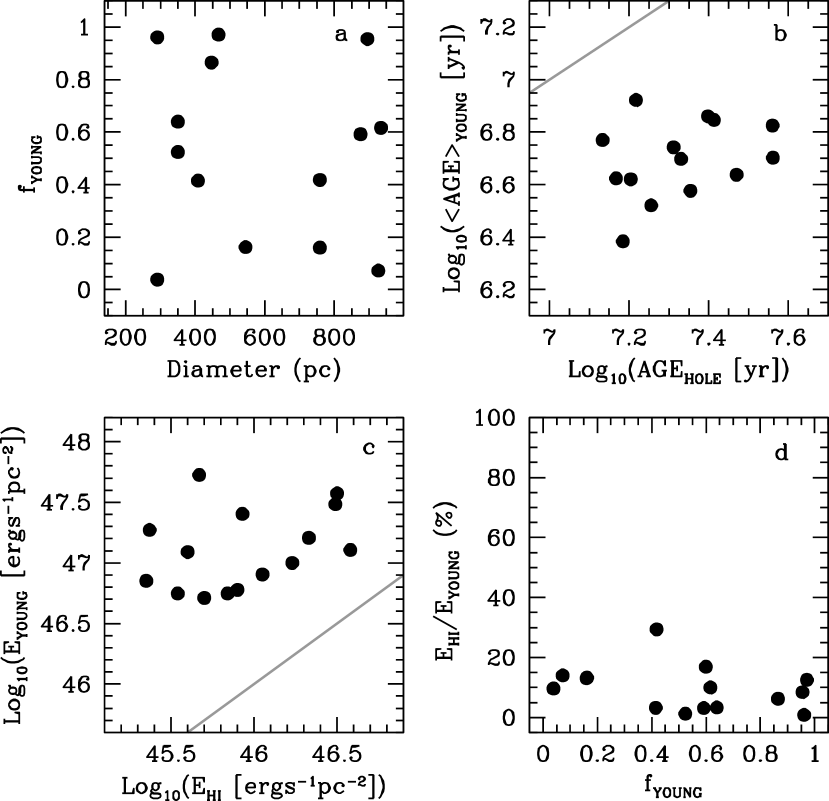
All parameters mentioned above are plotted in Figure 12. Panel a presents as a function of the hole diameter in parsec. No correlation is seen between these two parameters. The mean age of the young stellar component is plotted as a function of the hole dynamical age in panel b. Here there is a hint of a relation in which both the young component and the hole age together, although the stars generally appear to be younger than their associated hole by a factor of 5 on average. We note here that the dynamical age of the holes is an upper limit to the true hole age, since Walter & Brinks derived the dynamical age under the assumption of a constant expansion velocity, while these holes have certainly expanded faster in the past. Because of the uncertainty of this assumption and the errors in our dating technique, it is difficult to establish how much older (if at all) the HI holes are compared to their young stellar component. As shown in panel c, the total energy released by the young stellar component is typically an order of magnitude larger than the kinetic energy of the HI holes and lies above the one-to-one correspondence traced by the grey line. Indeed, the ratio of the hole kinetic energy to the total stellar energy is on average about 10, thus indicating that the hole expansion can be sustained with only 10 of the available total stellar energy (cf. panel d). This overall picture does not qualitatively change when we use the stellar populations obtained by switching off the reddening correction in our dating technique. In this case, the ratio of the hole kinetic energy to the total stellar energy increases from 10 to about 20, since the output stellar mass surface density is lower when reddening is neglected. An ratio of 10 - 20 is in agreement with the value (10 - 20) independently obtained by Cole et al. (1994) from modeling the galaxy luminosity function, while Bradamante et al. (1998) determined a value of 3 for supernovae II and 100 for supernovae Ia from the modeling of the chemical evolution of blue compact galaxies.
5.2. Why doesn’t all star formation create holes?
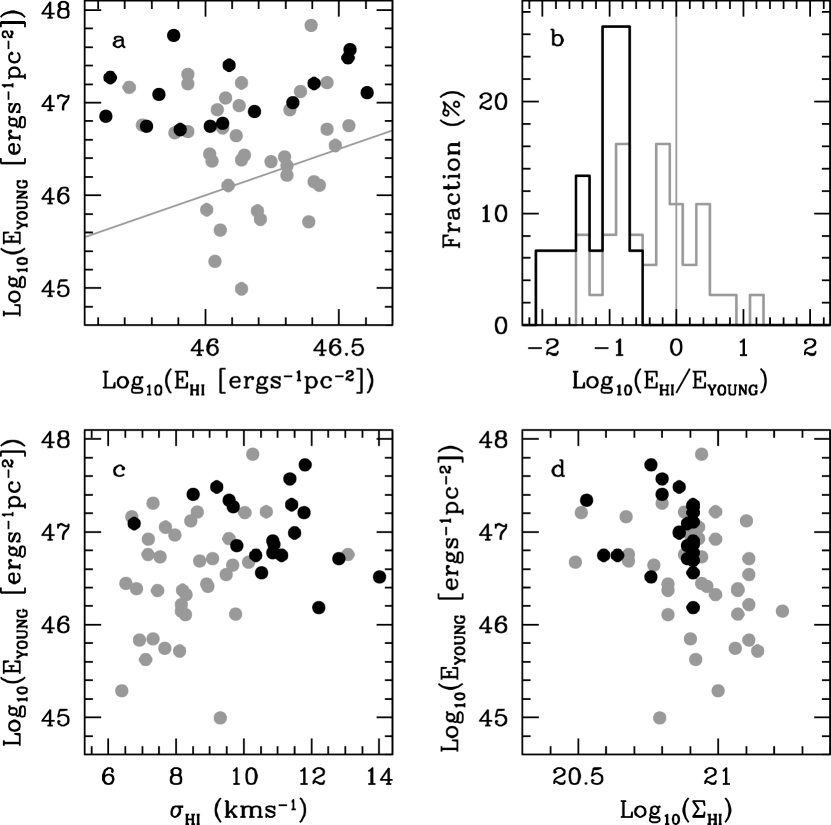
If a conclusion from Figure 12 is that the stellar energy budget is in principle large enough to support the holes expansion, we may then ask why many star-forming regions in IC 2574 are not located in HI holes. We build a sample of 105 control apertures with the diameter (7 arcsec or 136 pc at the assumed distance of IC 2574) of the beam of the HI observations, placed randomly across the galaxy to sample different stellar populations and different values of the HI column density away from the observed HI holes. For each aperture, we measure , , , the average HI velocity dispersion, (from the HI second-moment map of Walter & Brinks), defined as 1.5 (where is the area of the apertures), and the energy ratio . All these properties are plotted in grey in Figure 13 for only those 37 apertures with 70, so that their stellar populations mostly formed during the younger burst. In black are the observed 15 HI holes, whose we measure in an annulus about 100 pc wide around each hole and whose was estimated by Walter & Brinks. The assumption here is that the HI properties outside a HI hole may be representative of the local gas before the hole formation. Panel a of Figure 13 shows the total stellar energy as a function of the HI kinetic energy, both parameters normalized by the area of the apertures (grey circles) and HI holes (black circles). The grey line indicates the one-to-one correspondence between these two energy terms. For the majority of apertures as well as for all the HI holes, the total stellar energy is up to an order of magnitude larger than the HI kinetic energy. Indeed, the ratio is lower than unity for about 70 of the control apertures, and the average is 35, indicating that about one third of the total stellar energy can account for the observed HI kinetic energy (cf. panel b). Yet, no hole in the atomic H gas is detected at the position of these apertures. We notice that the apertures whose is larger than 100 are systematically associated with 8 1020 cm-2, i.e. high HI columns. The energy ratio for the HI holes is well below 100, with an average value of about 10; all HI holes have 8 1020 cm-2. In panel c of Figure 13 the total stellar energy is compared with the average velocity dispersion for both the control apertures (grey circles) and the observed 15 HI holes (black circles). No clear correlation exists between these two parameters, although one could attempt to see increasing with . This trend is seen also across a large sample of galaxies by Tamburro (2008) and could be interpreted as due to star formation inducing turbulence in the HI gas (cf. also Dib et al. 2006). The total stellar energy is plotted as a function of the HI column density, , in panel d; once again, no tight correlation can be seen in this plot, except perhaps for a weak trend whereby decreases at larger .
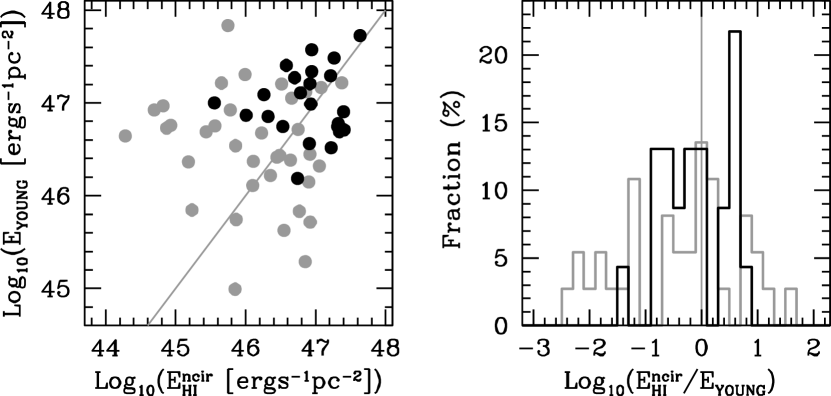
As pointed out by Walter & Brinks, the HI velocity contours of IC 2574 are characterized by distortions due to non-circular motions. Non-circularity is believed to arise from star-formation processes or from the presence of a bar, a spiral density wave or non-circular halo potentials. Oh et al. (2008) have recently isolated the non-circular motions in IC 2574 and showed that the typical velocity of non-circular motions is few km s-1, with peaks of 20 km s-1. We use the map of the kinetic energy associated with non-circular motions constructed by Oh et al. (as = 0.5 M V, where Mncir is the HI mass associated with non-circular motion, see Oh et al. for further details) and compute the total kinetic energy in non-circular motions in the control apertures with 70 as well as in the HI holes. We compare this energy with the total stellar energy in the left-hand side plot of Figure 14, where the black and grey circles represent the HI holes and the control apertures, respectively, and the grey solid line traces the one-to-one correspondence between the kinetic non-circular and stellar energies. The large majority of control apertures and holes are placed above this line indicating that the energy released by their young stellar population is larger than the kinetic energy of the in-situ non-circular motions. The distribution of the control apertures (in grey) and hole (in black) in the energy ratio is plotted in the right-hand side panel of Figure 14. Values of Log 0 are obtained for those control apertures and holes where the total stellar energy is in excess of ; they define an average = 21 (control apertures) and 43 (holes).
5.3. Photoionization of HI
There is a final aspect to consider in our analysis of the HI holes formation, i.e. the ionization of the HI gas due to stellar radiation. So far, we have considered the total energy produced by the stellar winds and supernova explosions of the stellar population younger than 16 Myr. Figures 12 and 13 do not show any firm evidence for a stellar origin of the holes, although the HI kinetic energy of the holes and the control apertures is typically about 10 - 30 of the total stellar energy. We now ask whether the HI holes are produced by the stellar radiation field via ionization of the atomic H gas. We estimate the number of ionizing photons, , in each hole and control aperture from the value tabulated by STARBURST99 at the age of the young component in the hole/aperture scaled by its total mass. We then use to compute the radius, , of the Strömgren sphere associated with each HI hole and control aperture. The Strömgren sphere defines the volume within which all the HI gas is ionized, and its radius is expressed by the equation = (43, where is the HI volume density and a scaling parameter depending on the gas temperature. From Osterbrok (1989) we assume = 4.5410-13 for a gas temperature of 5000 K. We derive the HI volume density from the relation: = where , the scale height of the HI disk, is 440 pc as obtained by Walter & Brinks (1999) for a distance of 4.02 Mpc.
If all the stellar photons produced within the control apertures ionized the surrounding HI gas, the radius of the Strömgren sphere of the control apertures with 70 would be on average 4 times bigger than the aperture radius, and the apertures would lie in holes that are well observable. Given that the control apertures are not associated with HI holes by definition, only a much lower fraction of can ionize the HI gas. This limits the number of ionizing photons to less than 20 of ; under this assumption, the ratio of to the aperture radius decreases to an average value of 2, consistent with an uncertainty on of a factor of 3 which is due to the errors on the stellar ages and masses. This constraint would make any HI hole formed via ionization less likely detectable. For the HI holes with 70, the UV radiation from the young stellar populations would produce a Stromgren sphere 4 times larger than the hole radius if 100 of the ionizing photons are available. Making the observed hole consistent with the Stromgren radius requires than only of the available photons. Therefore, such a limit on may be sufficient to explain both the existence of those HI holes whose stellar populations are predominatly young ( 16 Myr), and the lack of observable HI holes around the control apertures.
6. Discussion and conclusions
Deep, LBT imaging in the , and bands has allowed us to spatially map the star formation history of IC 2574 over the last 108 yrs. We do this by analyzing the pixel-by-pixel colors of all areas in IC 2574 with significant detections in all bands. Overall, the angle averaged surface-brightness profiles indicate a predominance of blue colors [() -0.3 mag and () 0.4 mag] at galactocentric radii larger that 4 kpc, mostly due to the presence of the large North-East complex of HII regions (associated with a HI supergiant shell) and the South-West extended tail of star formation. At a limiting brightness of 26 mag arcsec-2, the major axes of the HI and -band light distributions are nearly the same, while the minor axis is smaller in the optical. This could be due to differences in the scale height of the -band light and HI distributions.
Using the dating technique of Pasquali et al. (2003), we are able to construct pixel-by-pixel maps of stellar age and mass surface density from the comparison of the observed colors with simple stellar population models synthesized with STARBURST99. After fitting and subtracting a smooth disk component (whose colors point to a stellar age 200 Myr), our best-fitting STARBURST99 models indicate the occurrence of two major bursts, one about 100 Myr ago and the other during the last 10 Myr. The older burst appears to be spatially “confined” within the inner 4 kpc (in galactocentric radius), while the younger episode of star formation occupies the 4 8 kpc region. The two episodes differ also in the stellar mass surface density of stars formed: the typical mass density associated with the older burst is about 1 M⊙pc-2, while it is 0.04 M⊙pc-2 for the younger burst. However, these values are luminosity-weighted and therefore biased. Given that the -band flux emitted by a single stellar population decreases for increasing age and the flux itself is proportional to the stars total mass, the detection of stars above a fixed threshold in the -band (used in this study as a prior) requires stellar populations progressively more massive as they grow older. Quantitatively speaking, a limiting surface brightness of 26 mag arcsec-2 allows us to detect stellar populations older than 108 yrs with a mass surface density larger than 0.1 M⊙pc-2, while those populations few Myr young are detected down to a mass surface density of 0.003 M⊙pc-2 (a factor of 30 lower than at 100 Myr). The fact that we do not detect young stellar populations as massive as 1 M⊙pc-2 is not a selection effect of the data; it possibly hints at a constant star formation rate, at least over the last 108 yrs, so that the younger burst has not had time yet to produce the same amount of stellar mass as was assembled during the older burst.
We compare both the stellar ages and the mass surface densities of the recently formed populations with the HI column density all across IC 2574 and do not find any significant correlation between the star formation activity and the HI reservoir in this galaxy. A similar result was obtained by Wong & Blitz (2002), de Blok & Walter (2006), Kennicutt et al. (2007) and Bigiel et al. (2008), using different tracers of star formation. The lack of any correlation between star formation and HI is in contrast with the expectation of a relationship between HI and SFR based on both formation of and feedback from young stars. In terms of star formation, the correlation observed between H2 and SFR in gas-rich spirals might indicate that the HI gas reservoir controls the SFR. In terms of stellar feedback, instead, we would expect to see a correlation if HI forms via photodissociation of H2 powered by the stellar UV radiation field (Shaya & Federman 1987, Tilanus & Allen 1991, Allen et al. 1997) or an anticorrelation if the stellar radiation field ionizes HI into HII. We thus conclude that the star formation in IC 2574 is not regulated by the available HI gas reservoir, nor efficient at creating HI via photodissociation, nor actively expeling or ionizing a significant fraction of the HI. On a global scale, star formation in IC 2574 appears to preferentially take place in regions where the HI column density is about 6 1020 cm-2. This value is comparable with the global critical density derived by Skillman (1987, 1021 cm-2) for a sample of irregular galaxies, by Kennicutt (1989, about 5 1020 cm-2) for 33 disk galaxies, and by de Blok & Walter for NGC 6822 ((5.6 1020 cm-2), and with the theoretical values computed by Schaye (2004).
The lack of correlation between the star formation activity and the HI density in IC 2574 is rather puzzling with respect to the distinct HI holes, as one would expect to systematically detect a central cluster of young stars driving the hole expansion through their stellar winds and supernova explosions. With the possible exception of the supergiant shell (cf. Stewart & Walter 2000), we do not observe any concentration of young stellar populations at the center of the HI holes, but rather a mixture of populations formed during the younger and older bursts, with the younger population often in clumps located at the periphery of the HI hole. We determine the fraction of pixels with a stellar age younger than 16 Myr () for 15 of the 48 holes identified by Walter & Brinks (1999) (i.e. those that overlap with the area of the galaxy obtained after the removal of its smooth disk component, see Sect. 4) . Here, the age of 16 Myr is assumed to separate the younger from the older star formation episode identified by us. We also compute the mean age (AGE) and the total energy (EYOUNG, due to stellar winds and supernova explosions) of the stars formed during the younger burst in each hole and compare them with the dynamical age and kinetic energy of the hole (based on its expansion velocity). The relevant results of such a comparison are that:
i) (the ratio of the number of pixels associated with stellar ages younger than 16 Myr to the total number of pixels within a hole) does not correlate with the hole properties.
ii) The dynamical ages of the holes are generally higher than the younger burst by a factor of 5. The holes dynamical age is though an upper limit as it was computed by Walter & Brinks assuming a constant expansion rate. In reality, the holes expansion is expected to have been faster during its earlier phases.
iii) The kinetic energy of the holes is on average 10 of the total energy released by the younger burst. This energy ratio (i.e. the efficiency of stellar feedback) is in agreement with the value (10 - 20) obtained by Cole et al. (1994) from fitting the galaxy luminosity functions and colors, while Bradamante et al. (1998) determined a value of 3 for supernovae II and 100 for supernovae Ia from the modeling of the chemical evolution of blue compact galaxies.
Even at the remarkable photometric depth of the LBT data, we do not find a clear one-to-one association between the observed HI holes and the most recent bursts of star formation. However, the stars formed during the younger burst do in principle release enough energy to power the expansion of the HI holes. In order to investigate better this apparent discrepancy, we map IC 2574 in optical and in HI with a set of control apertures equivalent in size to the beam of the radio observations (136 pc). No observed HI hole is included among the control apertures. For those apertures with 70 (just to focus on the interplay between the younger stellar component and the HI gas), we measure their average HI velocity dispersion (from the second-moment map of Walter & Brinks), their average HI column density , the total stellar energy of their stellar populations younger than 16 Myr, , and the HI kinetic energy , defined as = 1.5 (where is the area of the apetures). For two thirds of the control apertures the ratio is lower than 100 and has an average value of 35; all the remaining apertures have 100 and are systematically associated with 8 1020 cm-2. Once again, the stellar populations formed during the younger burst could balance the kinetic energy stored in the HI gas, transform it into an expansion motion and thus produce a detectable HI hole for most of the control apertures. Yet, these regions failed to develop a HI hole. These same stellar populations could also sustain the HI non-circular motions, since their average ratio is 21.
Holes in the HI distribution may also be formed by ionization due to the UV emission of the young stars. In the case of those control apertures with 70, the Strömgren sphere produced by their stellar populations younger than 16 Myr is 4 times bigger in radius than the apertures and, therefore, would produce a detectable HI hole. Since this is not observed, the fraction of ionizing photons that effectively ionize the HI gas has to be rather small; a fraction 20 of the total number of ionizing photons emitted by the young stellar populations reduces the radius of the Strömgren sphere to 2 times the aperture radius, making any HI hole formed via ionization less likely detectable. This result is in agreement with the lack of correlation between star formation activity and HI density seen in Sect. 4.3, indicating that star formation does not appear to significantly affect the properties of the HI gas in IC 2574. From the analysis of the stellar content of the HI holes and the control apertures it is hard to establish whether stellar/supernova feedback is at work in IC 2574 on local scales of few 100 pc; this same result has been found for other dwarf galaxies (LMC and SMC, Kim et al. 1999, Hatzidimitriou et al. 2005; M33, van der Hulst 1996; Holmberg II, Rhode et al. 1999). The ultimate explanation of these findings remains elusive; it may rest either in an overestimate of the stellar mass loss and stellar winds especially at low metallicity, or in our understanding of how stellar energy interacts with the interstellar medium. Another explanation may be found in a stochastic sampling of the IMF in low-mass stellar systems. Stellar-populations synthesis codes usually assume that the IMF is a densely sampled probabilistic distribution function, while the IMF is in reality poorly and discretely sampled in low-mass stellar systems. This assumption produces fluctuactions in the predicted properties of these systems which may mislead comparisons with the observations (Cerviño & Valls-Gabaud 2003), by overestimating, for example, the stellar energy realesed to the ISM and thus underestimating the efficiency of stellar feedback. As shown by Cerviño & Molla (2002), Cerviño & Luridiana (2006) and Carigi & Hernandez (2008), stochastic effects on the IMF sampling become significant in low metallicity systems such as dwarf galaxies.
References
- (1) Allen, R.J., Knapen, J.H., Bohlin, R., Stecher, T.P., 1997, ApJ, 487, 171
- (2) Blain, A.W., Smail, I., Ivison, R.J., Kneib, J.-P., Frayer, D.T. 2002, Physics Reports, 369, 111
- (3) Bigiel, F., Leroy, A., Walter, F., Brinks, E., de Blok, W.J.H., Madore, .B, Thornley, M., AJ submitted
- (4) Bouchet, P., Lequeux, J., Maurice, E., Prevot, L., Prevot-Burnichon, M.L. 1985, A&A, 149, 330
- (5) Bradamante, F., Matteucci, F., D’Ercole, A., 1998, A&A, 337, 338
- (6) Bureau, M., Carignan, C. 2002, AJ, 123, 1316
- (7) Calzetti, D. 2001, PASP, 113, 1449
- (8) Cannon, J.M. et al. 2005, ApJ, 630, L40
- (9) Cardelli, J.A., Clayton, G.C., Mathis, J.S. 1989, ApJ, 345, 245
- (10) Carigi, L., Hernandez, X., 2008, preprint (arXiv:0802.1203)
- (11) Cerviño, M., Luridiana, V., 2006, A&A, 451, 475
- (12) Cerviño, M., Molla, M., 2002, A&A, 394, 525
- (13) Cerviño, M., Valls-Gabaud, D., 2003, MNRAS, 338, 481
- (14) Cole, S., Aragón-Salamanca, A., Frenk, C.S., Navarro, J.F., Zepf, S.E., 1994, MNRAS, 271, 781
- (15) Dale, D.A. et al. 2007, ApJ, 655, 863
- (16) de Blok, W.J.G., Walter, F. 2006, AJ, 131, 363
- (17) Dib, S., Bell, E., Burkert, A. 2006, ApJ, 638, 797
- (18) Drissen, L., Roy, J.-R., Moffat, A.F.J. 1993, AJ, 106, 1460
- (19) Efremov, Y.N., Elmegreen, B.G., Hodge, P.W. 1998, ApJ, 501, L163
- (20) Elmegreen, B.G. 2002, ApJ, 577, 206
- (21) Elmegreen, B.G., Efremov, Y.N. 1999, in ASP Conf. Ser., The Orion Complex Revisited, eds. M.J. McCaughrean & A. Burkert (San Francisco: ASP)
- (22) Giallongo, E., Ragazzoni, R., Grazian, A. et al. 2008, A&A in press (arXiv:0801.1474)
- (23) Hatzidimitriou, D., Stanimirovic, S., Maragoudaki, F., Staveley-Smith, L., Dapergolas, A., Bratsolis, E. 2005, MNRAS, 360, 1171
- (24) Heckman, T.M. 1998, in ASP Conf. Ser. 148, p. 127
- (25) Hill, J.M., Green, R.F., & Slagle, J.H. 2006, Proc. SPIE, 6267, 62670Y
- (26) Kennicutt, R.C. 1989, ApJ, 344, 685
- (27) Kennicutt, R.C. 1998a, ARA&A, 36, 189
- (28) Kennicutt, R.C. 1998b, ApJ, 498, 541
- (29) Kim, S., Dopita, M.A., Staveley-Smith, L., Bessell, M.S. 1999, AJ, 118, 2797
- (30) Kroupa, P. 2001, MNRAS, 322, 231
- (31) Lang, D., Hogg, D. W., Mierle, K., Blanton, M., Roweis, S. 2008, Making the sky searchable, Science, submitted (http://astrometry.net/biblio.html)
- (32) Leitherer, C., Robert, C., Drissen, L. 1992, ApJ, 401, 596
- (33) Leitherer, C., Schaerer, D., Goldader, J.D. et al., 1999, ApS, 123, 3
- (34) Leroy, A., Walter, F., Bigiel, F., Brinks, E., de Blok, W.J.H., Madore, .B, Thornley, M., AJ submitted
- (35) Loeb, A., Perna, R. 1998, ApJ, 503, L35
- (36) Martimbeau, N., Carignan, C., Roy, J.-R. 1994, AJ, 107, 543
- (37) Meynet, G., Maeder, A., Schaller, D., Charbonnel, C. 1994, A&A Supl. Ser., 103, 97
- (38) Miller, B.W., Hodge, P. 1994, ApJ, 427, 656
- (39) Moustakas, J. et al. 2007 (in preparation)
- (40) Oh, S.-H., de Blok, W.J.G., Walter, F., Brinks, E., Kennicutt, R.C. 2008, ApJ, submitted
- (41) Pasquali, A., Castangia, P., 2008, MNRAS, 385, 468
- (42) Pasquali, A., de Grijs, R., Gallagher, J.S. 2003, MNRAS, 345, 161
- (43) Pettini, M., Shapley, A.E., Steidel, C.C., Cuby, J.-G., Dickinson, M., Moorwoood, A.F.M., Adelberger, K.L., Giavalisco, M. 2001, ApJ, 554, 981
- (44) Ragazzoni, R., et al. 2006, Proc. SPIE, 6267, 626710
- (45) Rhode, K.L., Salzer, J.J., Westpfahl, D.J., Radice, L.A. 1999, AJ, 118, 323
- (46) Robert, C., Leitherer, C., Heckman, T.M. 1993, ApJ, 418, 749
- (47) Schaye, J. 2004, ApJ, 609, 667
- (48) Schlegel, D.J., Finkbeiner, D.P., Davis, M. 1998, ApJ, 500, 525
- (49) Schmidt, M. 1959, ApJ, 129, 243
- (50) Schmidt, M. 1963, ApJ, 137, 758
- (51) Scott, S.E. et al. 2002, MNRAS, 331, 817
- (52) Silk, J. 1997, ApJ, 481, 703
- (53) Shaya, E.J., Federman, S.R., 1987, ApJ, 319, 76
- (54) Skillman, E.D. 1987, in Star Formation in Galaxies, ed. C.J. Lonsdale Persson (Washington: NASA), 263
- (55) Steidel, C.C., Giavalisco, M., Pettini, M., Dickinson, M., Adelberger, K.L. 1996, ApJ, 462, L17
- (56) Stewart, S.G., Walter, F. 2000, AJ, 120, 1794
- (57) Tamburro, D., 2008, PhD Thesis
- (58) Tenorio-Tagle, G. 1980, A&A, 88, 61
- (59) Tenorio-Tagle, G. 1981, A&A, 94, 338
- (60) Tilanus, R.P.J., Allen, R.J., 1991, A&A, 244, 8
- (61) Tomita, A., Ohta, K., Nakanishi, K., Takeuchi, T.T., Saito, M. 1998, AJ, 116, 131
- (62) van der Hulst, T. 1996, ASP Conf. Ser. Vol. 106, 47
- (63) Walter, F., Brinks, E. 1999, AJ, 118, 273
- (64) Walter, F., Cannon, J.M., Roussel, H. et al. 2007, ApJ, 661, 102
- (65) Walter, F., Kerp, J., Duric, N., Brinks, E., Klein, U. 1998, ApJL, 502, L143
- (66) Weedman, D., 1991, in Massive Stars in Starbursts, eds. C. Leitherer, N. Walborn, T. Heckman & C. Norman (Cambridge: Cambridge University Press), p. 317
- (67) Wong, T., Blitz, L., 2002, ApJ, 569, 157