Experimental investigation of the origin of the cross-over temperature in the cuprates
Abstract
We investigate the cross-over temperature as a function of doping in (CaxLa1-x)(Ba1.75-xLa0.25+x)Cu3Oy, where the maximum () varies continuously by 30% between families () with minimal structural changes. is determined by DC-susceptibility measurements. We find that scales with the maximum Néel temperature of each family. This result strongly supports a magnetic origin of , and indicates that three dimensional interactions play a role in its magnitude.
pacs:
74.25.Dw,74.25.Ha,74.72.-hFree electrons do not have high temperature cross-overs such as a pseudogap (PG), spin gap (SG), or development of antiferromagnetic (AFM) correlations. In the cuprates all of these exist, yet the interactions that lead to them are not completely clear. Nevertheless, the cross-overs occur at a temperature which is much higher than , and closer to the three dimensional (3D) ordering temperature of the parent compound in the AFM state. Therefore, it is speculated that emerges from AFM fluctuations, and that the cross-overs are intimately linked, namely, the interaction responsible for one might be responsible for all friend ; Jperp ; HarrisonPRL07 . Therefore, it is crucial to test the possibility of correlations between of a particular system and its magnetic properties, such as the Néel temperature of the parent compound, or its constituents, the in- and out-of-plane Heisenberg coupling constant and , respectively. This is the motivation of the work presented here. We provide experimental evidence that strongly supports a magnetic origin for . Moreover, we show that stems from 3D interactions, similar to the Néel order, involving both and .
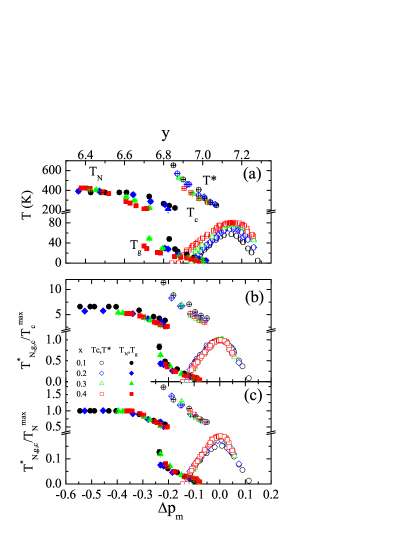
We investigate the origin of the by studying its variations as a function of the compound’s magnetic properties, where small chemical changes are an implicit parameter. The variations in the magnetic properties are achieved by using four different families of the (CaxLa1-x)(Ba1.75-xLa0.25+x)Cu3Oy (CLBLCO) system, having the YBa2Cu3Oy (YBCO) structure, with . The phase diagram of the CLBLCO families is shown in Fig. 1(a). was measured by resistivity Goldschmidt , and the spin glass temperature KanigelPRL02 and Rinat by muon spin relaxation. Despite the rich phase diagram, the different CLBLCO families have negligible structural differences. All compounds are tetragonal, and there is no oxygen chain ordering as in YBCO Goldschmidt . The hole concentration in the CuO2 planes does not depend on Chmaissem ; KerenToBe . The difference in the unit cell parameters and between the two extreme families ( and ) is 1% Goldschmidt . Thus, variations in due to variations in ionic radii are not relevant ChenPRB05 . The level of disorder, as detected by Cu and Ca nuclear magnetic resonance, is also identical for the different families KerenToBe ; MarchandThesis . In fact, the only strong variation between families noticed at present is the in-plane oxygen buckling angle OferToBe . This property can modify the intraplane near- and next-near-neighbors hopping, or interplane hopping, which controls the magnetic interaction strengths and ttt . The strong magnetic and superconducting variations of the CLBLCO system, accompanied by minimal structural changes, make it ideal for a correlation study between and magnetism.
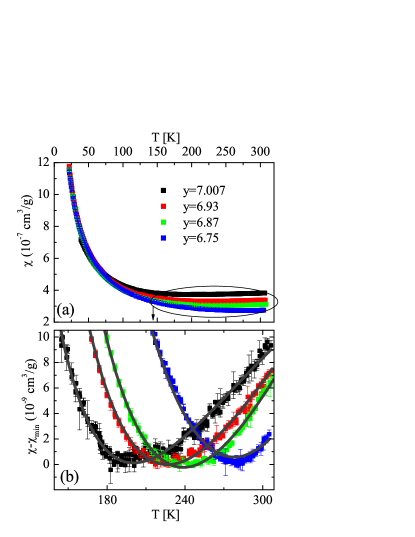
In this project we determine using temperature-dependent magnetization measurements. In Fig. 2(a) we present raw data from four samples of the family with different doping levels. At first glance the data contain only two features: A Curie-Weiss (CW) type increase of at low temperatures, and a non-zero baseline at high temperature . This base line increases with increasing . The CW term could be a result of isolated spins, impurities, or spins on the chain layer. However, as we will show shortly, there is much more to it. The baseline shift could be a consequence of variations in the core and Van Vleck (CVV) electron contribution or an increasing density of states at the Fermi level.
A zoom-in on the high temperature region, marked by the ellipse, reveals a third feature in the data; a minimum point of . To present this minimum clearly we subtracted from the raw data the minimal value of the susceptibility for each sample, and plotted the result on a tighter scale in Fig. 2(b). The minimum is a result of decreasing susceptibility upon cooling from room temperature, followed by an increase in the susceptibility due to the CW term at low T. This phenomenon was previously noticed by Johnston in YBCO Johnston0 , and Johnston and Nakano et al. in La2-xSrxCuO4 (LSCO) Johnson ; Nakano . The minimum point moves to higher temperatures with decreasing oxygen level as expected from . There are three possible reasons for this decreasing susceptibility: (I) increasing AFM correlations upon cooling Johnson , (II) opening of a SG where excitations move from to the AFM wave vector Neutrons , or (III) disappearing density of states at the Fermi level as parts of the Fermi arc are being gapped out when the PG opens as decreases Kanigel .
In order to determine the we fit the data to a three component function
| (1) |
The data are fitted without any restriction on the parameters. The quality of the fit is demonstrated in Fig. 2(b) by the solid lines; it captures the data precisely with barely observable deviations at very low doping where is at the edge of our measurement window. Of course on the broader scale of Fig. 2(a) there are no differences between the fit function (not shown) and data. At dopings higher than the CW term overwhelms the cross-over term due to its low , and the minimum is no longer detectable. At dopings lower than the minimum is out of the measurement window. These samples are not analyzed. The ’s determined by the fits (not shown) are found to behave smoothly and monotonically as a function of doping and family. and have the same order of magnitude as The function was chosen only because it fits the data best. However, we will analyze only the scaling properties of for which the absolute value is not relevant.
As for the amplitudes, it is most natural to relate to the weight of an impurity related CW contribution, to the crossed-over electrons, and to free electrons and CVV susceptibility. This division is based on the 2D Heisenberg model that predicts a decreasing susceptibility with decreasing temperature Assa . However, the situation at hand is closer to the t-J model for which the susceptibility is calculated by high temperature series expansion, and its behavior at is not known SinghPRB92 . Therefore, it is conceivable that the division of into impurities, crossed-over, and free electron and CVV contribution is artificial, that there is no impurities contribution, and that the susceptibility simply has two energy scales and . We are mostly interested in these two parameters and the evolution of with doping.
In Fig. 3(a) we plot for the different families. It is clearly increasing as a function of . The expected contribution from core electrons, taken from the standard tables selwood , is also expected to increase, but with a variation that is smaller in an order of magnitude. The Van Vleck contribution is also taken as a constant Johnson . Therefore, the increasing of with doping must result from either an increasing density of states at the Fermi level or decreasing correlation length . At very low doping, near the AFM phase, there are some differences between the families; the is higher for the family. However, at doping level in which superconductivity appears, is similar to all families. The density of states scenario is consistent with previous claims that the doping level in CLBLCO is -independent, at least in the superconducting region Goldschmidt ; KerenToBe . The correlation length scenario is not cosistent with our previous claims that varies by 30% between families Rinat since has exponential dependence Assa .
Since CLBLCO obeys the Uemura relation in the entire doping range KerenSSC03 , where is the superconducting carrier density, we conclude that the proportionality constant varies between families, or that not all holes turn superconducting. This conclusion reinforces our previous claims that Rinat , and that in CLBLCO not all the holes condense to superfluid KerenToBe .
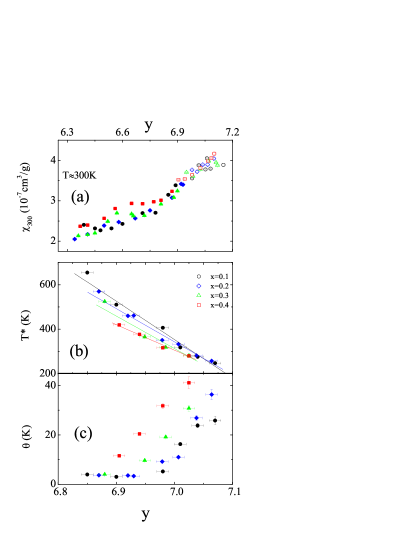
The parameter obtained from the fits is depicted in Fig. 3(b) on a tight scale (the solid lines are a guide to the eye), and as part of the full phase diagram in Fig. 1(a). It behaves like the well-known PG or SG measured by other techniques on a variety of superconductors samples friend . At the same time, a decrease of with doping is consistent with the AFM correlation picture as a progressive departure from the Mott insulator. More importantly, a small but clear family dependence of is seen. At first glance it appears that has anti-correlation with or the maximum (). The family, which has the highest and , has the lowest , and vice versa for the family.
However, this conclusion is reversed if instead of plotting the as a function of oxygen level, it is properly normalized, and plotted as a function of mobile hole variation . By mobile holes we mean holes that do turn superconducting as discussed above. is defined in two steps: I) The chemical doping measured from optimum, , is obtained for each compound ( is the oxygen level at ). II) is multiplied by a different constant per family , namely, Rinat . The ’s are chosen so that the superconductor domes, normalized by of each family, collapse onto each other; with % accuracy for -see Fig. 1(b)- .
We examine two possible normalizations of the critical temperatures: by or . In Fig. 1(b) we present all critical temperatures, normalized by , as a function of . As expected, all domes scale onto each other. So do the glass temperatures . for and families also collapse nicely. However, for the family does not. In Fig. 4(a) we zoom in on the , as a function of . The same problem is observed here as well. Next, we normalize all critical temperatures by as shown in Fig. 1(c). The values of are chosen so that the curves collapse onto each other, and are 379, 391.5, 410, and 423 K for the families, respectively. Therefore, should be interpreted as the extrapolation of to the lowest in Fig. 1(c). In this case, the curves of all family also collapse, but the domes do not. In Fig. 4(b), we zoom in on the /, as a function of . Now all the normalized curves overlap. Thus of each family scales better with than with . This is our main finding.
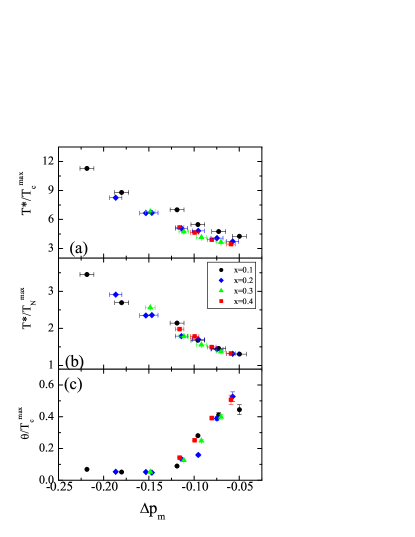
As for the CW parameter , although we did not expect any correlations between this parameter and or , we found an interesting trend shown in Fig. 3(c). In the antiferromagnetic region . As we go to higher doping levels this magnetic energy scale increases. This trend was previously observed by Bobroff et al. BobroffPTL99 . It is also clear that there are systematic variations of between the families. The has the strongest , and the the weakest. In fact, in Fig. 4(c) we plot as a function of . All data point collapse to a single curve. Once again we find that the proper doping parameter is , and not oxygen level , and the same energy scales control both and . These trends suggest that has nothing to do with impurities, as already hinted above.
Our results bare important new information on . When we normalize by we are actually normalizing by the in-plane energy scale of each family Rinat . If the cross-over was only a result of magnetic interaction between the spins in the planes (2D), should have scaled with . The imperfect normalization by , demonstrated in Fig. 4(a), contradicts this possibility. When we normalize by , we are taking into the account the coupling between the planes (3D) as well. The success of the normalization by , shown in Fig. 4(b), implies that is governed by 3D magnetic interaction.
The importance of was previously discussed in Ref. Jperp . Our finding is also consistent with the concept of a 3D to 2D crossover above in which planes decouple from each other PlaneDecoup . Finally, it is consistent with Nakano et al. where by comparing LSCO to Bi2Sr2CaCu2O8+δ a proportionality between and an unspecified magnetic energy scale is found NakanoJPSJ98 .
To summarize, after converting oxygen level to mobile holes variations , we find that the cross-over temperature measured by susceptibility in the CLBLCO system is proportional to . is set by both in- and out-of-plane coupling constants that are determined by in- and out-of-plane hoppings. This result suggests a 3D magnetic origin for . In addition, the CW-like term of the susceptibility is not a result of impurities. It might be an intrinsic property of doped CuO2 planes at low temperatures.
We would like to acknowledge financial support from the Israel Science Foundation and the Posnansky research fund in high temperature superconductivity.
References
- (1) T. Timusk and B. Statt, Rep. Prog. Phys. 62, 61 (1999); M. R. Norman, D. Pines, and C. Kallin, Advances in Physics 54, 715 (2005); P. A. Lee, N. Nagaosa, and X.-G. Wen, Rev. Mod. Phys. 78, 17 (2006).
- (2) N. Harrison, R. D. McDonald, and J. Singleton, Phys. Rev. Lett. 99 206406 (2007).
- (3) A. J. Millis and H. Monien, Phys. Rev. Lett. 70, 2810 (1993); M. U. Ubbens and P. A. Lee, Phys. Rev. B 50, 438 (1994); L. B. Ioffe et al., JETP Lett. 59, 65 (1994).
- (4) D. Goldschmidt, G. M. Reisner, Y. Direktovitch, A. Knizhnik, E. Gartstein, G. Kimmel, and Y. Eckstein, Phys. Rev. B 48, 532 (1993).
- (5) A. Kanigel, A. Keren, Y. Eckstein, A. Knizhnik, J. S. Lord, and A. Amato, Phys. Rev. Lett. 88, 137003 (2002).
- (6) R. Ofer, G. Bazalitsky, A. Kanigel, A. Keren, A. Auerbach, J. S. Lord, and A. Amato, Phys. Rev. B 74, 220508 (2006).
- (7) O. Chmaissem, Y. Eckstein, and C. G. Kuper, Phys. Rev. B 63, 174510 (2001).
- (8) A. Keren, A. Kanigel, and G. Bazalitsky, Phys. Rev. B 74, 172506 (2006).
- (9) X.-J. Chen and H. Su, Phys. Rev. B 71, 094512 (2005).
- (10) Sebastien Marchand, Ph. D. thesis, Universite Paris 6.
- (11) R. Ofer, A. Keren, and O. Chmaissem, in preparation.
- (12) J. Zaanen and G. A. Sawatzky, Canadian Journal of Physics 65, 1262 (1987); E. Pavarini, I. Dasgupta , T. Saha-Dasgupta, O. Jepsen, and O. K. Andersen, Phys. Rev. Lett. 87, 047003 (2001); X. J. Chen and H. Q. Lin, Phys. Rev. B 69, 104518 (2004).
- (13) D. C. Johnston, A. J. Jacobson, J. M. Newsam. J. T. Lewandowski, D. P. Goshorn, D. Xie and B. Yelon, Chemistry of High-Temperature Superconductors, American Chemical Society, Washington DC 1987, p. 149.
- (14) D. C. Johnston, Phys. Rev. Lett. 62, 957 (1989).
- (15) T. Nakano, M. Oda, C. Manabe, N. Momono,Y. Miura, and M. Ido, Phys. Rev. B 49 16000 (1994).
- (16) J. Rossat-Mignod, L. P. Regnault, C. Vettier, P. Bourges, P. Burlet, J. Bossy, J. Y. Henry, and G. Lapertot, Physica B 180–181, 383 (1992); L. P. Regnault, P. Bourges, P. Burlet, J. Y. Henry, J. Rossat-Mignod, Y. Sidis, C. Vettier Physica C, 235–240, 59 (1994); M.-H. Julien, P. Carretta, M. Horvatić, C. Berthier, Y. Berthier, P. Ségransan, A. Carrington, and D. Colson, Phys. Rev. Lett. 76, 4238 (1996).
- (17) A. Kanigel, M. R. Norman, M. Randeria, U. Chatterjee, S. Souma, A. Kaminski, H. M. Fretwell, S. Rosenkranz, M. Shi, T. Sato, T. Takahashi, Z. Z. Li, H. Raffy, K. Kadowaki, D. Hinks, L. Ozyuzer, and J. C. Campuzano, Nature Physics 2, 447 (2006).
- (18) A. Auerbach and D. P. Arovas, Phys. Rev. Lett. 61, 617 (1988).
- (19) R. R. P. Singh and R. L. Glenister, Phys. Rev. B 46, 11871 (1992).
- (20) P. W. Selwood, Magnetochemistry p.78, second edition, Interscience Publishers, 1956.
- (21) A. Keren, A. Kanigel, J. S. Lord, and A. Amato, Solid State Commun. 126, 39 (2003). A. Kanigel, A. Keren, A. Knizhnik, and O. Shafir, Phys. Rev. B 71, 224511 (2005).
- (22) J. Bobroff, W. A. MacFarlane, H. Alloul1, P. Mendels, N. Blanchard, G. Collin, and J.-F. Marucco, Phys. Rev. Lett. 83, 4381 (1999).
- (23) E. Berg, E. Fradkin, E.-A. Kim, S. A. Kivelson, V. Oganesyan, J. Tranquada, and S. Zhang, Phys. Rev. Lett. 99, 127003 (2007).; Q. Li, M. Huecker, G. D. Gu, A. M. Tsvelik, and J. M. Tranquada, Phys. Rev. Lett. 99, 067001 (2007).
- (24) T. Nakano, N. Momono, M. Oda, and M. Ido, J. Phys. Soc. Jpn. 67, 2622 (1998).