Radio spectrum of the AXP J1810197 and of its profile components
Abstract
As part of a European Pulsar Network (EPN) multi-telescope observing campaign, we performed simultaneous multi-frequency observations at 1.4, 4.9 and 8.4 GHz during July 2006 and quasi-simultaneous multi-frequency observations from December 2006 until July 2007 at 2.7, 4.9, 8.4, 14.6 and 32 GHz, in order to obtain flux density measurements and spectral features of the 5.5-sec radio-emitting magnetar AXP J1810197 . We monitored the spectral evolution of its pulse shape which consists of a main pulse (MP) and an interpulse (IP). We present the flux density spectrum of the average profile and of the separate pulse components of this first-known radio-emitting transient anomalous X-ray pulsar. We observe a decrease of the flux density by a factor of 10 within 8 months and follow the disappearance of one of the two main components. Although the spectrum is generally flat, we observe large fluctuations of the spectral index with time. For that reason we have made some measurements of modulation indices for individual pulses in order to also investigate the origin of these fluctuations.
keywords:
stars: neutron - pulsars: general - pulsars: individual: AXP J1810-1971 Introduction
Magnetars, as first discussed by Duncan & Thompson (1992), are considered to be slowly rotating neutron stars with spin periods of 5-12 seconds and a rapid spin-down. They exhibit extremely strong magnetic fields, typically G, the decay of which is believed to create the observable high X-ray and gamma-ray luminosities, often visible in bursts.
The model of magnetars tends to fit two previously described distinct classes of objects, the soft gamma-ray repeaters (SGRs) and the Anomalous X-ray pulsars (AXPs). Common properties of the members of both classes are their long rotation periods (AXPs; Mereghetti & Stella, 1995), (SGRs; Kouveliotou et al., 1999) and the bursting nature of their emission (Kaspi et al., 2003; Gavriil, Kaspi & Woods, 2002). They are usually radio quiet. However, the pulsed radio emission that has been detected from AXP J1810197 (Camilo et al., 2006) and AXP 1E1547.05408 (Camilo et al., 2008) indicates that this is not always the case.
The AXP XTE J1810197 was discovered by Ibrahim et al. (2004) in Rossi X-ray Timing Explorer (RXTE) data of the source SGR 180620, taken in January 2003. With a period of 5.54 seconds and a period derivative ss-1, a magnetic field of Gauss is implied. Although the previous observations clearly identified it as an AXP, the extreme variation in the X-ray flux also classified it as the first transient AXP.
The detection of a radio source coincident with the position of AXP J1810197 by Halpern et al. (2005) first raised the possibility that this was the first radio emitting magnetar. This possibility was confirmed with the detection of strong, narrow and highly variable radio pulses, with the same pulse period as determined at high-energies, by Camilo et al. (2006). Further observations have shown that the emission is 80-95 % polarised, mostly linear, but with a significant degree of circular polarisation at all observed frequencies (Kramer et al., 2007; Camilo et al., 2007a). One of the most remarkable features of the radio emission from this source is its flat radio spectrum. Radio pulsars are normally characterised by the steepness of their spectrum (Maron et al., 2000; Löhmer et al., 2008), which makes their detection at frequencies above 30 GHz very difficult. However, soon after the discovery of its radio emission, it became clear that AXP J1810197 had a flat radio spectrum (Camilo et al., 2006, 2007c) and for a time became the brightest neutron star at frequencies greater than about 40 GHz. Strong variations in the pulsed intensity and the profile phase were visible in the initial observations (Camilo et al., 2007b), although it also became evident that the average pulsed flux density was decreasing with time.
In this paper we report on the results of simultaneous and quasi-simultaneous multi-frequency observations conducted at the radio frequencies of 1.41, 4.90 and 8.35 GHz during July 2006 and 2.64, 4.85, 8.35, 14.6 and 32 GHz from December 2006 to July 2007. We present the radio spectrum of the total radio flux density of AXP J1810197 and of its individual profile components and the results of power-law fits to this spectrum. We also consider the time variability of the fitted spectral index in light of the modulation of individual pulses and the intra-day flux density variability. A full discussion of the individual pulse properties will follow in a separate paper.
2 Observations
The simultaneous observations were made using the 100-m radiotelescope of the Max-Planck Institute for Radioastronomy (MPIfR) at Effelsberg, Germany, the 76-m Lovell radiotelescope at Jodrell Bank observatory of the University of Manchester, UK and the 94-m equivalent Westerbork Synthesis Radio Telescope (WSRT) in the Netherlands. The quasi-simultaneous observations were made with the Effelsberg radiotelescope. In total there were 8 simultaneous multi-telescope multi-frequency sessions during July 2006 and 10 quasi-simultaneous multi-frequency between December 2006 and July 2007. For the latter sessions the new sub-reflector of the Effelsberg telescope was used. It was installed in October 2006, improving the sensitivity and resulting in flatter gain curves but also allowing fast receiver changes between secondary and primary focus. The integration time for every session depended on the observing frequency and the observational circumstances. In general, the time needed for 1.42, 2.64, 4.85 and 4.90 GHz was around 5-15 min, for 8.35 GHz around 20 min and for 14.6 and 32 GHz around 25-40 min. Details of the observing sessions are summarised in Tables 1 and 2.
2.1 Calibration Procedures
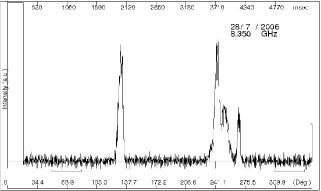
The observing and calibration procedures for Effelsberg data were the same for the simultaneous and quasi-simultaneous session. We used the 2.64 GHz, 4.85 GHz, 8.35 GHz, 14.6 GHz and 32 GHz cooled HEMT receivers that are installed in the secondary focus (Karastergiou et al., 2001). In order to calibrate the flux density of a pulsar at the Effelsberg radio telescope reliably, a noise diode signal is injected into the wavefront following the horn synchronously with the pulse period in the beginning of each measurement (Figure 2). The power output of the diode is compared with the power that is received from the pulsar. The signal of the noise diode itself is frequently calibrated and monitored by observing known reference sources during regular pointing observations. The sources that were used for calibration were 3C273, 3C274, 3C286 and NGC7027. They were observed at the beginning and the end of each session, in combination with checks on pointing and focus stability. The whole procedure of Effelsberg calibration is described further in Angelakis (2007). We also monitored the quality of our observations by taking data for well known pulsars such as PSR B1929+10 which is strong enough to be detected at all frequencies up to 43 GHz. The observed properties of this pulsar, extensively also studied at Effelsberg, were compared to archival data to confirm that the system was functioning correctly at all frequencies. The observing and calibration procedures for the other telescopes participating in our simultaneous observations between May and July 2006 are described for each telescope in detail in Kramer et al. (2007).
| Date | Session | Telescope | Frequency | BW |
|---|---|---|---|---|
| (GHz) | (MHz) | |||
| 31/05/06 | 1 | Lovell | 1.42 | 32 |
| WSRT | 4.90 | 160 | ||
| Effelsberg | 8.35 | 1000 | ||
| 10/07/06 | 2 | Lovell | 1.42 | 32 |
| Effelsberg | 8.35 | 1000 | ||
| 17/07/06 | 3 | Lovell | 1.42 | 32 |
| WSRT | 4.90 | 160 | ||
| Effelsberg | 8.35 | 1000 | ||
| 21/07/06 | 4 | Lovell | 1.42 | 32 |
| WSRT | 4.90 | 160 | ||
| 22/07/06 | 5 | Lovell | 1.42 | 32 |
| WSRT | 4.90 | 160 | ||
| Effelsberg | 8.35 | 1000 | ||
| Effelsberg | 14.60 | 2000 | ||
| 23/07/06 | 6 | Lovell | 1.42 | 32 |
| WSRT | 4.90 | 160 | ||
| 26/07/06 | 7 | Lovell | 1.42 | 32 |
| Effelsberg | 4.85 | 500 | ||
| WSRT | 4.90 | 160 | ||
| Effelsberg | 8.35 | 1000 | ||
| Effelsberg | 14.60 | 2000 | ||
| 28/07/06 | 8 | Lovell | 1.42 | 32 |
| Effelsberg | 4.85 | 500 | ||
| WSRT | 4.90 | 160 | ||
| Effelsberg | 8.35 | 1000 | ||
| Effelsberg | 14.60 | 2000 |
| Date | Session | Telescope | Frequency | BW |
|---|---|---|---|---|
| (GHz) | (MHz) | |||
| 09/12/06 | 1 | Effelsberg | 2.64 | 100 |
| 4.85 | 500 | |||
| 8.35 | 1000 | |||
| 14.60 | 2000 | |||
| 26/12/06 | 2 | Effelsberg | 2.64 | 100 |
| 4.85 | 500 | |||
| 8.35 | 1000 | |||
| 14.60 | 2000 | |||
| 04/02/07 | 3 | Effelsberg | 2.64 | 100 |
| 4.85 | 500 | |||
| 8.35 | 1000 | |||
| 14.60 | 2000 | |||
| 06/02/07 | 4 | Effelsberg | 4.85 | 500 |
| 32.00 | 2000 | |||
| 12/02/07 | 5 | Effelsberg | 4.85 | 500 |
| 14.60 | 2000 | |||
| 17/02/07 | 6 | Effelsberg | 4.85 | 500 |
| 8.35 | 1000 | |||
| 14.60 | 2000 | |||
| 32.00 | 2000 | |||
| 18/02/07 | 7 | Effeslberg | 4.85 | 500 |
| 8.35 | 1000 | |||
| 14.60 | 2000 | |||
| 32.00 | 2000 | |||
| 26/03/07 | 8 | Effelsberg | 4.85 | 500 |
| 14.60 | 2000 | |||
| 32.00 | 2000 | |||
| 05/05/07 | 9 | Effelsberg | 4.85 | 500 |
| 8.35 | 1000 | |||
| 32.00 | 2000 | |||
| 06/07/07 | 10 | Effelsberg | 4.85 | 500 |
| 8.35 | 1000 | |||
| 14.60 | 2000 |
3 Data Analysis & Results
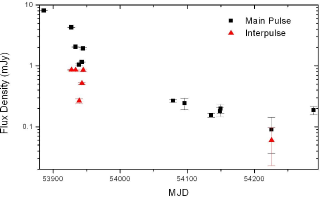
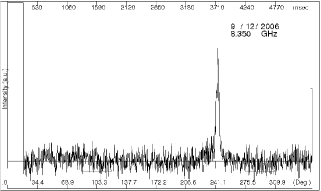
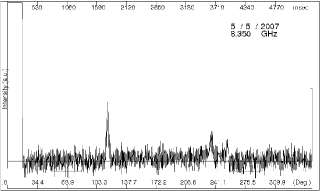
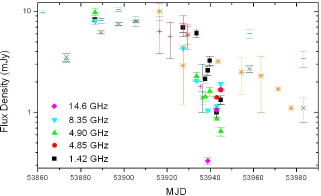
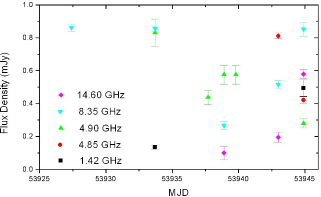
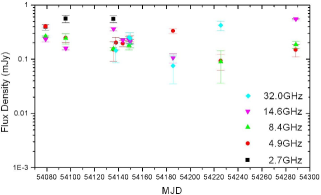
Until August 2006, the integrated pulse profile of AXP J1810197 consisted of two major well-separated features which we discussed in some detail already in Kramer et al. (2007). Following the same convention, we refer to them as the main pulse (MP, right feature in Figure 2a) and interpulse (IP, left feature in Figure 2a). The MP is the more complex and wider of the two, with a varying width of about 0.7 seconds (or 45 deg in pulse longitude) while the IP is much narrower with a width of typically 0.2 seconds (or 12 deg longitude). In some cases, three or more distinct sub-components were visible in the MP. The simpler IP was not always visible and was only strongly detected during parts of our observations, as indicated in Figure 1 where we present the daily average flux densities of the two components as measured at 8.4 GHz as a function of time. The identification of the remaining visible pulse feature (see e.g. Figure 2b) with the MP is possible due to timing information obtained from regular monitoring observations with the Lovell telescope at the Jodrell Bank observatory (Lyne et al. in preparation). After the disappearance of the IP in summer 2006, both MP and IP were visible again simultaneously only during one short session in May 2007. The IP remains undetected since.
Overall, the flux density of the source has significantly decreased since its first detection at radio frequencies (see Figure 1), which is consistent with the earlier findings by Camilo et al. (2007b). Due to differences in the frequency range of the simultaneous and quasi-simultaneous observations we discuss further results from these campaigns separately.
3.1 Simultaneous Observations
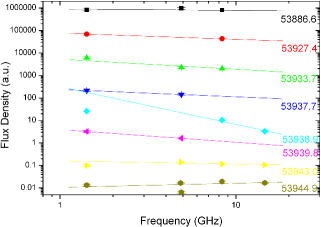
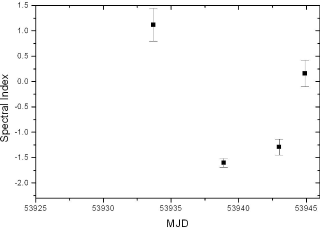
The flux densities measured during the simultaneous observations and the spectral indices derived from power law fits, ) to these data, are listed in Table 3 and are shown in Figures 3 and 4. For each observation we summed all individual pulses to obtain an integrated total power profile that was flux calibrated. The nominal conservative uncertainties for our flux density measurements are about 10% (see also Section 3.2). In addition to our flux densities, we also utilize published flux densities measured at 1.42 and 4.8 GHz with the VLA (Camilo et al., 2007c) and at 1.4 and 4.8 GHz at the Mount Pleasant observatory (Hotan et al., 2007) (see Fig. 3). Our flux densities observed for the MP at similar epochs for these frequencies are in good agreement with these values. This fact indicates that the effect of interstellar scintillation may be small due to the large observing bandwidths, but we will discuss the possible impact of the interstellar medium on our results in more detail later. Overall, a large decrease in the signal strength with time is observed. At the same time, the spectrum is generally flat with an average spectral index of for the MP and for the IP (see Fig. 3 and 4), consistent with results by Camilo et al. (2006, 2007c). However, around MJD 53938 (2007 July 22) we observe a strong time variability, with the spectrum being initially steep and then flattening day by day for both MP and IP.
| Date | Frequency | ||
|---|---|---|---|
| (GHz) | (mJy) | ||
| 31/05/06 | 1.42 | ||
| 4.90 | |||
| 8.35 | |||
| 10/07/06 | 1.42 | ||
| 8.35 | |||
| 17/07/06 | 1.42 | ||
| 4.90 | |||
| 8.35 | |||
| 21/07/06 | 1.42 | ||
| 4.90 | |||
| 22/07/06 | 1.42 | ||
| 8.35 | |||
| 14.60 | |||
| 23/07/06 | 1.42 | ||
| 4.90 | |||
| 26/07/06 | 1.42 | ||
| 4.85 | |||
| 4.90 | |||
| 8.35 | |||
| 14.60 | |||
| 28/07/06 | 1.42 | ||
| 4.85 | |||
| 4.90 | |||
| 8.35 | |||
| 14.60 |
| Date | Frequency | ||
|---|---|---|---|
| (GHz) | (mJy) | ||
| 10/07/06 | 8.35 | - | |
| 17/07/06 | 1.42 | ||
| 4.90 | |||
| 8.35 | |||
| 21/07/06 | 4.90 | - | |
| 22/07/06 | 4.90 | ||
| 8.35 | |||
| 14.60 | |||
| 23/07/06 | 4.90 | - | |
| 26/07/06 | 4.85 | ||
| 8.35 | |||
| 14.60 | |||
| 28/07/06 | 1.42 | ||
| 4.85 | |||
| 4.90 | |||
| 8.35 | |||
| 14.60 |
3.2 Quasi-Simultaneous Observations
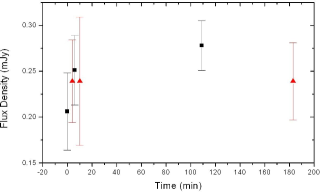
All quasi-simultaneous observations were performed with Effelsberg alone. The short time needed to switch between the different receivers (i.e. s between secondary focus receivers, and min between secondary and primary receivers) made it possible to observe at a wide range of frequencies in a single observing session. The longest multi-wavelength observing session (without the calibration scans) of AXP J1810197 was about four hours, during which frequencies were cycled through repeatedly in order to detect any short-term variability. Using these data, we not only studied the long term variability of AXP J1810197 , but also the medium-term intra-day flux density fluctuations as well as the modulation of individual pulses during each of these sessions. An example of such measurements is shown in Fig 5 where we present the flux density as measured repeatedly at 4.85 GHz over two consecutive days. The observed variation is consistent with a constant flux density over this period. The results of all our quasi-simultaneous observations are summarized in Table 5.
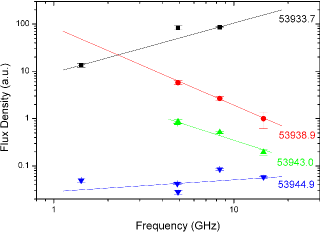
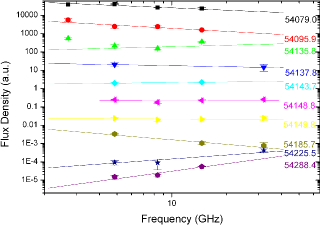
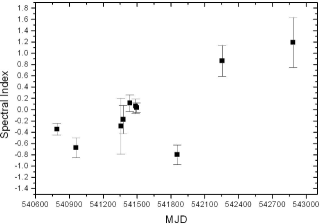
The average flux density values were then used to determine the spectra and their indices. This was done for each session and the results are shown in Figure 6. The results are consistent with and extend those of the simultaneous measurements. We find again that the spectrum is generally flat with a mean spectral index of but it is also variable on a day-to-day basis with significant variations around its mean value. This is reflected also by the variation of the flux densities measured at 8.35 GHz and above which appear to sometimes follow a common pattern that is anti-correlated with changes seen below that frequency. There is an indication of a general increase of over the 210 days covered by our observations, starting with initial values around and reaching near the end of the observing period.
| Date | Frequency | ||
|---|---|---|---|
| (GHz) | (mJy) | ||
| 09/12/06 | 2.64 | ||
| 4.85 | |||
| 8.35 | |||
| 14.60 | |||
| 26/12/06 | 2.64 | ||
| 4.85 | |||
| 8.35 | |||
| 14.60 | |||
| 04/02/07 | 2.64 | ||
| 4.85 | |||
| 8.35 | |||
| 14.60 | |||
| 06/02/07 | 4.85 | ||
| 32.00 | |||
| 12/02/07 | 4.85 | ||
| 14.60 | |||
| 17/02/07 | 4.85 | ||
| 8.35 | |||
| 14.60 | |||
| 32.00 | |||
| 18/02/07 | 4.85 | ||
| 8.35 | |||
| 14.60 | |||
| 32.00 | |||
| 26/03/07 | 4.85 | ||
| 14.60 | |||
| 32.00 | |||
| 05/05/07 | 4.85 | ||
| 14.60 | |||
| 32.00 | |||
| 06/07/07 | 4.85 | ||
| 8.35 | |||
| 14.60 |
3.3 Modulation Indices
In order to characterise the observed flux density variations and to obtain reliable estimates for the measurement uncertainties, we also studied the modulation of the single pulse flux densities (see e.g. Kramer et al. (2003) and Serylak et al. (2007)). We can use these results also to estimate the impact of the interstellar medium on our measurements, following similar studies such as that conducted for pulsars by Malofeev et al. (1996) at very similar frequencies, i.e. 4.75 GHz and 10.55 GHz.
We concentrate on the flux densities measured at 4.85 GHz and 14.6 GHz during our quasi-simultaneous sessions. The flux densities at these frequencies were measured in every session, often at the beginning and the end of a session, providing a densely sampled data set that gives a good representation of the behaviour between widely spaced frequencies.
As a comparison, we also studied data for our reference source PSR B1929+10 to rule out systematic effects, impact of weather, or instabilities in the receivers chain. We find, as expected, only minor variations in the flux density of this well known pulsar at high frequencies, in line with the findings of Malofeev et al. (1996).
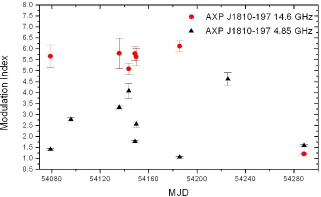
For each session, we calculated the pulse-to-pulse modulation index according to (e.g. Kramer et al. 2003), where is the measured flux density, its mean value and its standard deviation. We present the results in Figure 7. As already expected from our discussion in Kramer et al. (2007) and consistent with early observations of AXP J1810197 by Camilo et al. (2006), the pulses are very highly modulated and variable for both frequencies. For the densely covered period of time around epoch MJD 54150 (04 February-26 March 2007) the data occasionally suggest a behaviour that is anti-correlated between 4.85 GHz and 14.6 GHz. Overall, the higher frequency shows greater modulation, but it is possible that weaker single pulses are more difficult to detect at these frequencies. Despite this large modulation of the single pulses, averaging over sufficient time as done during all our observations essentially removes the variation for a given measurement value, leading to relative uncertainties in of the order where is the number of averaged pulses. This is consistent with our estimated flux density errors and confirmed by the repeatability of our flux density measurements over consecutive days (see Fig 5). We therefore expect the impact of slow-varying effects caused by refractive scintillation to be more important. We will discuss this in the following.
4 Discussion
Our monitoring observations of AXP J1810197 and its flux density spectrum over the course of more than one year appears to confirm the conclusion derived already in all previous studies of it, that AXP J1810197 behaves unlike most or even any known radio pulsar. Several observed properties support this fact. In our range of studied frequencies, the source exhibits a generally flat flux density spectrum, with values of spectral index consistent with those measured by Camilo et al. (2006, 2007c). These flat spectra allowed us to observe the source up to very high frequencies, at least when compared to radio frequencies typically used for ordinary pulsar observations. An example is our detection of the magnetar at 43 GHz in May 2007 with the Effelsberg radiotelescope. This is only the fifth neutron star detected at mm (Kramer et al., 1997) and the only one where single pulses could be observed. This is consistent with observations at the IRAM 30 m telescope at 88 and 144 GHz by Camilo et al. (2007c), representing the highest radio frequency at which a neutron star has been detected. For normal pulsars, we often see breaks in their power law spectra at high frequencies (Maron et al., 2000; Kijak, Gupta & Krzeszowski, 2007) or even occassionally a turn-up at mm-wavelengths (Kramer et al., 1997). Here, in our range of frequencies, the spectrum of AXP J1810197 is well described by a single, flat power law, of the form with .
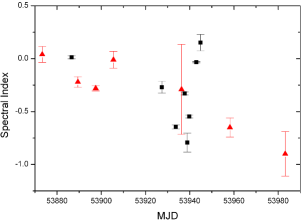
In those cases where both the MP and IP were detected, their spectral indices were found to be differing, with the IP showing a significantly greater variation. Even though the spectra appear to change in the same manner from day to day, becoming steeper or flatter together, the IP exhibited many more extreme positive and negative steep values. This is somewhat surprising since the MP spectral index reflects emission from a wider range of emission components, in comparison to an IP that is always observed as a rather simple emission feature. The variation of the spectrum is roughly consistent with the model by Thompson (2008) where timescales of day may be explained by current-driven instabilities on the closed magnetic field lines. The observation that it affects the IP and MP in a different way is interesting and may support the idea of a rather twisted magnetosphere. Although the spectrum is generally flat, the spectral index shows significant variation, with a slight trend of becoming more positive with time.
While we have shown that the effect of the significant pulse-to-pulse modulation can be removed by averaging a sufficient number of pulses, another well known cause for flux density variations, and hence possible spectral index variations, is interstellar scintillations (ISS). Based on studies of the ISS at 4.75 GHz and 10.55 GHz by Malofeev et al. (1996), the relatively large dispersion measure of DM = 178 pc cm-3 and the estimated distance of 3.3 kpc, suggests a critical scintillation frequency of 14 GHz, well within our observing band at 14.6 GHz. At this frequency, we may therefore expect a large variation of the measured flux density, whereas above the critical frequency we expect low flux density variations due to weak scintillation. Below strong scintillation will occur, with a branch due to diffractive scintillation and one due to refractive scintillation. Lorimer & Kramer (2005) use a different functional dependence for the transition frequency which yields an GHz which agrees with the estimates by Camilo et al. (2007c) but is also smaller than GHz as derived from the NE2001 electron density model (Cordes & Lazio, 2002). Despite these differences, the usage of large integration times and observing bandwidths will effectively average a number of scintils, resulting in reliable flux density measurements if bandwidth and integration time are sufficiently large. Following Lorimer & Kramer (2005), at 15 GHz we estimate a diffractive scintillation bandwidth MHz and a diffractive scintillation timescale of s which is in good agreement with the characteristics of features seen in the dynamic spectrum at the same frequency by Ransom et al. (2007). Our observations always average over several diffractive scintles in frequency and in time, but will be affected by refractive scintillations at high frequencies. Around 15 GHz, the modulation index for refractive scintillations is estimated as and the timescale for refractive modulations turns out to be hours. Our observatories could not track the source for such a long time, so that we account for these possible variations with an increased quoted flux density error. For typical integration times of min, our observing set-up should result in typical errors of our individual flux density measurements due to refractive and diffractive scintillations of about 20% at 1.4 GHz, rising to a maximum of 77% at 14.6 GHz and levelling off at about 62% at 33 GHz and above. Similar estimates for the low-DM reference source PSR B1929+10 are in good agreement with the observations. We therefore conclude that the ISS plays a significant role in the individual flux density measurements, although it cannot be responsible for the pulse-to-pulse modulation index, and the described variations of the spectral index for different features of the profile between individual sessions.
Considering the overall flux density of AXP J1810197 , we can divide our observations, spanning more than a year, in four intervals. The first lasts until July 2006 when the average flux density from the source was above 6 mJy. The second lasted from July to September 2006 when the average flux density was above 1 mJy. The third epoch lasted from October 2006 to July 2007 when the flux density was below 0.5 mJy and, finally the time after July 2007 when the source became too weak for regular detection. At the same time, we observe a trend that the flux density variations are larger in the low-flux stages. This naturally makes the flux density spectrum computation less certain.
Due to the variability of the flux densities, it is difficult to compute an average spectrum. Especially when we inspect the flux density measurements from the third epoch, we see many cases in which the high and the low frequencies vary in a completely different manner for the same day. As we have seen, some anti-correlation in flux density variations between high and low frequencies appears present, and given our discussion above, we consider these variations to be intrinsic to the source and not due to ISS. They can in part be explained by the assumption that we observe different components of the MP on different days. However, a similar variation is also observed for the IP, where always the same emission component is visible. Therefore, we conclude that in contrast to pulsars, the radio emission of magnetars is not intrinsically stable. That is consistent with the overall decay of the flux density in recent months and may indicate that the radio emission is a transient phenomenon that was triggered by the high-energy outburst. As the conditions for radio emission may revert back to the pre-outburst stage, it will be interesting to monitor the source during and after the next outburst.
5 Summary
As a result of a coordinated measurement campaign of three telescopes operating simultaneously at four different frequencies and several daily Effelsberg measurements up to frequencies of 43 GHz, we find AXP J1810197 to be an unusual pulsating radio source. Its spectral properties and temporal fluctuations differ remarkably from normal pulsars.
A complex picture of the variability of the radio flux density emerges as a result of our observations. Significant variability exists on all considered time scales, from pulse to pulse, day-to-day and over the time of weeks and months, most of being it due to intrinsic variations (profile changes) and only some of it affected by scintillations.
Normal pulsars have stable average profiles enabling us to model their emission mechanism. This is however not possible with this source. Also the very flat spectrum and the visibility to high frequencies makes the source unique among radio emitting neutron stars.
Acknowledgements
Kosmas Lazaridis was supported for this research through a stipend from the International Max Planck Research School (IMPRS) for Astronomy and Astrophysics at the Universities of Bonn and Cologne. We especially thank Emmanouil Angelakis for the programming help and for the fruitful discussions. Maciej Serylak was supported by the EU Framework 6 Marie Curie Early Stage Training programme under contract number MEST-CT-2005-19669 ”ESTRELA”.
References
- Angelakis (2007) Angelakis E., 2007, Ph.D. Thesis, University of Bonn
- Camilo et al. (2006) Camilo F., Ransom S.M., Halpern J.P., Reynolds J., Helfand D.J., Zimmerman N., Sarkissian J., 2006, Nature, 442, 892
- Camilo et al. (2007a) Camilo F., Reynolds J., Johnston S., Halpern J.P., Ransom S.M., van Straten W., 2007, ApJ, 639, L37
- Camilo et al. (2007b) Camilo F. et al., 2007, ApJ, 663, 497
- Camilo et al. (2007c) Camilo F. et al., 2007, ApJ, 669, 561
- Camilo et al. (2008) Camilo F., Reynolds J., Johnston S., Halpern J.P., Ransom S.M., 2008, ApJ, 679, 681
- Cordes & Lazio (2002) Cordes J.M., Lazio T.J.W., 2002, ArXiv e-prints
- Duncan & Thompson (1992) Duncan R.C., Thompson C., 1992, ApJ, 392, L9
- Gavriil, Kaspi & Woods (2002) Gavriil F.P., Kaspi V.M., Woods P.M., 2002, Nature, 419, 142
- Halpern et al. (2005) Halpern J.P., Gotthelf E.V., Becker R.H., Helfand, D. J., White, R. L., 2005, ApJ, 632, L29
- Hotan et al. (2007) Hotan A.W., Long S.R., Dickey J.M., Dolley T.J., 2007, ApJ, 668, 449
- Ibrahim et al. (2004) Ibrahim A.I. et al., 2004, ApJ, 609, L21
- Karastergiou et al. (2001) Karastergiou A. et al., 2001, A & A, 379, 270
- Kaspi et al. (2003) Kaspi V.M., Gavriil F.P., Woods P.M., Jensen J.B., Roberts M.S.E., Chakrabarty D, 2003, ApJ, 588, L93
- Kijak, Gupta & Krzeszowski (2007) Kijak J., Gupta Y., Krzeszowski K., 2007, A & A, 462, 699
- Kouveliotou et al. (1999) Kouveliotou C. et al., 1999, ApJ, 510, L115
- Kramer et al. (1997) Kramer M., Jessner A., Dorosenko O., Wielebinski R., 1997, ApJ, 488, 364
- Kramer et al. (2003) Kramer M., Karastergiou A., Gupta Y., Johnston S., Bhat N.D.R., Lyne A.G. 2003, A & A, 407, 655
- Kramer et al. (2007) Kramer M., Stappers B.W., Jessner A., Lyne A.G., Jordan C.A., 2007, MNRAS, 377, 107
- Löhmer et al. (2008) Löhmer O., Jessner A., Kramer M., Wielebinski R., Maron O., 2008, A & A, 480, 623
- Lorimer & Kramer (2005) Lorimer D.R. and Kramer M., 2005, Handbook of pulsar astronomy, Cambridge University press, Cambridge
- Malofeev et al. (1996) Malofeev V.M., Shishov V.I., Sieber W., Jessner A., Kramer M., Wielebinski R., 1996, A & A, 308, 180
- Maron et al. (2000) Maron O., Kijak J., Kramer M., Wielebinski R., 2000, A & AS, 147, 195
- Mereghetti & Stella (1995) Mereghetti S., Stella L,1995, ApJ, 442, L17
- Ransom et al. (2007) Ransom S. et al., 2007, in Pulsar searching and Thai-ming, 2007-SKA, Nat. Astr. Res. Inst. of Thail., Thailand
- Serylak et al. (2007) Serylak M., Kijak J., Maron O., Jessner A., 2007, submitted
- Thompson et al. (2008) Thompson C., 2008, ApJ, arXiv:0802.2571