11email: gabriele.anzolin@unipd.it 22institutetext: INAF - Osservatorio Astronomico di Capodimonte, salita Moiariello 16, I-80131 Napoli, Italy
22email: demartino@oacn.inaf.it 33institutetext: Service d’Astrophysique, DSM/DAPNIA/SAp CE Saclay, F-91191 Gif-sur-Yvette, France
33email: bonnetbidaud@cea.fr 44institutetext: Laboratoire Astroparticule et Cosmologie, Université Paris 7, 10 rue Alice Domon et Léonie Duquet, F-75005 Paris, France and LUTH, Observatoire de Paris, Section de Meudon, 5 place Jules Janssen, F-92195 Meudon, France
44email: martine.mouchet@obspm.fr 55institutetext: Department of Physics, University of Warwick, Coventry CV4 7AL, UK
55email: boris.gaensicke@warwick.ac.uk 66institutetext: Dipartimento di Fisica, Università degli Studi Roma Tre, via della Vasca Navale 84, I-00146 Roma, Italy
66email: matt@fis.uniroma3.it 77institutetext: CRESST and X-Ray Astrophysics Laboratory, NASA Goddard Space Flight Center, Greenbelt, MD 20771, USA and Department of Physics, University of Maryland, Baltimore County, 1000 Hilltop Circle, Baltimore, MD 21250, USA
77email: koji.mukai@nasa.gov
Two new Intermediate Polars with a soft X-ray component ††thanks: Based on observations obtained with XMM-Newton, an ESA science mission with instruments and contributions directly funded by ESA Member States and NASA, and with the Observatoire de Haute Provence (CNRS), France.
Abstract
Aims. We analyze the first X-ray observations with XMM-Newton of 1RXS J070407.9+262501 and 1RXS 180340.0+401214, in order to characterize their broad-band temporal and spectral properties, also in the UV/optical domain, and to confirm them as Intermediate Polars.
Methods. For both objects, we performed a timing analysis of the X-ray and UV/optical light curves to detect the white dwarf spin pulsations and study their energy dependence. For 1RXS 180340.0+401214 we also analyzed optical spectroscopic data to determine the orbital period. X-ray spectra were analyzed in the 0.2–10.0 keV range to characterize the emission properties of both sources.
Results. We find that the X-ray light curves of both systems are energy dependent and are dominated, below 3–5 keV, by strong pulsations at the white dwarf rotational periods (480 s for 1RXS J070407.9+262501 and 1520.5 s for 1RXS 180340.0+401214). In 1RXS 180340.0+401214 we also detect an X-ray beat variability at 1697 s which, together with our new optical spectroscopy, favours an orbital period of 4.4 hr that is longer than previously estimated. Both systems show complex spectra with a hard (up to 40 keV) optically thin and a soft (85–100 eV) optically thick components heavily absorbed by material partially covering the X-ray sources.
Conclusions. Our observations confirm the two systems as Intermediate Polars and also add them as new members of the growing group of ’soft’ systems which show the presence of a soft X-ray blackbody component. Differences in the temperatures of the blackbodies are qualitatively explained in terms of reprocessing over different sizes of the white dwarf spot. We suggest that systems showing cooler soft X-ray blackbody components also possess white dwarfs irradiated by cyclotron radiation.
Key Words.:
Stars: binaries: close - Stars: individual: 1RXS J070407.9+262501, 1RXS 180340.0+401214 - Stars: novae, cataclysmic variables - X-rays: stars - Accretion, accretion disks1 Introduction
Intermediate polars (IPs) are a subclass of magnetic cataclysmic variables (CVs) in which the rotational period of the white dwarf (WD) is not synchronized with the orbital period of the binary system (). The detection of a modulation at the WD spin period in the X-ray regime represents a signature of magnetic accretion. The material lost from the secondary star generally passes through a disc and is channelled onto the magnetic polar regions of the WD where a strong shock develops (Aizu 1973). Hard X-ray radiation is emitted by the hot post-shock gas that cools via thermal bremsstrahlung while it settles onto the WD surface. Because of the highly asynchronous WD rotation and of the lack of detectable polarized emission in the optical and near-IR in most systems, IPs were believed to possess weakly magnetized WDs (, Warner (1995)). A distinct soft () X-ray blackbody emission was discovered by the ROSAT satellite in a handful of IPs (Mason et al. 1992; Haberl et al. 1994; Haberl & Motch 1995; Burwitz et al. 1996), some of them also showing polarized optical radiation indicating field strengths up to 20–30 MG (e. g. Piirola et al. (1993, 2008)). This spectral component resembles that observed in the X-ray spectra of Polars, the other subclass of magnetic CVs, that instead possess synchronously rotating and strongly magnetized () WDs.
Our current understanding of the origin of soft X-ray emission and energy balance in Polars has greatly improved since the early model of Lamb & Masters (1979). It has become evident that the soft and hard X-ray emissions in at least these systems are largely decoupled (see Beuermann 1999, 2004), most of the soft X-rays arising from accretion of dense blobs (‘blobby accretion’) which penetrate deep in the WD atmosphere. Irradiation of the WD atmospheric polar regions by hard X-rays and cyclotron radiation emitted in a stand-off shock has been recently discussed by König et al. (2006), yelding to the conclusion that most of the reprocessed light appears in the far-UV rather than in the soft X-rays.
The similarity with the Polars raised the question on whether the ‘soft IPs’ are the ‘true’ progenitors of low-field Polars (see also Norton et al. (2004)). However, very recently a soft and rather absorbed X-ray emission is being found in a growing number of IPs (Haberl et al. 2002; de Martino et al. 2004, 2006a, 2006b, 2008; Evans & Hellier 2007; Staude et al. 2008). Whether all IPs possess such a component and whether it balances the primary emission from the post-shock flow is a new aspect that deserves investigation.
Furthermore, in recent years the number of candidate members of the IP group has grown quite rapidly (Woudt & Warner 2004; Gänsicke et al. 2005) almost doubling the number of previously known systems as well as enlarging the range of asynchronism. While this could suggest an evolution towards synchronism (Norton et al. 2004), the confirmation of new candidates is essential to understand the evolutionary link between IPs and Polars.
1RXS J070407.9+262501 (hereafter RXJ0704) was listed in the ROSAT All-Sky Survey Source Catalogue (RASS, Voges et al. (1999)) as a faint X-ray source, with a count rate of in the 0.1–2.4 keV PSPC range and ROSAT hardness ratios 111ROSAT hardness ratios 1 and 2 are defined as and , where is the raw count rate in the energy range expressed in keV (Motch et al. 1996). and that suggested the presence of a soft component in the X-ray spectrum. RXJ0704 was then identified as a CV by Gänsicke et al. (2005) and proposed to be an IP from the detection of optical photometric and spectroscopic periodicities at 480.71 s and , respectively. The short period variability was ascribed to the spin period of the WD, while the other was identified as the orbital period of the binary system. The optical light curve folded at the putative WD rotational period was double peaked, suggesting the presence of two equally contributing accreting poles. However, no other X-ray observation was performed on this source in order to study its X-ray properties and hence to confirm its membership in the IP class.
1RXS 180340.0+401214 (hereafter RXJ1803) was also discovered in the RASS as a faint (PSPC count rate ) source with a very soft X-ray spectrum ( and ). Later, it was also identified as an IP candidate by Gänsicke et al. (2005) from its optical photometric variability at a 1520.5 s period that was interpreted as the rotational period of the accreting WD. A spectroscopic period of 160.2 min was inferred from the analysis of radial velocity variations in the emission line wings and identified as the binary orbital period, thus placing this CV in the 2–3 hr period gap. The two periods would then indicate a system with a weak degree of asynchronism. Also for this source no further X-ray observations were available.
In this work we report XMM-Newton observations of RXJ0704 and RX1803 aiming at determining for the first time their X-ray variability as well as their X-ray broad-band spectral properties. For RXJ1803 we further complement the XMM-Newton data with optical spectroscopy acquired at the Observatoire de Haute Provence (OHP, France).
2 The observations and data reduction
| Object | Instrument | Date | UT (start) | Net exposure time (s) | Net count rate () |
| RXJ0704 | EPIC-pn | 2006-10-04 | 05:52 | 10194 | |
| EPIC-MOS | 05:22 | 12240 | |||
| RGS | 04:59 | 13908 | |||
| EPIC-pn | 2007-03-23 | 16:03 | 2900 | ||
| EPIC-MOS | 15:41 | 4450 | |||
| RGS | 15:40 | 4721 | |||
| OM-UVM2 | 15:49 | 1239 | |||
| 16:45 | 1239 | ||||
| 17:11 | 1240 | ||||
| 17:37 | 1241 | ||||
| 18:03 | 1241 | ||||
| RXJ1803 | EPIC-pn | 2007-08-31 | 02:18 | 18457 | |
| EPIC-MOS | 01:56 | 19356 | |||
| RGS | 01:56 | 18737 | |||
| OM-B | 02:05 | 1839 | |||
| 02:41 | 1840 | ||||
| 03:17 | 1842 | ||||
| 03:53 | 1841 | ||||
| 04:29 | 1839 | ||||
| OM-UVM2 | 05:05 | 1840 | |||
| 05:41 | 1840 | ||||
| 06:17 | 1839 | ||||
| 07:29 | 1839 |
2.1 The XMM-Newton observations of RXJ0704
RXJ0704 was observed with the XMM-Newton observatory (Jansen et al. 2001) on October 4, 2006 (OBSID: 0401650101) with the EPIC-pn (Strüder et al. 2001) and MOS (Turner et al. 2001) cameras operating in full frame mode with the medium filter for total exposure times of 10.2 ks and 12.2 ks, respectively. The RGS instruments (den Herder et al. 2001) were operated in spectroscopy mode for an exposure time of 13.9 ks. No useful data were collected with the OM (Mason et al. 2001). Due to a failure of the XMM-Newton mission operation centre system, the exposure was interrupted. RXJ0704 was then observed again on March 23, 2007 (OBSID: 0401650301) with the same instrument configurations. The OM was operated in fast imaging mode using the UVM2 filter that covers the ultraviolet spectral range 2000–2800 Å. The total exposures were 8.1 ks for EPIC-pn, 9.6 ks for the MOS, 9.9 ks for the RGS and 6.2 ks for the OM. A summary of the observations is reported in Table 1. All the raw data have been reprocessed using the standard pipeline process included in the SAS 7.0 package. EPIC light curves and spectra were extracted using a circular region of 30″centred on the source. The same aperture radius was used to extract background light curves and spectra on the same CCD chip of the target. To improve S/N, we selected up to double pixel events with zero quality flag for the EPIC-pn data, while for the EPIC-MOS cameras we increased the selection level up to quadruple pixel events.
The EPIC data of October 2006 were characterized by a very low and rather constant background level ( and for EPIC-pn and MOS respectively). In order to obtain sufficient S/N ratios and use statistics in the spectral analysis, the average EPIC spectra were rebinned to obtain 20 counts in each spectral bin. The photon redistribution matrix and the ancillary region file were created by using the SAS tasks rmfgen and arfgen. The RGS1 and RGS2 first order spectra are too faint to allow a reliable analysis and, therefore, are not presented in this work.
The March 2007 X-ray data were instead severely plagued by high background radiation for more than half of the duration of the observation. We then windowed the EPIC data to exclude those epochs of high () background count rate, leaving us with the initial 2.9 ks of useful data, thus losing of the whole observation. The extracted EPIC light curves and average spectra were obtained using the same procedure as described before. Also in this case the RGS data did not provide an useful spectrum. The OM-UVM2 background subtracted light curve binned in 20 s intervals was obtained with the task omfchain. The average count rate was , corresponding to an instrumental magnitude and to an average flux of in the 2000–2800 Å band. For a comparison, the continuum flux of the optical spectrum obtained by Gänsicke et al. (2005) is at 3800 Å.
2.2 The XMM-Newton observations of RXJ1803
RXJ1803 was observed on August 31, 2007 (OBSID:0501230101) with all EPIC cameras operated in full frame mode and with the thin filter. The total exposure times were 20.0 ks and 21.7 ks for the EPIC-pn and MOS cameras, respectively. Of the two RGS instruments, only RGS1 could acquire data for 21.9 ks, while RGS2 was blocked in a ‘set-up’ mode during the observation. The OM was operated in fast imaging mode using sequentially the UVM2 and B filters, the latter covering the spectral range 3900–4900 Å, for 9.2 ks each (see Table 1). The EPIC data were reprocessed and, then, filtered to avoid a flare event that occurred during the initial of the observation. Light curves and spectra were extracted using a radius of 30″centered on the source. We also applied similar pixel selection levels as done before for the EPIC-pn and MOS cameras and rebinned the spectra to obtain 25 counts per bin. Also for this source, the RGS1 first order spectrum was too faint to allow useful analysis. Due to a failure in the omfchain routine of SAS 7.0, OM data were reprocessed at the MSSL using new, yet unreleased, routines. Unfortunately, there was still a processing problem in one of the exposures with the UVM2 filter that cannot be solved. However, we obtained OM-B and OM-UVM2 background subtracted light curve binned in 10 s intervals. The average count rates were in the B band and in the UVM2 band. The corresponding instrumental magnitude were and , while the average fluxes were and , respectively.
Heliocentric corrections were applied to the EPIC and OM data of both sources.
2.3 OHP spectroscopy of RXJ1803
RXJ1803 was observed at the OHP during two nights on June 29 and July 1, 2006 for 4.3 hr and 4.22 hr, respectively. Long slit spectra were obtained with the Carelec spectrograph (Lemaitre et al. 1990) placed at the Cassegrain focus of the 193 cm telescope and using a CCD EEV ( pixels) detector with pixel size. A grating was used, with a slit width of 2″, leading to a wavelength coverage of 3600–7200 Å at a FWHM resolution of . All exposure times were set at 1520 s, corresponding to the known optical pulsation, to smear any effect from the spin variability. The observations were performed in nearly photometric conditions with seeing typically ranging from to 3″. We obtained 9 spectra of RXJ1803 each night. Standard reduction was performed with the ESO-MIDAS package, including cosmic rays removal, bias subtraction, flat-field correction and wavelength calibration. The wavelength calibration was checked on sky lines and all radial velocity measurements have been corrected from the small instrumental shifts measured on the O I 5577 Å line and from the Earth motion. Times have been converted in the heliocentric system. Flux calibration has been performed using the standard stars BD+28 4211 and BD +33 2642 .
3 Analysis and results
3.1 RXJ0704
We have analysed the X-ray and UV XMM-Newton data of RXJ0704 to search for variability at the optical period as well as to study its broad band spectral properties.


3.1.1 The X-ray variability
The light curves from all EPIC cameras were extracted in the range 0.2–15.0 keV with a 20 s time resolution. A clear signature of a periodicity on a time scale of a few dozen of minutes is detected in both the October 2006 and March 2007 EPIC-pn data. Since EPIC-MOS light curves are very similar to those obtained with the EPIC-pn camera in both epochs, though with lower statistics, we only show the EPIC-pn data analysis. Fourier analysis was restricted only to the October 2006 data (Fig. 1) because of the short duration of the March 2007 observations. We found significant peaks at and at , but the strongest peaks occur at and . There are also weak signals at and , indicating a very structured X-ray light curve. A fit was performed on the October 2006 EPIC-pn and MOS light curves by using a composite function with up to six sinusoids to account for all the detected harmonics. We let the fundamental frequency free to vary, while the other five frequencies were constrained to be integer multiple values of , i. e. , , , and . In this way, we found for EPIC-pn, for MOS1 and for MOS2. Because of the higher accuracy of the EPIC-pn data, we adopt . This value is consistent within with the optical photometric determination of Gänsicke et al. (2005) and hence can be safely ascribed to the WD rotational period.
Fig. 2 shows the full band EPIC-pn light curves of both epochs folded at the spin period. The light curves appear very complex and are dominated by two features: a dip, that we arbitrarily placed at phase zero, and a bump at phase . The dip represents a fiducial marker of the spin pulsation. We hence derive the following times of the dip: for October 2006 and for March 2007. The spin pulse is more structured in March 2007, especially in the phase range . The dip and bump appear to be less defined, while an additional peak can be recognized at . This latter could also be present in the October 2006 data, but with much lower amplitude.
The Fourier analysis was also performed on the October 2006 EPIC-pn light curves extracted with the same 20 s binning time in selected energy bands: 0.2–0.5 keV, 0.5–2.0 keV and 2.0–10.0 keV (see Fig. 1). While no sign of variability can be detected above 2.0 keV, significant peaks are evident in the soft band periodograms, where the spin frequency and its first three harmonics are clearly detected. The October 2006 folded light curves are shown in Fig. 3. The dip feature is clearly observed below 2 keV but the bump appears only below 0.5 keV. The March 2007 energy dependent light curves confirm the general behaviour observed in October 2006, with no sign of variability above 2 keV and a dip whose depth increases at lower energies. The fractional depth (relative to the average count rate level) of the dip is, within errors, slightly larger in October 2006 than in March 2007 ( and , respectively). Similarly the bump centered at phase has a fractional amplitude of in October 2006, while its amplitude is in March 2007. Both the dip and the bump are extremely localized in phase (), therefore the regions responsible for these features should have a very small extension.
In the lower panel of Fig. 3 we also plot the hardness ratio defined as the ratio between the 0.5–2.0 keV and 0.2–0.5 keV count rates (the hardness ratio obtained with the other energy bands does not provide useful information). The count rate ratio of the soft bands is double-humped showing a hardening during the dip as well as at that corresponds to the ‘flat’ part of the spin pulse. This clearly reflects the presence of the soft bump and the dip.

3.1.2 The UV light curve
The March 2007 OM-UVM2 light curve shows hints of a quasi-sinusoidal modulation on the order of few hours. However, this cannot be quantified because of the short duration of the observation. To better study the short term variability we removed the long term variations from the UV light curve using a third order polynomial and folded the residual at the X-ray spin period with the epoch of the dip found for March 2007. As shown in the lower panel of Fig. 2, the pulsation is quasi-sinusoidal. A sinusoidal fit gives the maximum at phase , hence partially overlapping the X-ray bump and the additional peak at observed at that epoch, and a modulation fraction of (defined as , where is the amplitude of the fitted sinusoid and is the average count rate). We also recall that the white light optical pulsation observed by Gänsicke et al. (2005) was instead found to be double-humped.
3.1.3 Spectral properties of RXJ0704
The October 2006 (Fig. 4) and March 2007 average EPIC-pn and combined MOS spectra were analyzed with the XSPEC 12 package in the range 0.3–10.0 keV. A simple model consisting of an absorbed optically thin plasma MEKAL with solar abundances does not adequately fit the spectra. For October 2006 data, a zero-width Gaussian centered at 6.4 keV is also required, although the fit is still poor (). Both October 2006 and March 2007 spectra show an excess of counts below 1 keV and the addition of a blackbody () drastically improves the fits ( and 0.70, respectively). For the October 2006 spectrum, the temperature of the optically thin plasma is unconstrained (), while for the March 2007 spectrum it is . However, a multi-temperature plasma, expected to be present in the post-shock region, does not improve the fit quality. If the abundance is left free to vary, it assumes an unrealistic value for the October 2006 data, while for the March 2007 spectrum we obtain , but still within errors compatible with solar abundances. We therefore fix to the solar value. The fits further improve by including an additional dense absorber covering the source by , as detailed in Table 2. The inclusion of a denser absorber is justified by a F-test at significance level of 99.9%. The low column density of the total absorber, when compared with the total galactic absorption in the direction of the source (, Dickey & Lockman (1990)), suggests a likely interstellar origin. On the other hand, the dense absorber should be confined within the binary system and likely due to pre-shock material as suggested by the energy dependence of the spin light curve. No major differences are found in the spectral parameters between the October 2006 and March 2007 data (see Table 2), except for the lack of detectable iron 6.4 keV line in the March 2007 low S/N spectrum and a significant change in the normalization of the blackbody component, which increases by a factor of two in March 2007. This change could explain the increase in the source flux observed between the two epochs ( and , respectively).
| Epoch | Total Absorber | Partial Absorber | Blackbody | MEKAL | Iron Line | ( / d.o.f.) | |||
| 222Column density of the total absorber. | 333Column density of the partial absorber. | Cov. Frac. 444Covering fraction of the partial absorber. | 555Normalization constant of the BBODY model. | 666Normalization constant of the MEKAL model. | EW 777Equivalent width of the 6.4 keV iron line. | ||||
| (eV) | (keV) | (eV) | |||||||
| Oct. 2006 | 0.87 (360/415) | ||||||||
| Mar. 2007 | 0.63 (121/193) | ||||||||

We also performed a phase-resolved analysis of the October 2006 EPIC-pn spectra (the inclusion of the MOS spectra does not greatly improve the statistics) extracted around the very localized dip () and bump (), as well as in the flat part (). Since the X-rays are essentially unpulsed above 2 keV, we used the best-fit model of October 2006 keeping fixed the MEKAL parameters to the values found for the average spectrum. We also fixed the column density of total absorber as this is not expected to vary along the spin cycle. The Gaussian component used to account for the iron line at 6.4 keV is not required to fit the spectra extracted arount the dip and the bump because of the poor S/N ratio. Unfortunately, with our data many spectral parameters are badly constrained, as shown in Table 3. Anyhow, we find a substantial change in the covering fraction of the partial absorber between the flat portion of the pulse and both the dip and the bump. The values of the normalization of the blackbody component found in the flat part and in the dip are consistent, within the errors, but there is an evident increase in the bump. Hence, it is conceivable that the spin pulse of RXJ0704 is due to an increase in the local absorption (dip feature) and to an increase in the projected area of the blackbody component (bump).
| Parameters | Dip | Bump | Flat |
|---|---|---|---|
| 2.71 | 5.15 | 4.13 | |
| () | |||
| () | |||
| Cov. Frac. | |||
| (eV) | |||
| () | |||
| ( / d.o.f.) | 1.15 (26/23) | 1.03 (63/61) | 1.00 (297/298) |
3.2 RXJ1803
Similarly to RXJ0704, the XMM-Newton data were also analyzed to search for periodicities in the X-ray, UV and optical ranges. The spectroscopy acquired at OHP was analyzed to search for variability in the radial velocities of Balmer lines.

3.2.1 The X-ray periodicities in RXJ1803
The EPIC-pn light curve (EPIC-MOS light curves were too noisy to provide useful information) was extracted in the full energy range of the camera with a resolution of 20 s and Fourier analyzed. The power spectra in the 0.2–15.0 keV range, reported in Fig. 5, show the presence of a strong peak at and an additional weaker peak at . A sinusoidal fit composed with one single frequency gives then a period of . This is fairly consistent with the highly accurate optical period of determined by Gänsicke et al. (2005), allowing us to confirm it as the true spin period of the WD. The residual light curve when fitted with a second sinusoid gives a period of . If this frequency represents the sideband (commonly named as the beat), using either the X-ray period or the optical period we derive an orbital frequency of or , respectively. This gives an orbital period of or which does not match either the orbital period of 2.67 hr determined by Gänsicke et al. (2005), or . As it will be shown below, the orbital period is likely 4.4 hr, hence longer than previously determined. The detection of X-ray variability at the spin and beat frequencies (with different amplitudes) is also observed in other IPs (see Norton et al. 1992a, b, 1997). In RXJ1803, the ratio of power between spin and beat frequencies is , implying that the beat modulation has an amplitude about twice lower than that of the spin.


Light curves of the EPIC-pn were also extracted in different energy ranges with a binning time of 20 s and Fourier analyzed, as also shown in Fig. 5. The spin variability is clearly detected below 3 keV, as well as the beat frequency. The ratio of power between spin and beat peaks is in the 0.2–0.5 keV, in the 0.5–1.0 keV and in the 1.0–3.0 keV, suggesting that the variabilities at the two frequencies do not have the same energy dependence. Because of the higher accuracy of the optical period determination, we folded the spin light curves at the 1520.5 s period (Fig. 6) using the time of maximum obtained from a sinusoidal fit with fixed frequency: . The folded light curves are quasi-sinusoidal with a dip at which is more evident in the softest 0.2–0.5 keV band. The pulse amplitude (see Sect. 3.1.2) is in the 0.2–0.5 keV range, in the 0.5–1.0 keV and in the 1.0-3.0 keV band, indicating a strong energy dependence especially below 1 keV. The hardness ratios in the three bands however do not substantially vary along the spin cycle, indicating that the spin pulse is dominated by aspect angle variations.
The beat variability suggests that the shape of the spin pulsation is variable along the binary period. The XMM-Newton observation spans about 5.6 hr, likely covering more than one orbital period. We then extracted the spin light curve in six intervals each sampling (i. e. about two spin cycles). While amplitudes are rather constant within errors, the spin pulse changes phase with time (see Fig. 7). Altough we cannot establish whether this variability is periodic, the presence of the beat variability suggests it might be the case.
3.2.2 The UV and optical light of RXJ1803
The OM-UVM2 light curve does not reveal any clear trend, while that in the B filter shows both a long term and short term variability. Count rates steadily increase by a factor of during the 2.6 hr of observation with the B filter. This could reflect an orbital dependence, suggesting, as found in the X-ray data, that the orbital period is longer than previously estimated (Gänsicke et al. 2005). We then removed the long term trend in the B-band light curve using a third order polynomial. The folded spin light curves in the two bands are shown in Fig. 6. Although very noisy, they appear to be different: in the UV no modulation is apparent within errors, while the B band light curve is quasi-sinusoidal, with an amplitude of . The B band pulse is single peaked, as also detected by Gänsicke et al. (2005), and is broadly consistent in phase with the X-ray pulse.
3.2.3 The X-ray spectrum of RXJ1803
| Partial Absorber | Blackbody | Optically thin plasma 888The optically thin plasma is represented by a CEMEKL (Models A and B) with fixed slope or by two MEKALs (Model C). | ( / d.o.f.) | |||||||
| 999Column density of the partial absorber. | Cov. Frac. 101010Covering fraction of the partial absorber. | 111111Normalization constant of the BBODY model. | 121212Metal abundance. | 131313Normalization constant of the first MEKAL model (only for Model C). | 141414In Models A and B this is the maximum temperature of CEMEKL model. | 151515Normalization constant of the CEMEKL (Models A and B) or the second MEKAL model (Model C). | ||||
| (eV) | (keV) | (keV) | ||||||||
| A | 40 | 0.91 (448/495) | ||||||||
| B | 0.89 (437/493) | |||||||||
| C | 0.89 (436/491) | |||||||||
The EPIC-pn (Fig. 8) and combined MOS spectra averaged over the whole observation were fitted using a model constituted by an absorbed MEKAL with solar abundances. This simple model does not satisfactorily fit the spectrum (). A slight improvement is achieved by using a multi-temperature plasma CEMEKL () with and power-law slope fixed at unity. In both cases, there is an excess of counts below 0.5 keV and above 5 keV, but the hydrogen column density of the total absorber drops to zero, thus indicating that this component is not required. As a comparison, the total galactic absorption in the direction of RXJ1803 is (Dickey & Lockman 1990). Leaving metal abundance free, the fit still remains unsatisfactorily high () giving sub-solar abundances . A great improvement () of the fit is found with a composite model (Model A in Table 4) consisting of a blackbody and the multi-temperature plasma, which decreases the excess of counts at low energies. The blackbody temperature is found at . A further improvement is found by adding a partial covering (40%) dense () absorber (Model B in Table 4). The presence of this component is significant at the 98.6% level with the F-test. Here we note that the metal abundance of the optically thin plasma is still sub-solar () and that the slope of the power-law emissivity function was fixed to unity, because when left free it assumed the value but consistent with unity within errors. A similar quality fit (, Model C) is obtained by using two MEKAL components instead of the CEMEKL, supporting the idea that the optically thin plasma is not isothermal. The parameters of the partial absorber and the blackbody are consistent with that of Model B, but badly constrained. The temperatures of the two MEKAL components are 1 keV and 12 keV, the latter being consistent within errors with the maximum temperature of the multi-temperature plasma found in Model B. The low temperature plasma is instead required to fit a shallow bump located aroud 1 keV and ascribed to a complex of spectral lines likely dominated by a strong O VIII line at 19 Å. Unfortunately, we cannot inspect the RGS because of the lack of data from RGS2. The observed X-ray flux in the 0.2–10.0 keV range is . A comparison with the observation carried out during RASS shows that RXJ1803 was about 1.5 times brighter in the soft ROSAT band during the XMM-Newton observation. In 2007 the source is also less soft than when detected during RASS, since the ROSAT hardness ratios would have been and , suggesting that the soft X-ray component was less prominent in the XMM-Newton observation than during RASS.

We also performed a phase-resolved analysis of the EPIC-pn spectrum extracted around the pulse maximum () and minimum (), in order to investigate the mechanism responsible for the pulsation. Model B shown in Table 4 was used, keeping the metal abundance fixed to the value obtained for the average spectrum and fixing the power-law index . The parameters of the CEMEKL component are very similar in both fits and are completely consistent with the value found in the average spectrum. This was expected since we do not observe any variabilty above 3 keV. Given quoted errors, the main variations arise in the normalization of the blackbody component, which increases at the spin maximum by a factor of 2.7 with only a weak evidence that this occurs in the partial absorber column density. The lack of a significant variability in the hardness ratios suggests that the X-ray spin pulse in RXJ1803 is likely dominated by changes in the projected area of the blackbody component. It is interesting to note that the ratio between the spin and the beat amplitudes is larger at lower energies, which could suggest a much lower contribution of the reprocessed soft X-ray component to the beat variability.
| Parameters | Maximum | Minimum |
|---|---|---|
| 1.94 | 1.55 | |
| () | ||
| () | ||
| Cov. Frac. | ||
| (eV) | ||
| () | ||
| () | ||
| ( / d.o.f.) | 1.27 (131/110) | 0.80 (50/62) |
3.2.4 The spectroscopic period of RXJ1803
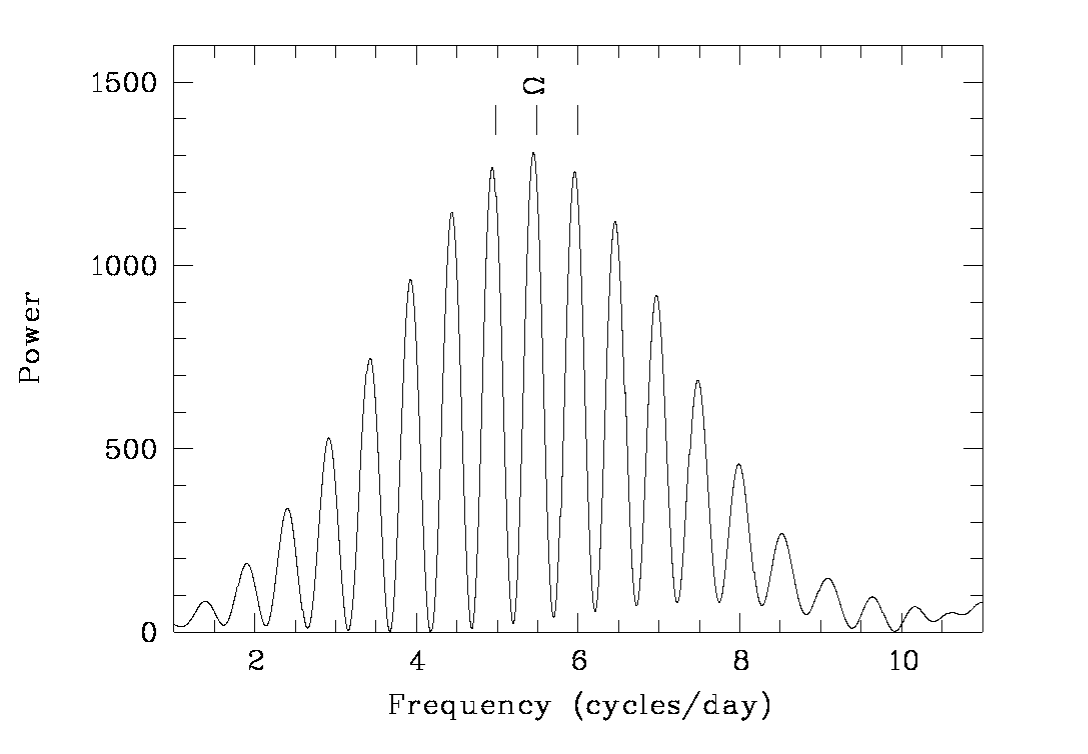
The mean optical spectrum of RXJ1803 was found similar to that already reported by Gänsicke et al. (2005) and is typical of magnetic CVs with strong emission lines of the Balmer series, He II (4686 Å) and He I (4471, 5875, 6678 and 7065 Å), superimposed on a relatively blue continuum. The radial velocities for the main lines were measured using a single Gaussian least square fit procedure and periodicities were searched using a Fourier analysis. The power spectrum for the strongest line gives the most accurate period determination (see Fig. 9). The maximum power is seen at with secondary peaks which are 1 and 2 days aliases, corresponding to the night separations. The characteristics of the radial velocity line modulation were further determined from a sine fit. The minimum corresponds to a period of , where the error bar is at a level, computed for two independent parameters. The orbital ephemeris for RXJ1803 is determined as , where is the predicted heliocentric time of the blue-to-red radial velocity transition.
| Lines | () | K () | Phase 161616Phase of the blue-to-red zero crossing |
|---|---|---|---|
| 0.0 (fixed) | |||

The radial velocities of the line, folded at the above best orbital ephemeris, are shown in Fig. 10 and the parameters of the corresponding best sine fits for the strongest emission lines are given in Table 6. Though the 4.40 hr period is the most significant, we cannot exclude the 2 day aliases at and . These observations therefore do not confirm the period gap value previously reported by Gänsicke et al. (2005). We note however that a large scatter is visible in their Fig. 22 showing the radial velocities of wings folded at the 2.67 hr period and that these are only marginally represented by a sinusoidal fit at their period. A significant distortion of the line profiles may have been introduced by the 600 s and 1800 s exposures used, not commensurate with the spin value. Using the 4.40 hr value for the orbital period and the optical spin value (1520.51 s), the and beat periods are predicted at and , respectively. The XMM beat value of is therefore consistent with the above orbital period.
4 Discussion
The X-ray analyses of RXJ0704 and RXJ1803 reveal strong pulses at the optical periods previously identified by Gänsicke et al. (2005) that now can be interpreted as the true rotational periods of the accreting WDs and hence confirming these 2 CVs as IPs. This increases the current roster of confirmed IPs to 31 systems 171717For a comprehensive list of IPs see also http://asd.gsfc.nasa.gov/Koji.Mukai/iphome/iphome.html. Both sources show pulsations that are strongly energy dependent in the soft X-ray portion of the spectrum. RXJ0704 and RXJ1803 also show common spectral properties characterized by a hard and a soft emission component. The latter property adds these two systems to the small but growing group of ‘soft IPs’. Now we discuss their pulse properties and spectral characteristics highlighting their common aspects.
4.1 RXJ0704
The 480 s spin pulsation observed below 2 keV is highly structured with a strong dip feature and a bump, while no modulation is detectable at higher energies. The spin pulse is very similar to that observed in PQ Gem (de Martino et al. 2004; Evans et al. 2006), which also shows a marked dip that preceeds the spin maximum. The dip in both sources is due to an increase of absorption from an intervening column along the line of sight. While for PQ Gem the geometry of the system and its accretion flow is rather well determined (Potter et al. 1997), that in RXJ0704 has still to be established. Notwithstanding this, the strong similarity of the pulse may suggest that also in RXJ0704 the dip could result from the obscuration of the magnetic pole produced by the accretion flow along field lines (curtain, Rosen et al. (1988)) which preceeds the pole itself. In this configuration, the material couples at large distances and travels out of the orbital plane producing large absorption effects. At later phases, when the curtain moves away from the line of sight, the X-rays are less absorbed and the WD area of the accreting pole is still at its maximum visibility. This is also corroborated by the variability seen at UV wavelengths, where the maximum is observed in correspondence with the X-ray maximum. RXJ0704 has been observed in a previous epoch to show a double-sine optical modulation (Gänsicke et al. 2005), thus indicating that both poles are active at some epochs. To have both of them come into view the magnetic dipole should be relatively inclined (, where is the magnetic colatitude and is the binary inclination). Eclipses are not observed in RXJ0704, implying . Furthermore, the lack of modulation in the hard X-rays suggests that either the accretion shock does not pass behind the limb of the WD or there are two poles equally contributing to the hard X-rays. This last is favoured in the framework of two visible poles. Wether material couples at large radii, producing very localized absorbing structures, need to be explored with further observations such as phase resolved spectroscopy and multi-band photometry.
The spectral analysis confirms the presence of a blackbody-like soft X-ray component which strongly dominates the pulse below 0.5 keV. This component is relatively hot and should originate in a relatively small area of the WD polar cap. In fact, the normalization constants of the blackbody in both the epochs of observation imply an emission area that is in the range 181818For RXJ0704 and RXJ1803 we adopt lower limits to their distances of 800 pc and 500 pc, respectively. These are obtained using the 2MASS K-band magnitudes, adopting for the secondaries a spectral type for RXJ0704 and for RXJ1803, that are predicted for their orbital periods of 4.17 hr and of 4.4 hr (Knigge 2006), and assuming that these donors totally contribute to the K-band flux.. The bolometric flux of the blackbody is . On the other hand, the optically thin emission has a bolometric flux 4.6 - 1.4 times larger than that of the soft component in the two observations. Therefore, to obtain an estimate of the mass accretion rate, we need to include both components. Here we note that the UV flux is modulated at the spin period by 12% and, when dereddened by (as derived from the hydrogen column density of the total absorber, Ryter et al. (1975)), is about three orders of magnitude higher than the extrapolated blackbody flux in that range. Hence, the accretion luminosity is estimated as . The upper temperature value of the optically thin component of 24 keV provides a lower limit to the shock temperature, which in turn would give a WD mass of . We then assume a canonical WD mass value of WD and derive an accretion rate of . At a distance of 800 pc it is lower by one order of magnitude than the expected for its orbital period (Warner 1995).
Norton et al. (1999) proposed that fast rotators like V709 Cas (), YY Dra () and V405 Aur () possess weakly magnetized WDs. RXJ0704, with its short 480 s spin period, joins these fast rotators. Its magnetic moment could be estimated assuming that the WD is accreting from a disc. The strong spin variability indicates that accretion is disc-fed (Norton 1993). Hence, the condition for disc formation and truncation at the magnetospheric radius implies that , where the corotation radius is the radius at which the magnetic field rotates with the same Keplerian frequency of the inner edge ot the accretion disc. These are defined as and , where is the WD radius in units of , is the luminosity in units of , and is the WD magnetic moment in units of . For a WD, we find . The spin-to-orbit period ratio of RXJ0704 is , thus it is a relatively highly asynchronous system which poses the question of whether this system is spinning at equilibrium. Spin equilibria have been computed by Norton et al. (2004) for systems with a fixed mass ratio and accreting at the secular value for their orbital periods. For and an orbital period of 4.2 hr, it is predicted that equilibrium is reached for a magnetic moment of . While this could suggest that RXJ0704 is not spinning at equilibrium, this issue remains open until the distance and the mass ratio remain undetermined.
4.2 RXJ1803
The X-ray timing analysis of RXJ1803 has revealed the presence of a strong pulsation, with an amplitude of 54%, at the previously identified optical period, which confirms this system as an IP. We also detect a weaker modulation (by a factor of ) at a period of that we interpret as the beat period. This is consistent with the value obtained using the optical photometric spin period and our new spectroscopic orbital period, i. e. . Hence, both our new spectroscopy and X-ray data show that the binary period is much larger than previously determined (Gänsicke et al. 2005). With the new 4.4 hr orbital period, RXJ1803 is outside the orbital period gap and its spin-to-orbit period ratio lowers to , which is well within the range found for most systems (see Norton et al. 2004).
X-ray pulsations at the beat frequency occur when the accretion stream is directly channelled to the magnetic poles of the WD, without passing through the disc (Wynn & King 1992). However, the detection of both spin and beat periodicites suggests an hybrid accretion mode, i. e. occurring simultaneously via a disc and disc-overflow (Hellier 1995). The proportion between the two accretion mechanisms can be inferred from the relative amplitudes of the corresponding X-ray variabilities. Disc-overflow was also theoretically predicted by Armitage & Livio (1998). To date, only the IP V2400 Oph is known to be a pure stream-fed accretor. A few other systems (such as FO Aqr, AO Psc, TX Col) have shown both spin and beat variabilities, with different amplitudes. RXJ1803 thus joins these few systems with disc accretion representing of the total flow.
The X-ray spin pulse below 3 keV is single peaked and energy dependent, while no detectable modulation is found at higher energies. Both hardness ratios in the soft bands and spectral analysis show that the spin pulse is likely dominated by aspect variations rather than photo-electric absorption. We also find changes of the phase of pulse maximum on a timescale of hours, commensurable with the orbital period. The X-ray beat variability does not appear to possess the same spectral dependence of the spin, although it is also observed below 3 keV. The spectrum of RXJ1803 is well described by an optically thin multi-temperature plasma with maximum temperature which can be regarded as the shock temperature. A blackbody component at 95 eV also contributes to the soft portion of the spectrum by of the total observed flux below 1 keV. Both components are absorbed by a dense () local material covering of the X-ray emitting region. If the latter is mostly related to the overflowing material, this could explain the different energy dependence of the beat and spin variabilities. The blackbody emission is also relatively hot, with a very small area on the WD pole (). Its bolometric flux is which results to be 14 times smaller than that of the optically thin component. To evaluate the accretion luminosity we include both hard and soft X-ray components, as well as the modulated flux in the UV/optical bands. However, the UV range does not show a modulation. We therefore include only the B band modulated flux of , corresponding to a luminosity . The accretion luminosity is then . To estimate the mass accretion rate we use a WD mass inferred from the shock temperature of 30–40 keV: . This gives an accretion rate . If the source is indeed at 500 pc, this value is low and much smaller than the secular value predicted for its 4.4 hr orbital period, i. e. (Warner 1995). Although this is a lower limit to the accretion rate and unless most of the accretion luminosity is not emitted at high energies, RXJ1803 seems to be a soft IP with a low accretion rate.
The ratio between the spin and orbital period is 0.096, which is very close to the typical value of 0.1 for IPs and suggests that RXJ1803 is spinning close to equilibrium. The dominance of the spin pulsation also indicates that RXJ1803 accretes predominantly via a disc. As done in Sect. 4.1, the condition for disc truncation at gives a lower limit for the magnetic moment using the and the WD mass derived for this object. Following Norton et al. (2004), the magnetic moment predicted for a system in spin equilibrium with and is . Further observations to constrain the multicolour variability as well as the distance of this system are needed to draw firm conclusions on the mass accretion rate and the magnetic moment of this system.
4.3 Soft X-ray IPs: an emerging new class?
Our XMM-Newton observations of two new IPs allowed us to detect a soft X-ray blackbody component in these systems. The ROSAT satellite was the first to discover three IPs with a significant soft X-ray component, namely PQ Gem, V405 Aur and UU Col (Mason et al. 1992; Haberl et al. 1994; Motch et al. 1996; Burwitz et al. 1996). Such a component was also recognized in a few other systems observed with BeppoSAX (V2400 Oph, de Martino et al. (2004)) and with the high sensitive XMM-Newton data (NY Lup, Haberl et al. (2002); 1RXS J2133.7+5107, de Martino et al. (2006b); 1RXS J173021.5-055933, de Martino et al. (2008); 1RXS J062518.2+733433, Staude et al. (2008)). A systematic search for this component in the XMM-Newton archival data has further added three systems EX Hya, GK Per and WX Pyx (Evans & Hellier 2007). The current roster of soft X-ray IPs amounts to thirteen systems, which is now a statistically significative sample, comprising 42% of all the confirmed IPs. Therefore, ‘soft IPs’ seem to represent a well defined class among IPs. This makes the soft X-ray emission not a sole characteristics of Polar systems which deserves an explanation. Moreover, the properties of the soft X-ray component in IPs still have to be defined. With thirteen systems, this is now possible. We compiled Table 7, a listing of the blackbody temperatures and softness ratios (defined as the bolometric flux ratio , see Ramsay & Cropper (2004)) as derived from spectral analyses available in literature. Despite the great spread due to different models applied and/or different spectral data, there is clear evidence that the soft X-ray blackbody in IPs covers a wide range of temperatures (30–100 eV), that is much wider than in the Polar systems (see also Fig. 11). In most cases the temperatures are high and larger than those found in the Polars with only a few systems falling in the same range. These hot blackbodies could arise from small cores of the accretion spots onto the WD poles. As already noted in de Martino et al. (2008), although the emitting areas are subject of great uncertainties, mostly due to the distance, systems showing hot blackbodies like NY Lup, 1RXS J173021.5-055933, RXJ0704 and RXJ1803 have fractional areas which are two-three orders of magnitude lower than those found in IPs with cooler blackbodies such as PQ Gem (James et al. 2002). Since the inferred blackbody temperature is an average value over the heated spot, the wide range of temperatures might reflect accretion spots of different sizes.
Strong evidence is found in most Polars that the soft X-ray component arises in the WD photosphere primarly due to the heating by accretion of dense blobs (Kuijpers & Pringle 1982; Woelk & Beuermann 1996; Beuermann 1999, 2004), with most of the reprocessed primary (hard X-rays and cyclotron) radiations mainly emitted in the far-UV (König et al. 2006). As seen in Fig. 11, the softness ratio of IPs is generally smaller than that observed in the Polars and, as already noted by Evans & Hellier (2007), this indicates that blobby accretion does not occur in IPs. We further stress that the presence of a disc in these systems indeed makes this accretion mode very unlikely. Most IPs also have softness ratios below 0.25, lower than that predicted by the standard model (Lamb & Masters 1979), suggesting that the soft X-ray emission does not fully account for the whole reprocessing.
Evans & Hellier (2007) propose that the appearance of this component is primarly due to geometric factors because the cool material in the accretion curtains heavily absorbes the soft X-rays when viewing along the curtain. They note that those IPs with light curves dominated by absorption dips tend not to show a blackbody component. While the high density local absorbing material certainly adds further complications in IPs this might not be the whole story. Our finding of a wide range of temperatures, and the likely different sizes of the heated spots, could be explained if bremsstrahlung and cyclotron radiation both play a role in irradiating the WD surface. The fact that some of the ‘soft IPs’ like PQ Gem (Mason 1997), V405 Aur (Shakhovskoj & Kolesnikov 1997), V2400 Oph (Buckley et al. 1995) and 1RXS J2133.7+5107 (Katajainen et al. 2007), were found to show optical/near-IR circular polarization, suggests that cyclotron radiation cannot be neglected. Here we note that it cannot be excluded that other ‘soft IPs’ are also circularly polarized but have not been searched in polarized light yet.
Beamed cyclotron radiation originates in the higher parts of the post-shock region and, thus, can heat large spots. Bremsstrahlung is instead irradiated isotropically from the dense post-shock regions closer to the WD surface and hence irradiates smaller areas. Therefore we might expect that for higher magnetic field IPs, cyclotron cooling is not totally negligible and therefore these systems would have larger accretion spots with respect to other IPs with lower magnetic fields. This in turn would imply that higher field IPs are expected to show on average lower blackbody temperatures than the low field IPs. A test to this hypothesis would then require a systematic search for polarized radiation in the soft IPs and, in particular, over a wide range of wavelengths from visual to IR.
The detailed and recent study on reprocessed radiation in Polars by König et al. (2006) relies on the clear evidence of a large irradiated spot on the WD surface in AM Her that mainly emits in the far-UV, implying that most of the soft X-rays do not enter in the energy balance. For IPs, there is still a great uncertainty in whether the UV modulated flux comes from the irradiated WD pole or from the inner regions of the curtain or both (e. g. de Martino et al. (1999, 2006a, 2008); Eisenbart et al. (2002); Evans et al. (2006)). Detailed far-UV/UV coverage to identify the heated WD surface in IPs would be highly desirable to assess the energy balance in these systems.
| Object | Softness Ratio | Reference | |
|---|---|---|---|
| (eV) | |||
| UU Col | 50 | 0.043 | 1 |
| 73 | 0.011 | 2 | |
| PQ Gem | 56 | 0.1 | 3 |
| 48 | 0.031 | 2 | |
| NY Lup | 86 | 0.114 | 4 |
| 104 | 0.026 | 2 | |
| 1RXS J2133+5107 | 96 | 0.208 | 5 |
| 1RXS J1730-0559 | 91 | 0.218 | 6 |
| V2400 Oph | 103 | 0.181 | 3 |
| 117 | 0.009 | 2 | |
| V405 Aur | 73 | 0.2 | 3 |
| 65 | 0.211 | 2 | |
| GK Per | 62 | 0.048 | 2 |
| EX Hya | 31 | 0.101 | 2 |
| WX Pyx | 82 | 0.02 | 2 |
| MU Cam (2005) | 59 | 0.125 | 7 |
| MU Cam (2006) | 54 | 0.166 | 7 |
| RXJ0704 (Oct. 2006) | 84 | 0.053 | This work |
| RXJ0704 (Mar. 2007) | 88 | 0.172 | This work |
| RXJ1803 | 95 | 0.019 | This work |

5 Conclusions
XMM-Newton observation of RXJ0704 and RXJ1803 confirm these CVs as true members of the IP class. Both systems are dominated by strong pulsations at the WD rotational periods which dominate the soft portion of their spectrum, i. e. below 3-5 keV. With , RXJ0704 joins the group of fast rotators and possess a relatively high degree of asynchronism (). RXJ1803 is, instead, a slow rotator . From our new optical spectroscopy and the X-ray data of this system we infer an orbital period of 4.4 hr, that is longer than previously determined. This gives a spin-to-orbit period ratio of , typical for IPs.
The detection of strong spin pulses indicate that accretion occurs preferentially via a disc in both systems. However, while RXJ0704 only shows X-ray variability at the spin period, RXJ1803 also displays a weak variability at the orbital sideband (), implying that accretion also occurs via disc-overflow.
Their X-ray spectra are compatible with composite emission consisting of an optically thin component (), which in RXJ1803 is better described by a multi-temperature plasma, reaching values up to 30–40 keV, as well as by blackbody emission with a relatively high temperature (85–100 eV) heavily absorbed by dense material partially covering the X-ray source. This adds these two systems to the growing group of ‘soft IPs’, which indicates that the presence of a soft blackbody component is not solely a characteristic of the Polars. However, a major difference is in the temperatures of the blackbodies in the IPs which cover a wider range than that observed in the Polar systems. We qualitatively try to explain the differences in terms of reprocessing over different sizes of the WD spot. We suggest that IPs showing cooler soft X-ray blackbody components also possess WDs irradiated by cyclotron radiation. A further systematic observational approach addressing the detection of polarized optical/IR emission in IPs is highly desiderable.
Acknowledgements.
We acknowledge the XMM-Newton SOC and MSSL staff for help in the reprocessing of the OM data. Prof. A. Bianchini is gratefully acknowledged for useful discussion. DdM and GA acknowledge financial support from ASI under contract ASI/INAF I/023/05/06 and from INAF under contract PRIN-INAF 2007 N.17.References
- Aizu (1973) Aizu, K. 1973, Prog. Theor. Phys., 49, 1184
- Armitage & Livio (1998) Armitage, P. J. & Livio, M. 1998, ApJ, 493, 898
- Beuermann (1999) Beuermann, K. 1999, in Highlights in X-ray Astronomy, ed. B. Aschenbach & M. J. Freyberg, 410
- Beuermann (2004) Beuermann, K. 2004, in ASP Conf. Ser., Vol. 315, IAU Colloq. 190: Magnetic Cataclysmic Variables, ed. S. Vrielmann & M. Cropper, 187
- Buckley et al. (1995) Buckley, D. A. H., Sekiguchi, K., Motch, C., et al. 1995, MNRAS, 275, 1028
- Burwitz et al. (1996) Burwitz, V., Reinsch, K., Beuermann, K., & Thomas, H.-C. 1996, A&A, 310, L25
- de Martino et al. (2004) de Martino, D., Matt, G., Belloni, T., Haberl, F., & Mukai, K. 2004, A&A, 415, 1009
- de Martino et al. (2006a) de Martino, D., Matt, G., Mukai, K., et al. 2006a, A&A, 454, 287
- de Martino et al. (2006b) de Martino, D., Matt, G., Mukai, K., et al. 2006b, in ESA Spec. Pub., Vol. 604, The X-ray Universe 2005, ed. A. Wilson, 261–262
- de Martino et al. (2008) de Martino, D., Matt, G., Mukai, K., et al. 2008, A&A, 481, 149
- de Martino et al. (1999) de Martino, D., Silvotti, R., Buckley, D. A. H., et al. 1999, A&A, 350, 517
- den Herder et al. (2001) den Herder, J. W., Brinkman, A. C., Kahn, S. M., et al. 2001, A&A, 365, L7
- Dickey & Lockman (1990) Dickey, J. M. & Lockman, F. J. 1990, ARA&A, 28, 215
- Eisenbart et al. (2002) Eisenbart, S., Beuermann, K., Reisch, K., & Gänsicke, B. T. 2002, A&A, 382, 984
- Evans & Hellier (2007) Evans, P. A. & Hellier, C. 2007, ApJ, 663, 1277
- Evans et al. (2006) Evans, P. A., Hellier, C., & Ramsay, G. 2006, MNRAS, 369, 1229
- Gänsicke et al. (2005) Gänsicke, B. T., Marsh, T. R., Edge, A., et al. 2005, MNRAS, 361, 141
- Haberl & Motch (1995) Haberl, F. & Motch, C. 1995, A&A, 297, L37
- Haberl et al. (2002) Haberl, F., Motch, C., & Zickgraf, F.-J. 2002, A&A, 387, 201
- Haberl et al. (1994) Haberl, F., Throstensen, J. R., Motch, C., et al. 1994, A&A, 291, 171
- Hellier (1995) Hellier, C. 1995, in ASP Conf. Ser., Vol. 85, Magnetic Cataclysmic Variables, ed. D. A. H. Buckley & B. Warner, 185
- James et al. (2002) James, C. H., Ramsay, G., Cropper, M. C., & Branduardi-Raymont, G. 2002, MNRAS, 336, 550
- Jansen et al. (2001) Jansen, F., Lumb, D., Altieri, B., et al. 2001, A&A, 365, L1
- Katajainen et al. (2007) Katajainen, S., Butters, O. W., Norton, A. J., Lehto, H. J., & Piirola, V. 2007, A&A, 475, 1011
- Knigge (2006) Knigge, C. 2006, MNRAS, 373, 484
- König et al. (2006) König, M., Beuermann, K., & Gänsicke, B. T. 2006, A&A, 449, 1129
- Kuijpers & Pringle (1982) Kuijpers, J. & Pringle, J. E. 1982, A&A, 114, L4
- Lamb & Masters (1979) Lamb, D. Q. & Masters, A. R. 1979, ApJ, 234, L117
- Lemaitre et al. (1990) Lemaitre, G., Kohler, D., Lacroix, D., Meunier, J. P., & Vin, A. 1990, A&A, 228, 546
- Mason (1997) Mason, K. O. 1997, MNRAS, 285, 493
- Mason et al. (2001) Mason, K. O., Breeveld, A., Much, R., et al. 2001, A&A, 365, L36
- Mason et al. (1992) Mason, K. O., Watson, M. G., Ponman, T. J., et al. 1992, MNRAS, 258, 749
- Motch et al. (1996) Motch, C., Haberl, F., Guillout, P., et al. 1996, A&A, 307, 459
- Norton (1993) Norton, A. J. 1993, MNRAS, 265, 316
- Norton et al. (1999) Norton, A. J., Beardmore, A. P., Allan, A., & Hellier, C. 1999, A&A, 347, 203
- Norton et al. (1997) Norton, A. J., Hellier, C., Beardmore, A. P., et al. 1997, MNRAS, 289, 362
- Norton et al. (1992a) Norton, A. J., McHardy, I. M., Lehto, H. J., & Watson, M. G. 1992a, MNRAS, 258, 697
- Norton et al. (1992b) Norton, A. J., Watson, M. G., King, A. R., Lehto, H. J., & McHardy, I. M. 1992b, MNRAS, 254, 705
- Norton et al. (2004) Norton, A. J., Wynn, G. A., & Somerscales, R. V. 2004, ApJ, 614, 349
- Piirola et al. (1993) Piirola, V., Hakala, P., & Coyne, G. V. 1993, ApJ, 410, L107
- Piirola et al. (2008) Piirola, V., Vornanen, T., Berdyugin, A., & Coyne, G. V. 2008, arXiv:0805.4289
- Potter et al. (1997) Potter, S. B., Cropper, M., Mason, K. O., Hough, J. H., & Bailey, J. A. 1997, MNRAS, 285, 82
- Ramsay & Cropper (2004) Ramsay, G. & Cropper, M. 2004, MNRAS, 347, 497
- Rosen et al. (1988) Rosen, S. R., Mason, K. O., & Cordova, F. A. 1988, MNRAS, 231, 549
- Ryter et al. (1975) Ryter, C., Cesarsky, C. J., & Audouze, J. 1975, ApJ, 198, 103
- Shakhovskoj & Kolesnikov (1997) Shakhovskoj, N. M. & Kolesnikov, S. V. 1997, IAU Circ., 6760, 2
- Staude et al. (2008) Staude, A., Schwope, A. D., Schwarz, R., et al. 2008, arXiv:0806.0793
- Strüder et al. (2001) Strüder, L., Briel, U., Dennerl, K., et al. 2001, A&A, 365, L18
- Turner et al. (2001) Turner, M. J. L., Abbey, A., Arnaud, M., et al. 2001, A&A, 365, L27
- Voges et al. (1999) Voges, W., Aschenbach, B., Boller, T., et al. 1999, A&A, 349, 389
- Warner (1995) Warner, B. 1995, Cataclysmic variable stars (Cambridge: Cambridge University Press)
- Woelk & Beuermann (1996) Woelk, U. & Beuermann, K. 1996, A&A, 306, 232
- Woudt & Warner (2004) Woudt, P. & Warner, B. 2004, in ASP Conf. Ser., Vol. 315, IAU Colloq. 190: Magnetic Cataclysmic Variables, ed. S. Vrielmann & M. Cropper, 39
- Wynn & King (1992) Wynn, G. A. & King, A. R. 1992, MNRAS, 255, 83