11email: baldi@oato.inaf.it 22institutetext: INAF - Osservatorio Astronomico di Torino, Strada Osservatorio 20, I-10025 Pino Torinese, Italy
22email: capetti@oato.inaf.it
Recent star formation in nearby 3CR radio-galaxies
from UV HST observations
††thanks: Based on observations obtained at
the Space Telescope Science Institute, which is operated by the
Association of Universities for Research in Astronomy, Incorporated,
under NASA contract NAS 5-26555.
We analyzed HST images of 31 nearby (z 0.1) 3CR radio-galaxies. We compared their UV and optical images to detect evidence of recent star formation. Six objects were excluded because they are highly nucleated or had very low UV count rates. After subtracting the emission from their nuclei and/or jets, 12 of the remaining 25 objects, presenting an UV/optical colors NUV - r 5.4, are potential star-forming candidates. Considering the contamination from other AGN-related processes (UV emission lines, nebular continuum, and scattered nuclear light), there are 6 remaining star-forming “blue” galaxies.
We then divide the radio galaxies, on the basis of the radio morphology, radio power, and diagnostic optical line ratios, into low and high excitation galaxies, LEG and HEG. While there is no correlation between the FR type (or radio power) and color, the FR type is clearly related to the spectroscopic type. In fact, all HEG (with one possible exception) show morphological evidence of recent star formation in UV compact knots, extended over 5-20 kpc. Conversely, there is only 1 “blue” LEG out of 19, including in this class also FR I galaxies.
The picture that emerges, considering color, UV, optical, and dust morphology, is that only in HEG recent star formation is associated with these relatively powerful AGN, which are most likely triggered by a recent, major, wet merger. Conversely, in LEG galaxies the fraction of actively star-forming objects is not enhanced with respect to quiescent galaxies. The AGN activity in these sources can be probably self-sustained by their hot interstellar medium.
Key Words.:
Galaxies: active – Galaxies: elliptical and lenticular, cD – Galaxies: photometry – Galaxies: evolution – Galaxies: interactions – Galaxies: starburst – Ultraviolet: galaxies1 Introduction
Both observational and theoretical studies have supported the idea of a co-evolution between supermassive black holes (SMBH) and their host galaxies. The observational evidence is derived from several pieces of evidence: the dynamical signature of the widespread presence of SMBH in galaxies (e.g Kormendy & Richstone 1995; Richstone et al. 1998; Kormendy & Gebhardt 2001), the relation between SMBH mass and the spheroid mass (Magorrian et al. 1998; McLure & Dunlop 2002; Marconi & Hunt 2003; Häring & Rix 2004), stellar velocity dispersion (Ferrarese & Merritt 2000; Gebhardt et al. 2000; Tremaine et al. 2002) and concentration index (Graham et al. 2001; Graham & Driver 2007). These relations were interpreted by e.g. Hopkins et al. (2007b) as various projections of a fundamental plane, which included the SMBH mass, analogous to a similar relation for elliptical galaxies (Dressler et al. 1987; Djorgovski & Davis 1987); this appears to be a sign of a common evolutionary process involving SMBH and galaxies.
The growth of a SMBH can occur via either gas accretion or coalescence with another SMBH during a merger event. Similarly, the growth of a galaxy can be associated with the capture of the stellar populations of another galaxy, due to either a merger or to star formation, which might be self-sustained or triggered by a merger. In this framework, nuclear activity (i.e. the manifestation of gas accretion onto a SMBH) and star formation are expected to be related, and for both processes mergers are likely to play a crucial role. Indeed, the hierarchical galaxy evolution scenarios support the idea that gas flows associated with galaxy mergers trigger both starburst and AGN activity (Kauffmann & Haehnelt 2000; Di Matteo et al. 2005). A connection between mergers, galactic starburst, and AGN activity has been well-established and modeled (e.g. Barnes & Hernquist 1991, 1996; Mihos & Hernquist 1994, 1996; Springel et al. 2005; Kapferer et al. 2005). Hopkins et al. (2006) presented a simulation in which starburst, AGN activity, and SMBH growth were connected by an evolutionary sequence, due to mergers between gas-rich galaxies. Observationally, studies of ultraluminous infrared galaxies (ULIRGs), distant submillimeter galaxies (SMGs), and quasars demonstrate that they are the remnants of major mergers, in which massive starbursts occur in combination with a dust enshrouded AGN (Barnes & Hernquist 1996; Schweizer 1998; Jogee 2006; Sanders et al. 1988a, b; Sanders & Mirabel 1996; Dasyra et al. 2007). Studies of QSO host galaxies also revealed the widespread presence of a young stellar population (e.g. Brotherton et al. 1999; Kauffmann et al. 2003; Sánchez et al. 2004; Zakamska et al. 2006). In Seyfert galaxies, evidence of nuclear, dusty, compact starbursts was found (Heckman et al. 1997; González Delgado et al. 1998). Apparently, AGN activity and star formation are connected also from a quantitative point of view, since the most luminous quasars have the youngest host stellar populations (Jahnke et al. 2004; Vanden Berk et al. 2006) and the most significant post-merger tidal features and disturbances (e.g. Canalizo & Stockton 2001; Hutchings et al. 2003; Letawe et al. 2007).
Most of studies focused on the general AGN population when radio-quiet AGN are not studied in isolation. However, there have been plentiful studies of analysis of radio-loud AGN, which are the focus of this paper. Observations of radio galaxies in the local Universe (Heckman et al. 1986; Smith & Heckman 1989; Colina & de Juan 1995) detected morphological features such as double nuclei, arcs, tails, bridges, shells ripples, and tidal plumes. In a substantial subset of radio galaxies, this suggests that the AGN activity is triggered by the accretion of gas during major mergers and/or tidal interactions. Furthermore, gas kinematics studies (Tadhunter et al. 1989 and Baum et al. 1992) supported the interpretation that mergers can represent the triggering process of SMBH/galaxies co-evolution. Studies of the spectral energy distribution (SEDs) of radio galaxies discovered that young stellar populations, indicative of a recent starburst, provide a significant contribution to the optical/UV continua, up to 25-40 %, of powerful galaxies at low and intermediate redshift (Lilly & Longair 1984; Smith & Heckman 1989; Tadhunter et al. 1996; Melnick et al. 1997; Aretxaga et al. 2001; O’Dea et al. 2001; Tadhunter et al. 2002; Wills et al. 2002; Allen et al. 2002; Wills et al. 2004; Raimann et al. 2005; Tadhunter et al. 2005; Holt et al. 2007). Apparently, AGN activity initiates at a later stage of the merger event than star formation (Emonts et al. 2006), which agrees with predications of numerical simulations (Hopkins et al. 2007a), although the precise length of the delay is not well constrained.
However, there are still several open questions, such as: (i) what is the fraction of nearby radio galaxies showing evidence for young stars?; (ii) is there a relationship between AGN properties and galaxy star-formation characteristics?; (iii) what is the role of mergers in triggering both AGN activity and star formation in radio-galaxies?
We consider these issues by adopting an alternative approach based on the analysis of UV images with the aim of detecting a young stellar population. More specifically, we analyzed HST/STIS observations of a sample of nearby radio galaxies from the 3CR catalogue. The flux level in the UV band ( 2500 Å), relative to the optical emission, is sensitive to very low levels of star formation, as demonstrated by GALEX data (the GALEX/NUV band is similar to the filter used to acquire the STIS images used in this study), by detecting fraction of as low as 1-3 % of young stars formed within the last billion years (Silk 1977 and Somerville et al. 2000). The HST UV images were already used for this purpose by O’Dea et al. (2001), who studied the radio-galaxy 3C 236. The sample considered is sufficiently large (31 objects) for statistical conclusions and is representative of the overall population of nearby radio galaxies.
Furthermore, Schawinski et al. (2006) recently analyzed GALEX and SDSS images of a significant number of non-active early-type galaxies. This study provides a well defined control sample that we can use as a benchmark for the star formation properties of quiescent galaxies to be compared with the measurements we will derive for radio-galaxies. We note that Schawinski et al. (2006) focused only on quiescent galaxies to avoid contamination by UV light from an active nucleus. For the sample that we consider here, the light produced by AGN activity (UV nuclei, and jets) can however be masked by taking advantage of the high resolution of the HST images.
The outline of this paper is the following. In Sect. 2, we describe the properties of the sample and HST observations, on which this study is based, as well as the reduction method used. In Sect. 3, we present our results by classifying the galaxies in terms of their NUV-r color profiles and UV morphology. In Sect. 4, we discuss the link between AGN and star formation properties, while in Sect. 5 we summarize our findings. The cosmological parameters used in this paper are H0 = 75 Mpc-1 and q0 = 0.5.
2 Observations and data reduction
We selected all 3CR radio-galaxies for which STIS near-UV observations were available in the public archive. The sample consists of 31 low-z radio-galaxies with z 0.1, apart form 3C 346 at z = 0.16. For 25 objects, the UV data were published by Allen et al. (2002). To this sample we added a subset of 6 objects observed by various HST projects. Our final sample represents 60 % of the entire 3CR sample with z 0.1 (49 galaxies) that contains an almost equal fraction (and coverage) of FR I and FR II galaxies. Since the objects discussed in Allen et al. (2002) sample were selected at random (since the data were obtained as part of a HST snapshot proposal) and only 6 objects were added our sample is representative of the entire low-z 3CR sample and has no evident selection biases.
We analyzed UV and optical HST images of our sample. All UV observations employed the STIS near-ultraviolet (NUV) Cs2Te Multianode Microchannel Array (MAMA) detector, which has a field of view of 2525′′ and a pixel size of 024. The filters used during observations were the following: most objects were observed with the F25SRF2 filter (centered on 2320 Å with a FWHM of 1010 Å); for three additional galaxies, the F25CN182 filter was used (with a pivot wavelength of 1983 Å and a FWHM of 630 Å), while the remaining 5 observations were obtained with the F25QTZ filter (centered on 2364.8 Å with a FWHM of 995.1 Å), which provides more effective rejection of the OI1302 Å geocoronal emission than F25SRF2. All of these filter band cutoffs remove geocoronal Ly emission. The observations log is given in Table 1.
The optical observations were acquired using the WFPC2 camera. Most objects were located in the PC field with a field of view of and pixel size of 04553. Some objects were located in the WF fields, which individually have a field of view of 1.31.3′ and pixel size of . For all galaxies, the used filter was F702W with a pivot wavelength of 6919 Å and a bandwidth of 1385 Å 111Only one object (3C 192) lacked the WFPC2 images and then its SDSS optical image has been employed. The WFPC2 exposure times were 280 s or 560 s. The optical observations were published by de Koff et al. (1996) and Martel et al. (1999).
The UV and optical images were processed by the standard HST pipeline, developed at the STScI, in the package STSDAS in IRAF222IRAF is distributed by the National Optical Astronomical Observatories, which are operated by the Association of Universities for Research in Astronomy, Inc., under cooperative agreement with the National Science Foundation. which corrects for flat-fielding and, for optical images, also bias subtraction. For optical data, the CCD images were combined and the cosmic-ray events were cleaned in a single step using the IRAF/STSDAS task crrej, when multiple exposures of the same target were available; otherwise cosmic rays were removed using the task cosmicrays of the IRAF package.
The images were flux calibrated by using the keyword PHOTFLAM in the calibrated science header file, and divided by the value of the keyword EXPTIME (exposure time). The expected calibration error was given by the error in the value of PHOTFLAM: for optical band images, this was 2 % and, for the UV band, this was 5 %.
2.1 UV / optical colors
To estimate the UV / optical colors, we measured the total UV and optical flux for each object in the sample. The optical images were registered onto the UV images; the registration was performed after re-binning the UV images to a pixel size of 045 as to enable detection of regions of low brightness UV emission. We registered the images by aligning, when present in the field of view, optical and UV nuclei and other objects (companion galaxies and/or stars). Otherwise, in the case of diffuse sources (e.g. 3C 40), we cross-correlated the UV with the R images to estimate the relative shift.
Different masks, defined individually for each galaxy, were applied to both images, which identified areas containing nearby galaxies or stars. More importantly, we flagged regions contaminated by emission from extended jets. The presence of a optical and/or UV jet is noted in the Table 1. Similarly, we masked the nuclear regions (with a typical size of 012-025) in all objects where the studies of Chiaberge et al. (1999) and Chiaberge et al. (2002) identified the presence of unresolved nuclei in the optical and/or UV images (as marked in Table 1).
The background level was estimated from a circular annulus of 125 in radius and 36 in width for both the optical and UV images. This was the largest region in the UV images that had not been contaminated by enhanced dark current at the edges of the STIS detector. For objects located close to the edges of the frame, we used instead circular sectors for the background estimate. The UV background rate measurements were compared with those obtained from the same images by Allen et al. (2002): our values were in good agreement with their estimates, although they are lower on average by 20% (and as much as 40 % for one object). This is most likely because the region that we used to measure the background was located at larger radii from the center of the galaxy.
We measured UV and optical fluxes within a set of concentric apertures, centered on each object, with different radii 2′′, 4′′, 6′′, 8′′, and 10′′. From the total counts within each region, we subtracted the estimated background and applied the appropriate photometric conversion to obtain a flux in units of erg s-1 cm-2 Å-1. These fluxes were then transformed onto the AB magnitude system and used to estimate the NUV-R color. With this approach, we measured the integrated NUV-R color integrated over different apertures out to the distance at which the error in the color was smaller than 0.2 mag333The error in the NUV-R color increases with increasing aperture due to the uncertainty in the UV background..
At this stage, we discarded 6 galaxies of the sample. For two objects (namely 3C 353 and 3C 452), the integrated UV count rate was insufficient to measure accurately (with an error smaller than 0.5 mag) the galaxy’s color. Four targets (namely 3C 227, 3C 371, 3C 382, and 3C 390.3) were highly nucleated. The color of these galaxies were strongly dependent on the nuclear subtraction and so it was difficult to separate any genuine diffuse emission from the halo of the bright nuclear point source that might dominate even at significant distances from the galaxy center.
After these procedures, we obtained the NUV-R color profiles for 25 3CR radio-galaxies, which are shown in Fig. 1 (grouped into the categories described in Sect. 3). The NUV-R colors obtained were corrected for Galactic absorption by an amount equal to 2.48E(B-V), derived from the extinction in the form given by Cardelli et al. (1989). In most cases (and we highlight the few exceptions below), the color profiles were flat with color variations smaller than mag. Therefore, the color for each galaxy was almost independent of the aperture used.
| Name | Filter Exp. time | Date | Opt CCC | UV CCC | Opt Jet | UV Jet | |
|---|---|---|---|---|---|---|---|
| 3C 015 | F25QTZ | 7230 | 01-01-27 | YES | YES | NO | YES |
| 3C 029 | F25SRF2 | 1440 | 01-01-27 | YES | YES | NO | NO |
| 3C 035 | F25SRF2 | 1440 | 99-10-21 | NO | NO | NO | NO |
| 3C 040 | F25SRF2 | 1440 | 00-06-03 | NO | NO | NO | NO |
| 3C 066B | F25SRF2 | 1440 | 99-07-13 | YES | YES | NO | YES |
| 3C 078 | F25QTZ | 2000 | 00-03-15 | YES | YES | YES | YES |
| 3C 192 | F25SRF2 | 1440 | 00-03-23 | NO | NO | NO | NO |
| 3C 198 | F25SRF2 | 1440 | 00-04-23 | YES | YES | NO | NO |
| 3C 227 | F25SRF2 | 1440 | 00-01-25 | YES | YES | NO | NO |
| 3C 236 | F25SRF2 | 1440 | 99-10-05 | NO | NO | NO | NO |
| 3C 264 | F25QTZ | 3600 | 00-02-12 | YES | YES | YES | YES |
| 3C 270 | F25SRF2 | 1440 | 00-03-05 | YES | NO | NO | NO |
| 3C 274 | F25QTZ | 640 | 03-06-08 | YES | YES | YES | YES |
| 3C 285 | F25SRF2 | 1440 | 00-04-16 | YES | NO | NO | NO |
| 3C 293 | F25SRF2 | 1440 | 00-06-14 | NO | NO | NO | NO |
| 3C 296 | F25SRF2 | 1440 | 00-04-15 | YES | NO | NO | NO |
| 3C 305 | F25SRF2 | 1440 | 00-04-27 | NO | NO | NO | NO |
| 3C 310 | F25SRF2 | 1440 | 00-06-10 | YES | YES | NO | NO |
| 3C 317 | F25SRF2 | 1440 | 99-07-26 | YES | YES | NO | NO |
| 3C 321 | F25SRF2 | 1440 | 00-06-05 | NO | NO | NO | NO |
| 3C 326 | F25SRF2 | 1440 | 00-03-12 | NO | NO | NO | NO |
| 3C 338 | F25SRF2 | 1440 | 00-06-04 | YES | YES | NO | NO |
| 3C 346 | F25QTZ | 3600 | 00-08-22 | YES | YES | YES | YES |
| 3C 353 | F25SRF2 | 1440 | 00-06-22 | NO | NO | NO | NO |
| 3C 371 | F25QTZ | 7989 | 00-09-21 | YES | YES | NO | NO |
| 3C 382 | F25CN182 | 1440 | 00-02-23 | YES | YES | NO | NO |
| 3C 388 | F25SRF2 | 1440 | 00-06-02 | YES | YES | NO | YES |
| 3C 390.3 | F25CN182 | 1440 | 99-08-10 | YES | YES | NO | NO |
| 3C 449 | F25SRF2 | 1440 | 00-04-16 | YES | YES | NO | NO |
| 3C 452 | F25CN182 | 1440 | 00-01-30 | NO | NO | NO | NO |
| 3C 465 | F25SRF2 | 1440 | 00-05-25 | YES | YES | NO | NO |
2.2 Cross-calibration of NUV-R colors
The previous studies of galaxy UV/optical color analysis were performed using GALEX and SDSS observations, by measuring the NUV-r color, while we used NUV and optical HST observations. Before we can compare our HST-based NUV-R color, which for clarity we refer to as (NUV-R)HST, with results present in the literature, we must complete a cross-calibration between GALEX, SDSS, and HST data.
The GALEX near-ultraviolet filter is centered on = 2271 Åwith = 732 Å. The images correspond to a circular field of view of radius 38 and a spatial resolution of . The Sloan Digital Sky Survey (SDSS) images (Fourth Data Release) have a field of view of 13.518.98 and a pixel size of 0396. The r-filter band is centered at 6231 Å with a FWHM of 1373 Å.
The filter transmission curves are shown in Fig. 2, with a typical spectrum of an old (11 Gyr) stellar population. We note that the STIS passbands are wider than the GALEX/NUV passband, while there is a small shift between the centers of the SDSS and HST/F702W optical filters.


Ideally, cross-calibrations should be performed by directly comparing images of the same objects taken with different telescopes in the band of interest. However, the object with the highest value of total counts in the GALEX NUV image in our sample is 3C 040, observed as part of the MIS survey. However, even for this object the flux ratio between HST and GALEX (0.7 0.2) has an associated error that it is too large for a meaningful cross-correlation.
We therefore decided to compare the GALEX and HST data using stellar population synthesis models; this was similar to the method described by Proffitt (2006). We used 18 models from Bruzual & Charlot (2003) in a grid of different age (1,3,5,7,9, and 11 Gyr) and metallicity (0.008, 0.02 [= Z⊙], and 0.05). We convolved these spectra with the different transmission curves in NUV and optical bands to compare the resulting fluxes and estimate the color correction to be applied to the HST colors.
As shown in Fig. 3, left panel, the conversion of the NUV magnitude from STIS to GALEX has a significant dependence on the stellar population age and metallicity. For a redder stellar population, the larger width of the STIS filter towards longer wavelength, increases the measured STIS flux with respect to the GALEX data. The correction that has to be applied to the STIS data has an almost linear dependence on (NUV-R)HST.
Conversely, the correction to convert the optical band images from the WFPC2 to SDSS bandpasses is far smaller and has only a weak trend with stellar population, since in this band the spectrum is flat. In this case, we were able to check directly the results of the stellar population analysis by comparing the fluxes for the same aperture in the HST/WFPC2 (opportunely convolved) and SDSS r-band images. The results obtained confirmed the need for only a small magnitude correction (a few hundredths of a magnitude).
In the middle panel of Figure 3, we show the correspondence between the NUV-R HST colors and the NUV-r color in the GALEX/SDSS system. It can be reproduced with a linear relation in the form:
(NUV-r) - (NUV-R)HST = 0.16 [(NUV-R)HST - 4] - 0.07
In the right panel of Figure 3, we present the residuals from this linear relation of 0.2 mag, which we adopt as a conservative error in the color conversion.
We applied the same method used for the STIS/F25SRF2 filter to the STIS/F25QTZ filter, which differs only slightly with short wavelength cutoff at longer wavelength. The color conversion in this case is
(NUV-r) - (NUV-R)HST = 0.15 [(NUV-R)HST - 4] - 0.04
We also tested the cross-calibration between GALEX-SDSS and HST data by using a two-stellar-populations galaxy model and varying the relative contribution of a 1 Gyr and 11 Gyr stellar population models at three different metallicities. We obtained a quasi-linear cross-calibration relation, which links the points of the two individual populations in Fig. 3. The maximum residual is 0.2 mag, similar to our typical single-stellar-population model cross-calibration error.
In Table 2, we indicate the aperture size used for each object and the corresponding color. This (NUV-R)HST color was transformed into the NUV- r color using the prescription described above.


| 3C | z | log | FR - E.L. | MR | E(B-V) | (NUV-R)HST | aperture (′′ kpc) | UV morphology | ||
|---|---|---|---|---|---|---|---|---|---|---|
| 15 | 0.073 | 26.2 | I/II - LEG | -22.41 | 0.022 | 5.87 0.06∗ | 10 | 14.1 | disky | |
| 29 | 0.0447 | 25.8 | I | -22.73 | 0.036 | 231 | 6.2 0.1 | 10 | 7.0 | |
| 35 | 0.0670 | 26.0 | II - LEG | -22.34 | 0.141 | 5.6 0.2 | 6 | 2.6 | ||
| 40 | 0.0177 | 25.2 | II - LEG | -22.62 | 0.041 | 242 | 5.58 0.02 | 10 | 3.5 | |
| 66B | 0.0215 | 25.4 | I | -23.42 | 0.080 | 5.76 0.03 | 8 | 3.3 | ||
| 78 | 0.029 | 25.5 | I | -23.23 | 0.173 | 263 | 4.96 0.03∗ | 10 | 5.6 | disky |
| 192 | 0.060 | 26.2 | II - HEG | -21.60 | 0.054 | 4.93 0.05 | 6 | 6.9 | knotty | |
| 198 | 0.0815 | 26.1 | II - HEG | -20.82 | 0.026 | 174 | 3.09 0.09 | 8 | 12.6 | knotty |
| 227 | 0.0861 | 26.7 | II - WQ | -21.42 | 0.026 | nucleated | ||||
| 236 | 0.0989 | 26.5 | II - HEG | -23.10 | 0.011 | 5.04 0.08 | 8 | 11.7 | knotty | |
| 264 | 0.0217 | 25.4 | I | -22.51 | 0.023 | 271 | 5.87 0.02∗ | 10 | 4.2 | disky |
| 270 | 0.0073 | 24.8 | I | -22.11 | 0.018 | 309 | 5.21 0.01 | 8 | 1.2 | |
| 274 | 0.0037 | 25.6 | I | -22.39 | 0.022 | 333 | 5.14 0.01 | 10 | 0.85 | |
| 285 | 0.0794 | 26.1 | II - HEG | -22.26 | 0.017 | 181 | 3.79 0.03 | 8 | 12.3 | knotty |
| 293 | 0.0452 | 25.8 | I/II - LEG | -22.10 | 0.017 | 201 | 4.30 0.03 | 10 | 8.7 | knotty |
| 296 | 0.0237 | 25.2 | I | -23.38 | 0.025 | 5.59 0.01 | 10 | 4.8 | ||
| 305 | 0.0414 | 25.8 | I/II - HEG | -22.88 | 0.029 | 193 | 4.62 0.02 | 10 | 8.1 | knotty |
| 310 | 0.0540 | 26.5 | I | -22.30 | 0.042 | 209 | 5.4 0.1 | 10 | 6.3 | |
| 317 | 0.0350 | 26.1 | I | -23.18 | 0.037 | 216 | 5.21 0.04 | 10 | 6.7 | |
| 321 | 0.0960 | 26.4 | II - HEG | -22.58 | 0.044 | 3.32 0.03 | 6 | 11.2 | knotty | |
| 326 | 0.0885 | 26.5 | II - LEG | -21.71 | 0.053 | 6.0 0.2 | 4 | 3.5 | ||
| 338 | 0.0298 | 26.0 | I | -23.50 | 0.012 | 310 | 5.41 0.02 | 8 | 4.7 | |
| 346 | 0.1610 | 26.8 | II - LEG | -22.11 | 0.067 | 5.4 0.2 | 4 | 12.6 | ||
| 353 | 0.0304 | 26.7 | II - LEG | -21.36 | 0.439 | 5.0 0.5 | 2 | 1.2 | ||
| 371 | 0.051 | 26.5 | II - BLLAC | -22.66 | 0.036 | nucleated | ||||
| 382 | 0.0578 | 26.2 | II - WQ | -23.50 | 0.070 | nucleated | ||||
| 388 | 0.0908 | 26.6 | II - LEG | -23.07 | 0.080 | 408 | 5.8 0.2 | 8 | 10.7 | |
| 390.3 | 0.0561 | 26.5 | II - WQ | -22.21 | 0.071 | nucleated | ||||
| 449 | 0.0171 | 24.9 | I | -21.96 | 0.167 | 253 | 4.57 0.03∗ | 10 | 3.3 | disky |
| 452 | 0.0811 | 26.9 | II - HEG | -22.21 | 0.137 | 6.0 1.6 | 2 | 3.1 | ||
| 465 | 0.0293 | 25.8 | I | -23.64 | 0.069 | 356 | 5.37 0.03 | 10 | 5.9 | |
Column description. Col. (1): 3CR source name. Col. (2): redshift (from NED). Col. (3): Log radio power (W Hz-1) at 178 MHz taken by Allen et al. (2002) and Kellermann et al. (1969). Col (4): radio morphological and optical spectral classification, as taken from Jackson & Rawlings (1997) and from the website http://www.science.uottawa.ca/∼cwillott/3crr/3crr.html with the only variation from the literature is the classification of 3C 236 in HEG derived from SDSS data. Col. (5): magnitude in R band as taken from Donzelli et al. (2007) and from NED. Col. (6): galactic extinction (from NED). Col. (7): stellar velocity dispersion taken from Hyperleda, the website http://www.mpa-garching.mpg.de/SDSS/DR4/raw_data.html and Smith et al. (1990). Cols. (8): NUV-r integrated color on the greater available aperture with the corresponding scale radius in (9) arcsec and (10) kpc. The objects labelled with * are the UV-disky galaxies, whose (NUV-R)HST colors, corrected excluding the UV disks contaminated by the emission lines (see Sect. 3.1), are: 6.1 0.1 for 3C 015 , 5.24 0.08 for 3C 078, 6.06 0.06 for 3C 264, and 5.2 0.1 for 3C 449. These NUV-r colors are those that we finally use in the plots. Col. (11): UV morphology.
3 RESULTS
As described by Schawinski et al. (2006), the NUV-r color can be used as a means of identifying recent star formation. They adopted a threshold at NUV-r 5.4 to separate “red” quiescent galaxies from “blue” galaxies with active star formation. This value is suggested by both theoretical population synthesis models, although the availability of these models is limited, and empirical data (Lee et al. 2005). Despite the possible presence of an UV upturn, observed often in early-type galaxies (Code & Welch 1979 and Burstein et al. 1988), passively evolving galaxies do not appear to have NUV-r colors bluer than 5.4. Given our 0.2 mag calibration uncertainty, we consider only galaxies bluer than NUV-r 5.2 to be bona-fide “blue” galaxies.
On the basis of this criteria for the integrated colors and UV morphology, the galaxies of the sample can be divided in 3 main categories:
-
1.
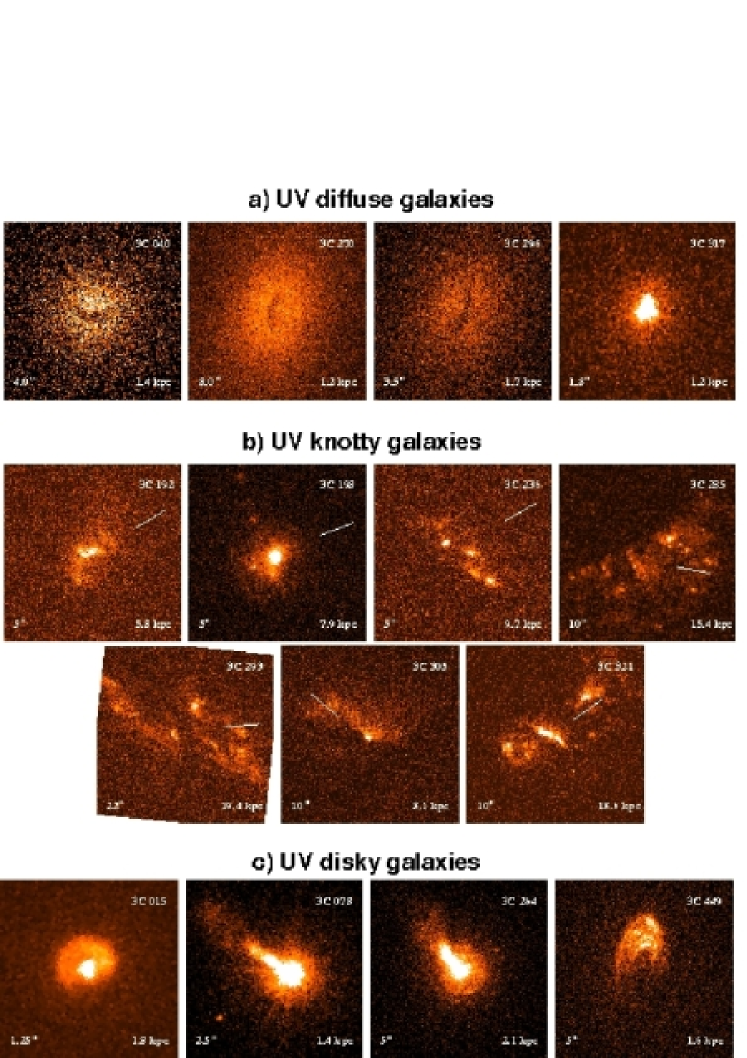
quiescent red galaxies: 14 object have red and flat integrated color profiles (Fig. 1 a,b,c). They lack any sign of significant recent star formation, since, apart from emission from the active nucleus (and from extended UV/optical jets), we detect only diffuse UV light tracing the optical emission (Fig. 4, a panel). We note that this description applies to the 7 galaxies with 5.2 NUV-r 5.6, whose classification is uncertain due to our calibration accuracy of 0.2 mag.
-
2.
blue UV-clumpy galaxies: 7 objects have NUV-r 5.2 and show a clumpy UV morphology (and they are labeled as “knotty” in Table 2), which are usually associated with dust lane structures (see Fig. 4, b panel). Their color profiles show different trends, since in some cases NUV-r increases toward larger radii (Fig. 1, d panel), but the opposite behavior is also observed (e panel). Their UV emission is extended over 5-20 kpc.
-
3.
UV-disky galaxies: 2 objects (namely 3C 078 and 3C 449) have a blue NUV-r color, but the UV emission is located co-spatially with the circum-nuclear dusty disk (Fig. 4, c panel). Another 2 galaxies (namely 3C 015 and 3C 264), although globally red, show similar UV emission, which is associated with their disks. In all cases, the NUV-r color increases toward larger radii and, by extending the color profile to apertures smaller than 2′′ in 3C 015 and 3C 264, they also reach a blue color. All of these bright UV disks have scales of 0.5-1 kpc and these galaxies are labeled as disky in Table 2.
3.1 Origin of UV excess
As explained above, in quiescent early-type galaxies a color bluer than NUV-r 5.4 can be considered as evidence for the presence of a young stellar populations. However, in active galaxies, it is fundamental to assess the origin of this UV emission. Other emission processes related to the presence of an AGN can contribute to this excess, in particular UV nuclear scattered light, nebular continuum, and emission lines. Emission line images represent a useful tool to tackle the issue of AGN UV contamination. The sites where emission lines are produced mark the geometrical intersection between the interstellar medium and the nuclear ionizing light, i.e. the regions where both UV lines and UV scattered light can be found. This analysis is crucial in particular for the “blue” objects.
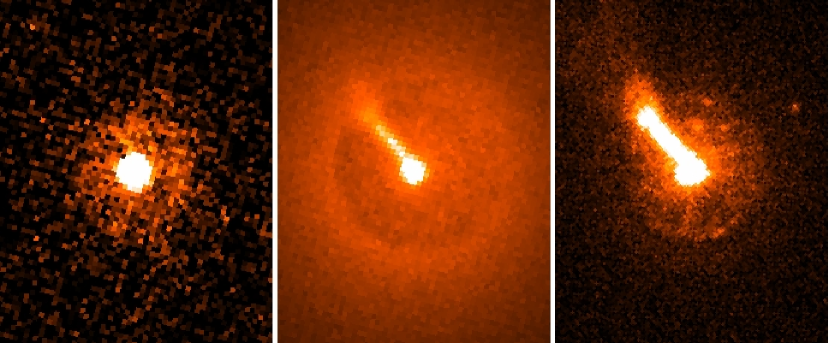
We focused on the UV-disky galaxies with UV emission, that is cospatial with a circum-nuclear dusty disk. We then considered H images from the HST archive, which are available for 3C 078, 3C 264, and 3C 449. In all 3 galaxies, there was a clear morphological correspondence between the UV and H emitting regions (for example see Fig. 5), which suggests a possible contribution from UV emission lines. We then quantified the fraction of contamination of emission lines to the total UV light by opportunely scaling the H flux. We adopted the line ratios measured by Dopita et al. (1997) in the emission line disk of M87, a well studied analogue to our disked sources, for which HST UV spectroscopy is available. We found that UV emission lines contribute for between 50 and 80 % of the UV light within the area covered by the disk, with the strongest contribution originatin in C IV. The contamination would be even stronger adopting the UV/optical line ratios measured by Ferland & Osterbrock (1986) in the NLR region of nearby AGN, where the C IV line is more prominent. These results (that we extend for analogy to the fourth galaxy in this group, 3C 015, already classified as a red object) suggest that the disk-like structures seen in UV light are due to line emission and not to a young stellar population. Excluding the disk regions, both “blue” UV-disky objects have a redder integrated NUV-r color of 5.3 and 5.4, for 3C 449 and 3C 078 respectively.
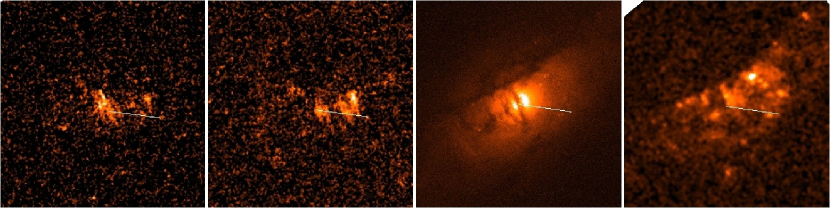
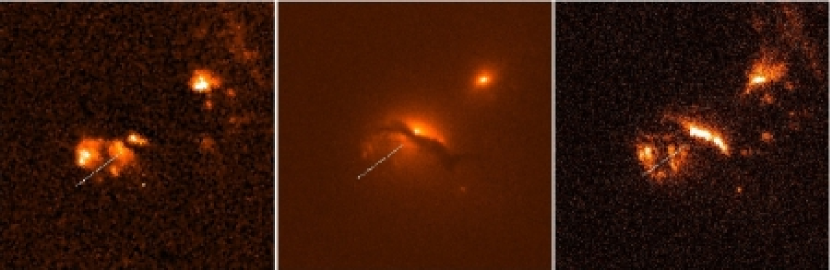
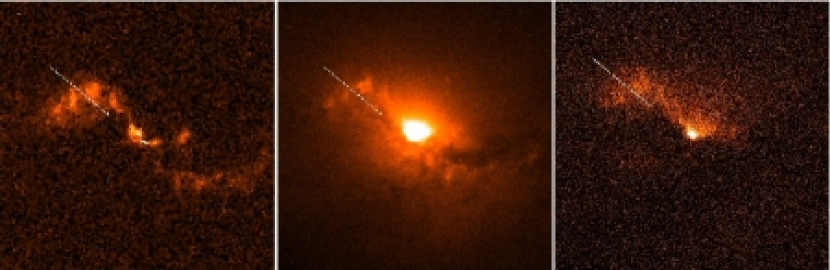
We then focused on galaxies that present a clumpy morphology in UV emission. In analogy with the analysis performed on UV-disky galaxies, we selected emission-line images (in H and [O III]) from the HST archive, which were available for 3C 285, 3C 305, and 3C 321. We then considered each object individually: 1) in 3C 285, the H emission was cospatial with the dust feature bisecting its nuclear region, while the [O III] emission is confined to a one-sided elongated structure well aligned with its radio axis (see Fig. 6 top panels). There appears to be no significant contribution by AGN related processes to the large scale UV emission in this galaxy, since this is far more extended and not cospatial with the line-emitting regions; 2) in 3C 321 (reminding that the companion galaxy on the NW side was masked in our analysis), the H-line image presents a well defined conical morphology centered on the SE radio jet. The same structure is seen in UV light and this provides strong support for AGN contamination (either scattered light or line emission) in this region. However the UV light in this object originates for about 2/3 of the total flux from the chain of knots associated with the nuclear dust lane that most likely represents an extended region of star formation, since it has no counterpart in the H image and is unrelated to the radio-structure; 3) in 3C 305, the emission line takes the form a S-shaped structure, aligned with the radio axis, reminiscent of what is often found in Seyfert galaxies (e.g. Mrk 3, Capetti et al. 1999). The UV emission has a similar structure and this indicates possible AGN contamination444As discussed below not from nebular processes, but eventually from scattered light.. However, the location of the UV emission knots, cospatial with the nuclear dust structure, might support the possiblity that they are star-forming regions. Based on our data alone, we cannot reach a robust conclusion. However, stellar population synthesis models applied to long slit spectra of 3C 305 imply that a young, spatially extended, stellar population is present(Tadhunter et al. 2005) and we therefore consider this object to be an actively star-forming galaxy.
For the remaining 4 objects, whose HST emission-line images are unavailable, we note that, in the case of scattered nuclear UV light, as expected by the AGN unification model, the UV light should be aligned with the radio-axis as observed for 3C 285 and 3C 321. Although such UV/radio alignment might possibly be present in 3C 192, no association between radio and UV light in the other 3 UV-knotty galaxies is present. A stronger link is instead present with the dust structures, as already noted by Allen et al. (2002) from the inspection of the optical HST images. For example, in both 3C 305 and 3C 321 the brighter UV knots closely follow the edges of the dust lanes bisecting their host galaxies. A similar association is seen also in 3C 285 and 3C 293.
We now consider the possibility of an emission line origin for the UV excess. All seven “blue” UV-clumpy galaxies were observed with the F25SFR2 filter, including Ly at the edge of the transmission curve. Given their redshift, this corresponds to a low transmission efficiency (0.02-0.07 relative to the transmission peak). With a filter width of about 1000 Å, significant contamination is expected only for extreme values of the Ly equivalent width of approximately 15000-50000 Å. More quantitatively, the Ly fluxes can be measured from the H fluxes (see Table 3) taken from our own optical spectroscopy (Buttiglione et al. 2008), by adopting a scaling of FLyα/FHβ = 55 (Ferland & Osterbrock 1986). Line contamination is estimated to be typically 1 - 4 % and has a negligible effect on the integrated colors. Furthermore, since the line emission tends to be strongly nuclear concentrated (Mulchaey et al. 1996), most is contained within the nuclear region and is therefore excluded from our UV flux measurements. Concerning the other bright UV lines (i.e. C IV, C III], and Mg II), they are a factor of 5 to 30 times fainter than Ly; despite the higher throughput of the F25SFR2 filter at their respective wavelengths, their contribution to the UV flux is therefore also negligible.
Nebular continuum emission also contributes to the UV emission. We estimated that the UV contamination from nebular continuum at 2300 Å (the center of the passband of the STIS images) is 0.004 H in the low density limit and for a temperature of 104 K, adopting the coefficients given by Osterbrock (1989). The contamination from nebular continuum is estimated on a source-by-source basis (from the values reported in Table 3). In a similar way to the UV emission-line contamination, the nebular continuum affects the global NUV-r color by less than approximately 0.1 mag (see the percentages of nebular contamination in Table 3).
| Name | UV cont. | H | neb. cont. (%) | neb. cont (%) |
|---|---|---|---|---|
| photometric | spectroscopic | |||
| 3C 192 | 10 | 32 | 11 | 9.7 (1) |
| 3C 198 | 22 | 34 | 6 | 1 (2) |
| 3C 236 | 10 | 13 | 5 | 1 (2) |
| 3C 285 | 24 | 6 | 1 | 1.8 (2) |
| 3C 293 | 46 | 6 | 1 | 10 (3) |
| 3C 305 | 68 | 26 | 2 | 10 (3) |
| 3C 321 | 33 | 4 | 1 | 0.3-25.2 (2) |
Column description: (1): source name; (2): STIS UV flux in units; (3) H fluxes in units; (4) percentage of UV contamination from nebular continuum with our photometric analysis and (5) with spectroscopic analysis from literature (6): 1, Wills et al. (2002); 2, Holt et al. (2007); 3, Tadhunter et al. 2005 (the range depends on the size of the aperture used).
Until now, we have not taken into account the effects of internal reddening, which is clearly an important issue considering the large coverage of the NUV-R color and the presence of dust in several targets. We discuss the reddening effects for our sample, considering separately the three different classes of galaxies:
-
1.
knotty blue galaxies: they all indeed have extended dust structures. However, the reddening-corrected NUV-R color would be even bluer than the uncorrected values. The presence of dust makes us overestimate the contamination from UV line emission and nebular continuum, strengthening the case for a young stellar population in these objects.
-
2.
Red quiescent galaxies: they typically have no significant dust lanes that can absorb UV and optical light. This is confirmed by the flatness of their NUV-R color profiles at different radii. Therefore, the internal reddening effect in these objects is likely to be negligible.
-
3.
Blue/red disk galaxies: the correction for internal reddening associated with their dusty disks would indeed make these objects bluer, and, furthermore, the absorption from this disk leads to an overestimate of the contamination from UV line emission, which we call their UV excess. We estimated the typical absorption of these disks, taking from the literature the V-R and R-I color excesses that they cause (Martel et al. 2000). The corresponding color excess is E(UV-R) = 0.15 - 0.52. Therefore the line contamination is not significantly altered by absorption within these disks (since the line flux is reduced only by 15-40%) and it is sufficient to cause their blue colors, even after reddening correction.
We conclude that internal reddening causes to appear the knotty galaxies even bluer and is negligible for the other objects. Therefore it does not affect our main results.
All of these arguments imply that only a young stellar population can explain the UV excess in these early-type galaxies, apart from the possible exceptions of 3C 192.
4 Discussion
We focus on the global integrated NUV-r color of the objects in the 3C sample. For the UV-disky galaxies, the NUV-r global color is measured from the region of the galaxies outside their UV disks, contaminated by emission lines.
The NUV-r color distribution of our sample (see Fig. 7) is peaked at NUV-r 5.4 but with a substantial blue tail. Comparing our results with those found by Kauffmann et al. (2006) for a volume-limited sample of AGN hosted by massive bulge-dominated galaxies, we note that the color distribution of their AGN, limited to those for the same range of stellar velocity dispersion ( 180 km/s), is similar to that estimated from our sample.

We consider in more detail the connection between AGN and recent star formation. First of all, the NUV-r color is not simply related to the radio power (see Fig. 8). While the bluest galaxies are all at relatively high values of radio power at 178 MHz (P178MHz), we also find many of the reddest galaxies at the high end of radio luminosities.

In Fig. 9 (upper panel), we separate the objects depending on their FR morphological class (Fanaroff & Riley 1974). All bona-fide blue galaxies belong to the FR II class or intermediate FR I/FR II objects, while no blue galaxy of FR I class is found. However, in the FR II classes, we find almost equal numbers of “blue” and “red” galaxies. No simple trend between NUV-r color and radio morphology is therefore present.
We now investigate whether there is a connection between the extent of the radio emission and color. At least in the case of FR II, the radio-source size is related to its age. A small radio source size could relate to a recent onset of activity, triggered by a more recent merger, with a higher possibility of detecting the induced event of star formation with respect to large radio sources. On the basis of these considerations, we measured the radio source sizes of the FR II galaxies from images in the literature. For the blue galaxies, two objects, 3C293 and 3C305, were associated with a small-scale, 4 and 5 kpc, respectively, radio sources. All of the other 5 blue objects were instead several hundreds of kiloparsec in size. They included also 3C 236, which O’Dea et al. (2001) suggested was just re-ignited radio-source, based on the presence of a small-scale radio emission superimposed on a large-scale emission. For the red galaxies, 3C 353 and 3C 388 have small-scale radio emission (12 and 8 kpc, respectively), while the remaining sources have far larger dimensions. There appears to be no simple relation between the color and the radio emission size for FR II galaxies.
Instead, if we separate the sample on the basis of their excitation level using the diagnostic optical line ratios (i.e. into low and high excitation galaxies, LEG and HEG, Laing et al. 1994 and Jackson & Rawlings 1997), the situation is far clearer (see Fig. 9, lower panel). All six high-excitation galaxies are blue and, apart from possibly 3C 192, they all show evidence of recent star formation; the sub-sample of HEG is in fact essentially coincident with the blue UV-clumpy sub-sample. The fraction of star-forming HEG is far in excess of what found by Schawinski et al. (2006) in their sample of quiescent galaxies, which is 20-25 % for objects in the same range of velocity dispersion or galaxy luminosity.

Conversely, there is only 1 blue LEG (namely 3C 293) out of 19, including all FR I in this class. The substantial tail of blue objects found by Schawinski et al. (their Fig. 1) does not appear to be present in this class of objects, and this strongly disfavours the possibility of enhanced star formation in LEG hosts, although the possible effects of the different environment should also be considered (see the discussion below).
Therefore, it appears that a connection between recent star formation and nuclear activity in 3CR hosts is only present in high excitation galaxies.
We now consider in more detail the properties and differences between the HEG and LEG classes. Both the UV emission and dust structures in HEG suggest that these galaxies underwent a recent major merger and the highly chaotic and unsettled morphologies imply an external origin for the dust (Tremblay et al. 2007). The amount of dust derived by de Koff et al. (2000), using optical absorption maps, and Müller et al. (2004), from ISO and IRAS observations, in HEG galaxies is also quantitatively larger than in LEG (see Fig. 10). This indicates that a significant amount of gas is provided by the cannibalized object and appears to correspond to a “wet” merger.
Conversely, with one exception, we found no evidence of recent star formation in the LEG galaxies. Dust is observed in many of these galaxies, although only in the form of circum-nuclear disks. While the formation mechanisms of these structures are still largely unknown, Temi et al. (2007) proposed that the accumulation of cold dust in the central regions of massive ellipticals is due to mass loss from red giant stars in the galaxy core and is therefore of internal origin. Their optical and UV morphologies are also relaxed and lack clear signs of a recent merger. Colina & de Juan (1995) found evidence of subtle isophotal disturbances in FR I galaxies, which could represent “dry” mergers at a late stage.


In terms of nuclear activity, HEG are associated to brighter AGN than LEG. Within our sample, HEG have a median [O III] luminosity555 Narrow emission-line luminosities, of in particular the [O III] line, provide robust orientation-independent measures of the intrinsic AGN luminosity (e.g. Mulchaey et al. 1994). higher by a factor of 30 with respect to LEG (Chiaberge et al. 2002). This is reminiscent of the luminosity segregation between high and low excitation AGN found by Kewley et al. (2006), since they find that the median [O III] luminosity for LINERs and Seyfert galaxies (the radio-quiet analogous to LEG and HEG) differ by a factor of 16, Seyfert galaxies being brighter. We note that Kewley et al. (2006) also found that LINERs are older, more massive, less dusty, and have higher velocity dispersions than Seyfert galaxies, which is analogous to differences found between LEG and HEG.
In low luminosity radio galaxies or LEGs from a spectroscopic point of view, the results by Allen et al. (2006); Balmaverde et al. (2008) indicate that the accretion rate from the hot interstellar medium is proportional to the kinetic output of their jets. This is an indication that this mode of accretion (self-sustained by the interstellar medium) provides a sufficient energy input to power their jets. The higher AGN luminosity of HEG suggests that for these objects there is the need of gas of external origin to satisfy their energy requirements.
Another element of difference between HEG and LEG is their environment. It is well known that FR I are located in regions of higher galaxy density, often at the center of galaxy cluster, than FR II (Zirbel 1997). Furthermore, among the FR II radio-galaxies, LEG are often found in clusters of galaxies (Chiaberge et al. 2000), while HEG usually inhabit groups. The different galactic environments can lead, at least from a statistical point of view, to the different star formation manifestations between HEG and LEG. In fact, in groups of galaxies, the low relative velocity between objects and the higher fraction of gas-rich galaxies increase the probability of major “wet” merger events, whereas in cluster of galaxies, mostly “dry” mergers occur. This favors the conditions to trigger, via a “wet” merger, a powerful AGN and significant star formation in the group galaxies and explains the different environments between HEG and LEG.
The picture that emerges, considering i) NUV-r color, ii) UV and optical morphology, iii) dust content, iv) nuclear luminosity, and v) environment is that a recent major “wet” merger is needed to trigger the relatively powerful AGN and copious star formation associated with the HEG. Conversely, in LEG galaxies the fraction of actively star-forming objects is not enhanced with respect to that observed in quiescent galaxies. The accretion of the interstellar medium also provides a sufficient energy input to power LEGs, without the need for an external gas supply.
These results add to the list of differences between high and low excitation radio-galaxies, which include the presence, only in HEG, of a prominent Broad Line Region, an obscuring torus, and a radiatively efficient accretion disk. All of these features are linked to their availability of sufficiently high amounts of gas to form these structures. It is also possible that HEG and LEG are linked by an evolutionary sequence. A FR I (or LEG) galaxy might become a HEG when affected by a merger; at a later stage, when the fresh gas is exhausted in the galaxy by star formation and accretion onto the SMBH, the galaxy may revert to a quiescent LEG state.
We now compare our results with previous studies of the recent star formation in radio-galaxies based the optical spectroscopy. Unfortunately, it is difficult to perform a robust comparison of the fraction of actively star-forming galaxies and its relation to the AGN properties. This is, in part, due to the different selection criteria of the samples, the subjective definition of the various sub-groups of radio galaxies, and the lack of classification into the HEG and LEG classes for many objects studied in the literature.
Similarly, an object-by-object comparison of the level of AGN and nebular continuum is not conclusive. There is a strong band mismatch between our UV data and the B band, where the contamination estimates are usually made. Furthermore, the ground-based spectroscopy provides information that can be matched reasonably only for our central aperture, and not for all galaxies. In many cases we also excluded the central regions, where AGN contamination is probably stronger, which are instead included in the ground-based data. Nonetheless, the levels of nebular continuum contamination from spectroscopic analysis are comparable to our photometric estimates and is tipically less 10% (see Table 3). Finally, we note that, quite reassuringly, the two independent approaches converge to the same result for all blue 7 objects in common.
We conclude the discussion with a further comparison with previous studies of the NUV-r colors derived from the analysis of GALEX and SDSS images of early-type galaxies.
Schawinski et al. (2006) found that the fraction of RSF galaxies decreases with increasing stellar velocity dispersion. They explained this trend to be an AGN-feedback effect powered by supermassive black holes that halts star formation in the most massive galaxies. A similar effect is observed for our 3CR sample (see Fig. 11, right panel), which appear to show a connection between the stellar velocity dispersion and NUV-r color since the bluest objects have preferentially low stellar velocity dispersion ( 250 km/s), while the red galaxies cover the entire range of . However, a closer inspection shows that 4 of the galaxies with the highest values of are cD galaxies located at the center of clusters, while one (namely 3C 270) is the dominant member of a rich group. Apparently, the zone of avoidance (there are no blue galaxies at large ) is mostly driven by an environmental effect rather than a different level of AGN feedback, and a blue NUV-r color is a manifestation of a recent merger. A quantitative comparison, however, is not straightforward due to the relatively small size of our sample and the cross-calibration uncertainties, and would require the selection of quiescent galaxies only in a rich environment.
The study of Kauffmann et al. (2006) was instead based on a volume-limited sample of massive bulge-dominated galaxies, which also included AGN. Their GALEX-SDSS color profiles demonstrated that the UV excess light is almost always associated with an extended disk for galaxies with young bulges and strongly accreting black holes. They suggested that the presence of an extended gas structure is a necessary condition for AGN activity. Unfortunately, the small field-of-view of the STIS images used in our study does not allow us to investigate directly whether low surface brightness UV disks are associated with our radio-galaxies. Furthermore, the Kauffmann et al. (2006) sample cannot be used as a reliable reference for our 3CR sources, since it is dominated by galaxies of lower and contains mostly radio-quiet AGN.
5 SUMMARY AND CONCLUSIONS
We have analyzed images of 3CR radio galaxies for which both optical and UV HST images are available. The sample is composed of 31 radio-galaxies, all but one with z 0.1, representing 60 % of all 3CR sources below this redshift limit. We have excluded six objects, four are very highly nucleated and two with data of too low signal-to-noise ratio, and have 25 remaining objects. To perform a rigorous comparison with previous studies based on GALEX (NUV band) and SDSS (r band) observations, we derived a cross-calibration between GALEX, SDSS, and HST colors. We conservatively estimated that the error associated with this procedure was 0.2 mag.
On the basis of the integrated colors and UV morphology, the galaxies of the sample can be divided into 3 main categories: (1) the quiescent red galaxies (14 objects) have “red” colors, with only diffuse UV emission, tracing the optical light; (2) the “blue” UV-clumpy galaxies (7 objects) show a clumpy UV morphology (extended over 5-20 kpc); (3) the UV-disky galaxies (4 objects) have UV emission that is cospatial with their circum-nuclear (on a scale of 0.5-1 kpc) dusty disks.
To recognize the presence of recent star formation, it is necessary to account for other sources of UV emission. We estimated the level of UV contamination from emission lines and nebular continuum. In UV-disky galaxies, we found that UV emission lines contributed 50 - 80 % of the total UV flux within the region coincident with the dusty disks, causing the observed blue NUV-r color. For the 7 UV-clumpy galaxies, the emission line or nebular continuum contamination were both negligible. There was a spatial association between UV light and radio-axis only in one galaxy, which is a possible sign of contamination from scattered nuclear light. Summarizing, we confirm the presence of a young stellar population in at least 6 of the 7 UV-clumpy galaxies, in full agreement (on an object-by-object comparison) with results obtained for ground-based optical spectroscopy.
The NUV-r color is not simply related to the radio power since, while the bluest galaxies have all relatively large values of P178MHz, at the high end of radio luminosities we found many of the reddest galaxies. Concerning the FR type, we found no blue galaxy among the FR I sources, but among the FR II (or transiction FRI/II) galaxies there was an almost equal number of “blue” and “red” galaxies. The clearer association between galaxy color and AGN type is related to the optical spectroscopic classification into HEG and LEG: all six HEG are blue, while there is only 1 blue LEG out of 19 including all FR I into this class. The fraction of star forming HEG is far in excess of that found by Schawinski et al. (2006) for their sample of quiescent galaxies, while in LEG there appear to be even less star-forming galaxies than in quiescent galaxies. These results can be summarized as follows:
-
1.
While all HEG have a blue UV-r color, the opposite is true for LEG, with only one exception;
-
2.
UV, optical, and dust morphology of HEG are highly chaotic and correspond to unsettled morphologies. In LEG, the UV emission is typically diffuse and traces the optical light (leaving aside the UV-disky galaxies contaminated by line emission), while dust (when present) is mostly arranged in small circum-nuclear disk structures;
-
3.
HEG have a higher dust content;
-
4.
HEG have higher nuclear luminosity.
All of these findings can be explained if for HEG we are seeing the effects of a recent, major, “wet” merger. The fresh input of gas and dust causes both the higher star formation rate and stronger nuclear activity.
The most favorable situation for the occurrence of a “wet” merger is in groups of galaxies. This can explain the different environment between HEG, usually located in groups, and LEG, more often found in clusters of galaxies.
Conversely, in LEG we did not find evidence for recent star formation (with only one exception). A quantitative comparison with the star-formation fraction of quiescent galaxies is not straightforward due to the relatively small size of our sample and the cross-calibration uncertainties. However, we note that the substantial tail of blue objects found in inactive early-type galaxies is apparently not present for our objects, and this strongly disfavours the possibility of enhanced star formation in LEG hosts.
It appears that there is no clear connection between the recent star formation and the presence of low excitation AGN. This is in agreement with the idea that in LEG the hot interstellar medium is able to substain the AGN activity via quasi-spherical accretion. This process does not require an external cold gas supply that might become detectable in a star formation event.
The results presented here demonstrate the potential of these studies for investigating the triggering mechanism of nuclear activity and star formation in radio galaxies, a method that can be adopted also for other classes of AGN. However, this approach can not provide a quantitative estimate of the star formation history, an essential ingredient in the study of the coupling between the growth of galaxies and SMBH. This crucial information can only be derived by complementing the existing UV images with further data, e.g. optical and UV spectra, that can be used to constraints the age of the recently formed stellar population.
Acknowledgements.
We would like to thank the anonymous referee, Clive Tadhunter, and Marco Chiaberge for their very useful comments and suggestions. The authors acknowledge partial financial support by PRIN - INAF 2006 grant.References
- Allen et al. (2002) Allen, M. G., Sparks, W. B., Koekemoer, A., et al. 2002, ApJS, 139, 411
- Allen et al. (2006) Allen, S. W., Dunn, R. J. H., Fabian, A. C., Taylor, G. B., & Reynolds, C. S. 2006, MNRAS, 372, 21
- Aretxaga et al. (2001) Aretxaga, I., Terlevich, E., Terlevich, R. J., Cotter, G., & Díaz, Á. I. 2001, MNRAS, 325, 636
- Balmaverde et al. (2008) Balmaverde, B., Baldi, R. D., & Capetti, A. 2008, A&A, 486, 119
- Barnes & Hernquist (1996) Barnes, J. E. & Hernquist, L. 1996, ApJ, 471, 115
- Barnes & Hernquist (1991) Barnes, J. E. & Hernquist, L. E. 1991, ApJ, 370, L65
- Baum et al. (1992) Baum, S. A., Heckman, T. M., & van Breugel, W. 1992, ApJ, 389, 208
- Brotherton et al. (1999) Brotherton, M. S., van Breugel, W., Stanford, S. A., et al. 1999, ApJ, 520, L87
- Bruzual & Charlot (2003) Bruzual, G. & Charlot, S. 2003, MNRAS, 344, 1000
- Burstein et al. (1988) Burstein, D., Bertola, F., Buson, L. M., Faber, S. M., & Lauer, T. R. 1988, ApJ, 328, 440
- Buttiglione et al. (2008) Buttiglione, S., Capetti, A., Baldi, R., et al. 2008, A&A, submitted
- Canalizo & Stockton (2001) Canalizo, G. & Stockton, A. 2001, ApJ, 555, 719
- Capetti et al. (1999) Capetti, A., Axon, D. J., Macchetto, F. D., Marconi, A., & Winge, C. 1999, ApJ, 516, 187
- Cardelli et al. (1989) Cardelli, J. A., Clayton, G. C., & Mathis, J. S. 1989, ApJ, 345, 245
- Chiaberge et al. (1999) Chiaberge, M., Capetti, A., & Celotti, A. 1999, A&A, 349, 77
- Chiaberge et al. (2000) Chiaberge, M., Capetti, A., & Celotti, A. 2000, A&A, 355, 873
- Chiaberge et al. (2002) Chiaberge, M., Capetti, A., & Celotti, A. 2002, A&A, 394, 791
- Code & Welch (1979) Code, A. D. & Welch, G. A. 1979, ApJ, 228, 95
- Colina & de Juan (1995) Colina, L. & de Juan, L. 1995, ApJ, 448, 548
- Dasyra et al. (2007) Dasyra, K. M., Tacconi, L. J., Davies, R. I., et al. 2007, ApJ, 657, 102
- de Koff et al. (1996) de Koff, S., Baum, S. A., Sparks, W. B., et al. 1996, ApJS, 107, 621
- de Koff et al. (2000) de Koff, S., Best, P., Baum, S. A., et al. 2000, ApJS, 129, 33
- Di Matteo et al. (2005) Di Matteo, T., Springel, V., & Hernquist, L. 2005, Nature, 433, 604
- Djorgovski & Davis (1987) Djorgovski, S. & Davis, M. 1987, ApJ, 313, 59
- Donzelli et al. (2007) Donzelli, C. J., Chiaberge, M., Macchetto, F. D., et al. 2007, ApJ, 667, 780
- Dopita et al. (1997) Dopita, M. A., Koratkar, A. P., Allen, M. G., et al. 1997, ApJ, 490, 202
- Dressler et al. (1987) Dressler, A., Lynden-Bell, D., Burstein, D., et al. 1987, ApJ, 313, 42
- Emonts et al. (2006) Emonts, B. H. C., Morganti, R., Tadhunter, C. N., et al. 2006, A&A, 454, 125
- Fanaroff & Riley (1974) Fanaroff, B. L. & Riley, J. M. 1974, MNRAS, 167, 31P
- Ferland & Osterbrock (1986) Ferland, G. J. & Osterbrock, D. E. 1986, ApJ, 300, 658
- Ferrarese & Merritt (2000) Ferrarese, L. & Merritt, D. 2000, ApJ, 539, L9
- Gebhardt et al. (2000) Gebhardt, K., Bender, R., Bower, G., et al. 2000, ApJ, 539, L13
- González Delgado et al. (1998) González Delgado, R. M., Heckman, T., Leitherer, C., et al. 1998, ApJ, 505, 174
- Graham & Driver (2007) Graham, A. W. & Driver, S. P. 2007, ApJ, 655, 77
- Graham et al. (2001) Graham, A. W., Erwin, P., Caon, N., & Trujillo, I. 2001, ApJ, 563, L11
- Häring & Rix (2004) Häring, N. & Rix, H.-W. 2004, ApJ, 604, L89
- Heckman et al. (1997) Heckman, T. M., Gonzalez-Delgado, R., Leitherer, C., et al. 1997, ApJ, 482, 114
- Heckman et al. (1986) Heckman, T. M., Smith, E. P., Baum, S. A., et al. 1986, ApJ, 311, 526
- Holt et al. (2007) Holt, J., Tadhunter, C. N., González Delgado, R. M., et al. 2007, MNRAS, 381, 611
- Hopkins et al. (2006) Hopkins, P. F., Hernquist, L., Cox, T. J., et al. 2006, ApJS, 163, 1
- Hopkins et al. (2007a) Hopkins, P. F., Hernquist, L., Cox, T. J., & Keres, D. 2007a, ArXiv e-prints, 706
- Hopkins et al. (2007b) Hopkins, P. F., Hernquist, L., Cox, T. J., Robertson, B., & Krause, E. 2007b, ArXiv Astrophysics e-prints
- Hutchings et al. (2003) Hutchings, J. B., Maddox, N., Cutri, R. M., & Nelson, B. O. 2003, AJ, 126, 63
- Jackson & Rawlings (1997) Jackson, N. & Rawlings, S. 1997, MNRAS, 286, 241
- Jahnke et al. (2004) Jahnke, K., Kuhlbrodt, B., & Wisotzki, L. 2004, MNRAS, 352, 399
- Jogee (2006) Jogee, S. 2006, in Lecture Notes in Physics, Berlin Springer Verlag, Vol. 693, Physics of Active Galactic Nuclei at all Scales, ed. D. Alloin, 143–+
- Kauffmann & Haehnelt (2000) Kauffmann, G. & Haehnelt, M. 2000, MNRAS, 311, 576
- Kauffmann et al. (2006) Kauffmann, G., Heckman, T. M., Budavari, T., et al. 2006, ArXiv Astrophysics e-prints
- Kauffmann et al. (2003) Kauffmann, G., Heckman, T. M., Tremonti, C., et al. 2003, MNRAS, 346, 1055
- Kellermann et al. (1969) Kellermann, K. I., Pauliny-Toth, I. I. K., & Williams, P. J. S. 1969, ApJ, 157, 1
- Kewley et al. (2006) Kewley, L. J., Groves, B., Kauffmann, G., & Heckman, T. 2006, MNRAS, 372, 961
- Kormendy & Gebhardt (2001) Kormendy, J. & Gebhardt, K. 2001, in American Institute of Physics Conference Series, Vol. 586, 20th Texas Symposium on relativistic astrophysics, ed. J. C. Wheeler & H. Martel, 363–+
- Kormendy & Richstone (1995) Kormendy, J. & Richstone, D. 1995, ARA&A, 33, 581
- Laing et al. (1994) Laing, R. A., Jenkins, C. R., Wall, J. V., & Unger, S. W. 1994, in The First Stromlo Symposium: The Physics of Active Galaxies. ASP Conference Series, Vol. 54, 1994, G.V. Bicknell, M.A. Dopita, and P.J. Quinn, Eds., p.201, 201–+
- Lee et al. (2005) Lee, Y.-W., Ree, C. H., Rich, R. M., et al. 2005, ApJ, 619, L103
- Letawe et al. (2007) Letawe, G., Magain, P., Courbin, F., et al. 2007, MNRAS, 378, 83
- Lilly & Longair (1984) Lilly, S. J. & Longair, M. S. 1984, MNRAS, 211, 833
- Magorrian et al. (1998) Magorrian, J., Tremaine, S., Richstone, D., et al. 1998, AJ, 115, 2285
- Marconi & Hunt (2003) Marconi, A. & Hunt, L. K. 2003, ApJ, 589, L21
- Martel et al. (1999) Martel, A. R., Baum, S. A., Sparks, W. B., et al. 1999, ApJS, 122, 81
- Martel et al. (2000) Martel, A. R., Turner, N. J., Sparks, W. B., & Baum, S. A. 2000, ApJS, 130, 267
- McLure & Dunlop (2002) McLure, R. J. & Dunlop, J. S. 2002, MNRAS, 331, 795
- Melnick et al. (1997) Melnick, J., Gopal-Krishna, & Terlevich, R. 1997, A&A, 318, 337
- Mihos & Hernquist (1994) Mihos, J. C. & Hernquist, L. 1994, ApJ, 431, L9
- Mihos & Hernquist (1996) Mihos, J. C. & Hernquist, L. 1996, ApJ, 464, 641
- Mulchaey et al. (1994) Mulchaey, J. S., Koratkar, A., Ward, M. J., et al. 1994, ApJ, 436, 586
- Mulchaey et al. (1996) Mulchaey, J. S., Wilson, A. S., & Tsvetanov, Z. 1996, ApJS, 102, 309
- Müller et al. (2004) Müller, S. A. H., Haas, M., Siebenmorgen, R., et al. 2004, A&A, 426, L29
- O’Dea et al. (2001) O’Dea, C. P., Koekemoer, A. M., Baum, S. A., et al. 2001, AJ, 121, 1915
- Osterbrock (1989) Osterbrock, D. E. 1989, Astrophysics of Gaseous Nebulae and Active Galactic Nuclei (Mill Valley: Univ. Sci. Books)
- Proffitt (2006) Proffitt, C. R. 2006, in The 2005 HST Calibration Workshop: Hubble After the Transition to Two-Gyro Mode, ed. A. M. Koekemoer, P. Goudfrooij, & L. L. Dressel, 234–+
- Raimann et al. (2005) Raimann, D., Storchi-Bergmann, T., Quintana, H., Hunstead, R., & Wisotzki, L. 2005, MNRAS, 364, 1239
- Richstone et al. (1998) Richstone, D., Ajhar, E. A., Bender, R., et al. 1998, Nature, 395, A14+
- Sánchez et al. (2004) Sánchez, S. F., Jahnke, K., Wisotzki, L., et al. 2004, ApJ, 614, 586
- Sanders & Mirabel (1996) Sanders, D. B. & Mirabel, I. F. 1996, ARA&A, 34, 749
- Sanders et al. (1988a) Sanders, D. B., Soifer, B. T., Elias, J. H., et al. 1988a, ApJ, 325, 74
- Sanders et al. (1988b) Sanders, D. B., Soifer, B. T., Elias, J. H., Neugebauer, G., & Matthews, K. 1988b, ApJ, 328, L35
- Schawinski et al. (2006) Schawinski, K., Khochfar, S., Kaviraj, S., et al. 2006, Nature, 442, 888
- Schweizer (1998) Schweizer, F. 1998, in Saas-Fee Advanced Course 26: Galaxies: Interactions and Induced Star Formation, ed. R. C. Kennicutt, Jr., F. Schweizer, J. E. Barnes, D. Friedli, L. Martinet, & D. Pfenniger, 105–+
- Silk (1977) Silk, J. 1977, ApJ, 211, 638
- Smith & Heckman (1989) Smith, E. P. & Heckman, T. M. 1989, ApJ, 341, 658
- Smith et al. (1990) Smith, E. P., Heckman, T. M., & Illingworth, G. D. 1990, ApJ, 356, 399
- Somerville et al. (2000) Somerville, R. S., Lemson, G., Kolatt, T. S., & Dekel, A. 2000, MNRAS, 316, 479
- Springel et al. (2005) Springel, V., Di Matteo, T., & Hernquist, L. 2005, MNRAS, 361, 776
- Tadhunter et al. (2002) Tadhunter, C., Dickson, R., Morganti, R., et al. 2002, MNRAS, 330, 977
- Tadhunter et al. (2005) Tadhunter, C., Robinson, T. G., González Delgado, R. M., Wills, K., & Morganti, R. 2005, MNRAS, 356, 480
- Tadhunter et al. (1996) Tadhunter, C. N., Dickson, R. C., & Shaw, M. A. 1996, MNRAS, 281, 591
- Tadhunter et al. (1989) Tadhunter, C. N., Fosbury, R. A. E., & Quinn, P. J. 1989, MNRAS, 240, 225
- Temi et al. (2007) Temi, P., Brighenti, F., & Mathews, W. G. 2007, ApJ, 660, 1215
- Tremaine et al. (2002) Tremaine, S., Gebhardt, K., Bender, R., et al. 2002, ApJ, 574, 740
- Tremblay et al. (2007) Tremblay, G. R., Chiaberge, M., Donzelli, C. J., et al. 2007, ArXiv e-prints, 705
- Vanden Berk et al. (2006) Vanden Berk, D. E., Shen, J., Yip, C.-W., et al. 2006, AJ, 131, 84
- Wills et al. (2004) Wills, K. A., Morganti, R., Tadhunter, C. N., Robinson, T. G., & Villar-Martin, M. 2004, MNRAS, 347, 771
- Wills et al. (2002) Wills, K. A., Tadhunter, C. N., Robinson, T. G., & Morganti, R. 2002, MNRAS, 333, 211
- Zakamska et al. (2006) Zakamska, N. L., Strauss, M. A., Krolik, J. H., et al. 2006, AJ, 132, 1496
- Zirbel (1997) Zirbel, E. L. 1997, ApJ, 476, 489