Yu–Peng Chen et alIGR J17098-3628 Observed by INTEGRAL and RXTE/ASM
outburst–X-ray:individual: IGR J17098-3628
INTEGRAL and RXTE/ASM Observations on IGR J17098-3628
Abstract
To probe further the possible nature of the unidentified source IGR J17098-3628, we have carried out a detailed analysis of its long-term time variability as monitored by RXTE/ASM, and of its hard X-ray properties as observed by INTEGRAL. INTEGRAL has monitored this sky region over years and significantly detected IGR J17098-3628 only when the source was in this dubbed active state. In particular, at 20 keV, IBIS/ISGRI caught an outburst in March 2005, lasting for 5 days with detection significance of 73 (20-40 keV) and with the emission at 200 keV. The ASM observations reveal that the soft X-ray lightcurve shows a similar outburst to that detected by INTEGRAL, however the peak of the soft X-ray lightcurve either lags, or is preceded by, the hard X-ray (20 keV) outburst by 2 days. This resembles the behavior of X-ray novae like XN 1124-683, hence it further suggests a LMXB nature for IGR J17098-3628. While the quality of the ASM data prevents us from drawing any definite conclusions, these discoveries are important clues that, coupled with future observations, will help to resolve the as yet unknown nature of IGR J17098-3628.
1 Introduction
INTEGRAL has detected roughly 500 sources at energies 20 keV (Bodaghee et al., 2007). Among them, X-ray binary systems were identified for 32% of the times, and another 26% remained unidentified. As one of the unidentified sources, IGR J17098-3628 was discovered (Grebenev et al., 2005a) at the end of March 2005 by INTEGRAL/IBIS during the private Open Program observation dedicated to the deep view to the Galactic center. The source was located at R.A.(2000) , Dec. , with an error box of at 90 confidence. The source got a peak flux at 60 and 95 mCrab for 18-45 and 45-80 keV, respectively. The 20-60 keV flux evolved from mCrab at 2005 March 26 00:00, to mCrabs at April 3 23:30 (UTC) (Mowlavi et al., 2005). The preliminary spectral analysis (Grebenev et al., 2005b) showed the source spectrum became quite soft along this evolution. Following INTEGRAL, IGR J17098-3628 was observed by RXTE on March 29 of 2005, and was detected at 80 mCrab in the 3–20 keV band, with a hard power-law tail of a spectral index 2.5. Then the source was assumed a BHC and X-ray Nova (Grebenev et al. 2007). The column density was found to be less than 11022 atoms cm2.
Later on, Swift observed this source on May 1 of 2005, and refined its location to R.A. (2000) , Dec. , with 90 confidence, and an uncertain radius of 5 arcseconds (Kennea et al., 2005). This made the search possible for the potential counterparts in optical and infrared bands. From the 2MASS ALL-SKY Catalog a possible counterpart was found, J17094612-3627573 (Kong, 2005). However, the most recent optical and infrared observations, made with the 6.5m Magellan-Baade telescope, revealed that 2MASS J17094612-3627573 is in fact composed off several sources (Steeghs et al., 2005). Furthermore, Very Large Array (VLA) observations of IGR J17098-3628 were made on March 31, April 5, and May 4, 2005 at 4.86 GHz (Rupen et al., 2005), which led to the discovery of a radio transient at 0.8 arcseconds from the Swift XRT position, and hence regarded as the possible radio counterpart. Finally on July 9, Swift/XRT observed IGR J17098-3628 again and found that the spectrum was fitted by an absorbed disk blackbody model. The column density obtained was (0.890.021022 atoms cm-2 (Kennea et al., 2007).
In this paper, we report the analysis of all available observations on IGR J17098-3628 carried out by IBIS/ISGRI and JEMX onboard INTEGRAL, and the All Sky Monitor (ASM) onboard RXTE. This allows us to trace the source behavior in X-rays back to 1996 with ASM and back to 2002 with INTEGRAL. We put the outburst in 2005 in this context.
2 Time variability monitored by ASM
ASM is one of the three detectors onboard the RXTE satellite (Gruber et al., 1996; Swank, 1994), which has been used to track the long-term behavior of the source in the energy band 1.5-12 keV since February 1996. The target source was usually observed several times per day, within the so-called dwells, of duration 96 seconds each. The extracted source light curves are presented for the energy bands of 1.5–3, 3–5, 5–12, and 1.5–12 keV, respectively.
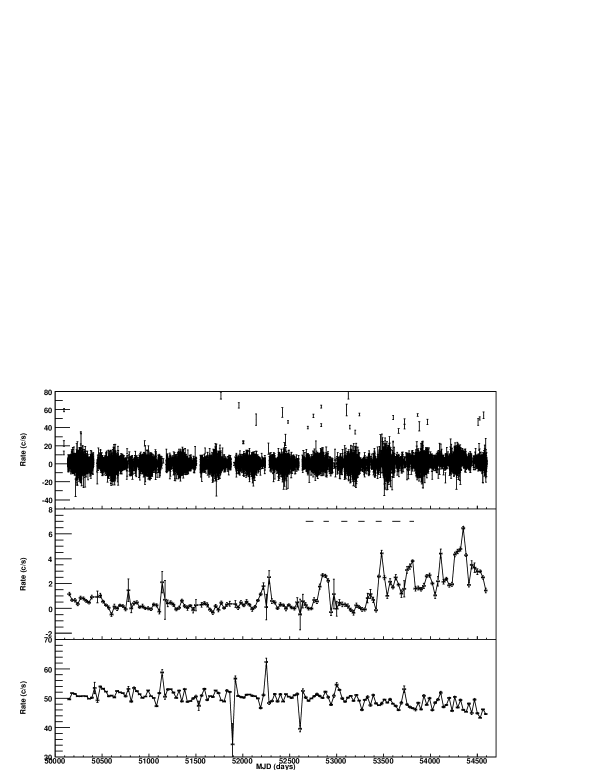
IGR J17098-3628 has been monitored by ASM as one of the most active sources ever seen since 2002. As shown in Figure 1, the 1.5–12 keV lightcurves, retrieved in a time period from January 1996 to May 2008, show the variability, where each bin represents a dwell, or –in the middle panel– the average over month timescale. Many individual bursts-like events existing in the dwell lightcurve can be spotted, and the flux maxima can sometimes reach 65.5 cts/s (the dwell at MJD=51958.219410), corresponding to 873 mCrab in the 1.5-12 keV band. We have made communication with the ASM team for consulting on such feature. It turns out that the source IGR J17098-3628 is only 1 degree away from GX349+2, a very strong X-ray source. The angular resolution of each of the ASM cameras is much better in one coordinate (3) than in the other coordinate (15). This is the kind of problem that is (understandably) difficult for the ASM analysis system to properly handle; similar problems have arisen with other sources. But in general, GX349+2 is stable in the 1.5-12 keV band observed by ASM (see Figure 1, the bottom panel). In short, the analysis software has incorrectly attributed the flux from GX349+2 to IGR J17098-3628 only on those relatively few occasions. Actually, the big uncertainty in this lightcurve is the contamination from the neighboring source, IGR J17091-3624, located (only away) too close to IGR J17098-3628 to be resolved by ASM. As the result, the burst events on monthly timescale as shown in the middle panel of Fig.1 may sometimes attribute to IGR J17091-3624. Fortunately, this problem can be well solved via INTEGRAL’s mapping this region with either ISGRI or JEMX. In the monthly lightcurve there are several well established outbursts with a duration of several months. The first one occurs around MJD 52800 (June, 2003), with averaged peak flux reaching 40 mCrab level. We will see later that, this outburst came from the IGR J17091-3624 (Grebenev et al. 2007), and the ones thereafter observed by INTEGRAL were from IGR J17098-3628. IGR J17091-3624 seems to be in quiet most of time since MJD 52800 (Grebenev et al. 2007). A sequence of outbursts have happened since MJD 53455 (March, 2005), and the 1.5–12 keV flux has kept staying at the flux level of 50 mCrab over years. These results, accompanying with the INTEGRAl results which will be shown later on, suggest IGR J17098-3628 is in active phase within the last several years.
3 Hard X-ray properties revealed by INTEGRAL
3.1 Observations and data analysis
INTEGRAL is an ESA scientific mission (Winkler et al. 2003) dedicated to spectroscopy (500; SPI see Vedrenne et al. 2003) and imaging (angular resolution: 12 FWHM, source location accuracy: 1–3; IBIS, see Ubertini et al. 2003) of celestial -ray sources in the energy range 15 keV to 10 MeV, with simultaneous monitoring in the X-ray (3–35 keV, angular resolution: 3; JEMX, see Lund et al. 2003) and optical (V-band, 550 nm; OMC, see Mas-Hesse et al. 2003) energy ranges. All the instruments onboard INTEGRAL, except the OMC, work with coded masks. The observational data from the detectors IBIS/ISGRI (15-200 keV) and JEMX have been adopted in our analysis of IGR J17098-3628.
The available INTEGRAL observations when IGR J17098-3628 falls into the Fully Coded Field of View (FCFoV) of ISGRI comprise about 2400 science windows (scw’s, typically 2000 seconds each), adding to a total exposure of 3700 ks. Most of these observations are carried out in a 5x5 dithering mode. The data are subdivided into 9 groups according to the sequence in observational time. The groups T5, T6, and T7 represent the observations made one month prior to the hard X-ray outburst, 6 days in 2005 March 23-28 –during the outburst, and one month after the outburst, respectively (see Table 1 for a summary of the individual observational groups).
The analysis of JEMX and ISGRI data is performed by using the INTEGRAL Offline Scientific Analysis (OSA) software, version 6.0. All the sources within the FoV that are brighter than or comparable to IGR J17098-3628 are taken into account in extracting the source spectrum. An additional 2% systematic error are added to the spectra because of calibration uncertainties. The ISGRI spectrum was normalized to the JEMX spectrum by a factor derived from the fit. The spectra are fitted with XSPEC v12.3.1 and the model parameters are estimated with 90 confidence level.
3.2 INTEGRAL results
3.2.1 Sky maps
We have looked into the skymaps of both ISGRI and JEMX to see for each of the 9 time zones which source was on active. The detection significances from ISGRI in the 20-40 keV band are summarised in Table 1. We find that IGR J17091-3624 was in active phase within 2003 April and 2004 April (T1–T3), and IGR J17098-3628 took the role since 2005 March in T6. After 2004 August (in T4), IGR J17091-3624 was not detectable by INTEGRAL at the X-rays.
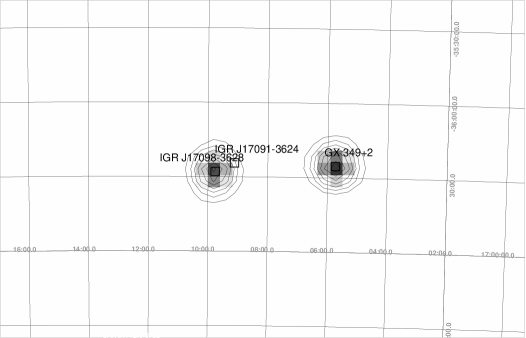
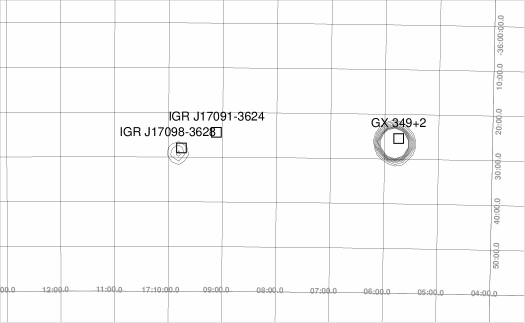
IGR J17098-3628 was detected by ISGRI at energies 20 keV during March 24-28, 2005 when the source had an outburst in hard X-rays. The detection significances were 73.4 in the 20–40 keV band (for the mosaic image seen in Figure 2), 38 in the 40–60 keV band, 21 in the 60–100 keV band, and 8 in the 100–200 keV band. The source was still visible during its decay in the following one month (T7), with the detections significances dropping to 16.9 in 20–40 keV. For all other INTEGRAL observations, only marginal detections or upper limits were obtained at energies 20 keV, e.g., for the time period T9, the source was detected only in 20-40 keV with significance 8 level (see Table 1). Since JEMX overlaps with ASM in most of its working energies, the detections at 15 keV follow in general the same trend indicated by the ASM light curves. Figure 3 shows the most significant JEMX detection of the source in March 31-April 21, 2005, which gives 22 in the 3–6 keV band.
3.2.2 Light curves
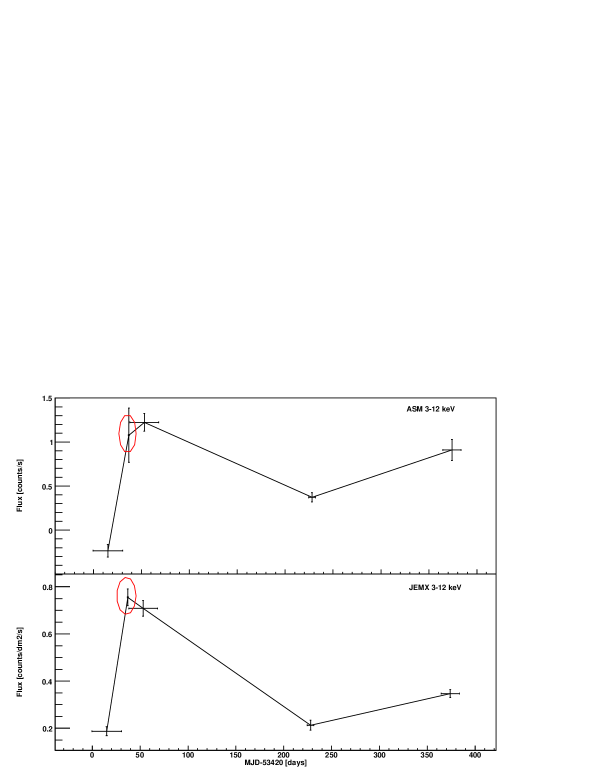
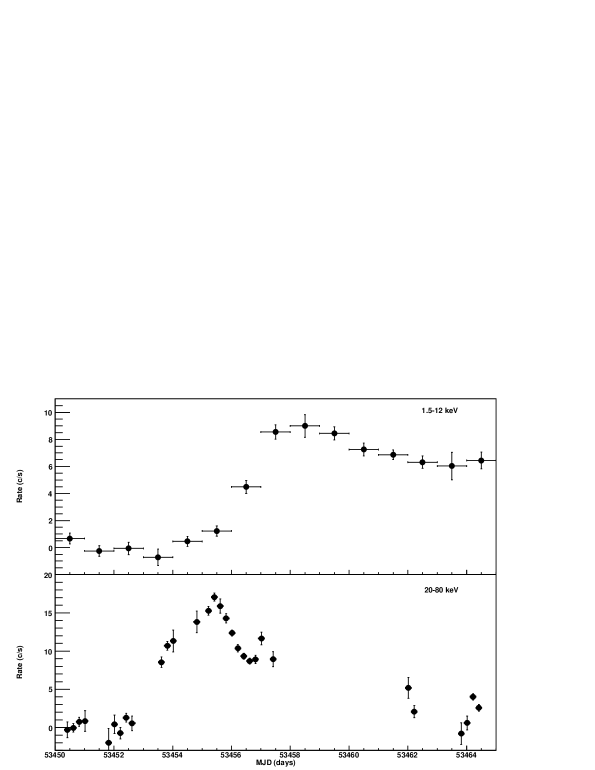
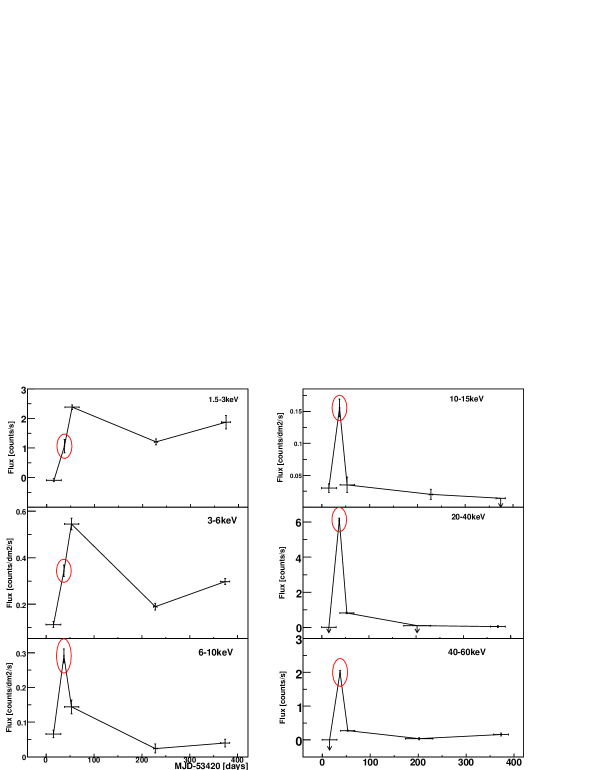
We use version 6.0 of the INTEGRAL Offline Scientific Analysis (OSA) software to construct the 20 keV ISGRI X-ray lightcurve of this outburst and compare it to the 1.5-12 keV ASM lightcurve from the same period. Unfortunately IGR J17098-3628 was either prohibitively faint or out of the FoV for JEMX for most of the INTEGRAL observation, and the remaining data are contaminated by a strong source in the JEMX field-of-view (this is a known issue for JEMX data extraction - INTEGRAL Help Desk Priv. Comm.) to prevent from producing the proper lightcurve through running the pipeline. We therefore generate the JEMX lightcurves via reading out the flux at the source position from the mosaic map. A comparison of the JEMX and ASM lightcurves at 3-12 keV is shown in Figure 4, where the trends are consistent with each other. We find that the soft X-ray lightcurve shows a similar outburst to that detected by INTEGRAL, however the peak of the soft X-ray lightcurve lags the hard X-rays by 2 days (Figure 5). We note, however, that no hard X-ray data cover the peak outburst observed in the ASM data. If there is a hard X-ray peak that coincides with the soft X-ray peak, then, since there is no evidence for two peaks in the ASM data, the earlier hard X-ray peak may well be interpreted a precursor event to a wider band concurrent X-ray outburst rather than evidence for a lag between the hard and soft X-ray bands. Figure 6 shows a comparison of the flux variability in the time zones T5–T9, as obtained with ASM in 1.5–3 keV, JEMX in 3–6, 6–10, 10–15 keV, and ISGRI in 20–40 keV, and 40–60 keV bands.
3.2.3 Spectra
Since the lightcurves show quite different behavior between the higher and lower energy bands, it would be interesting to investigate the spectrum at the different periods of the outburst, i.e., the time evolution of the spectrum along the outburst, although the overall spectra have been presented in Grebenev et al (2007) from using ISGRI data of the outburst, supplemented by the available PCA/RXTE data. For investigating the spectrum of the source, the time zone where the outburst was recorded by INTEGRAL (T6) was subdivided into three smaller time periods according to observations: March 23st 03:13 to 25st 02:35(the rising phase), 25st 23:03 to 27st 00:51 ( the peaking phase) and 27st 00:53 to 28st 11:15 (UTC) (the decaying phase). Due to the relatively small FoV of the JEMX, its data are only available during the decaying phase, which is then combined with the corresponding ISGRI data for a broader spectral fitting. Firstly we have tried different fitting models in the 20–200 keV band only using the ISGRI data: simple power-law, power-law with cutoff, and broken power-law shapes. The goodness of each trial is shown in Table 2. We find that the relatively poor statistics of the data from the rising of the hard X-ray outburst prevents from discriminating the models; the power-law with cutoff model might be the best choice when the outburst reached the maximum; and the power-law model shows a good fit to the data from the decay of the outburst onwards. From the fit of a simple power law model, the spectral index changes from 1.7 when rising to roughly 2.6 when decaying. We tried as well a disk blackbody model for the decaying phase (the broadband 5-200 keV spectrum), and found the reduced (1.36) gets worse than that from the best-fit model of a broken power law (see Figure 7). The best-fit parameters of the proper model are then presented in Tables 3, 4, and 5, for the three phases, respectively. That the different episodes of the outburst have to be described by different models might suggest rather strong time evolution. By taking the distance of 10.5 kpc as estimated by Grebenev et al.(2007), the source had a luminosity of erg s-1 averaged over the whole outburst in the 20–200 keV. The luminosities in individual phase are erg s-1 (the rising), erg s-1 (the peaking) and erg s-1 (the decaying).
4 Discussion and summary
IGR J17098-3628 may have stepped into an active phase in the beginning of 2005. INTEGRAL detected a days-long outburst extending up to energies of 200 keV. A similar outburst is detected in the soft X-ray (1.5-12 keV) band, however the onset of the outburst lags the hard X-ray outburst by 2 days, in a fashion reminiscent of X-ray novae like XN 1124-683 (Chen et al., 1997). The spectral analysis of the initial stages of the outburst detected by INTEGRAL supports the association with X-ray novae (Grebenev et al. 2007), the cool disk temperature and small inner radius of the accretion disk both suggest that IGR J17098-3628 is a newly discovered black hole system. Current theoretical models of the formation of X-ray novae include the mass transfer instability (MTI) model (Hameury et al., 1986), the disk thermal instability (DTI) model (Cannizzo et al. 1982; Faulkner et al. 1983; Meyer & Meyer-Hofmeister 1984; Huang & Wheeler 1989; Mineshige & Wheeler 1989; Ichikawa et al. 1994) Unfortunately, the only way to discriminate between these models relies on detailed differences in the observed soft energy spectrum of the source and so the lack of any detailed X-ray spectra of the IGR J17098-3628 outburst in this energy band prevents us from drawing any conclusions on the X-ray nova mechanism for IGR J17098-3628. That the three episodes of the hard X-ray outburst observed by INTEGRAL have to be described by different models might suggest rather strong time evolution. i.e., the spectral index changed from 1.7 when rising to roughly 2.6 when decaying suggesting the cooling of the source.
Although the time variability of X-ray novae is not well understood theoretically, observations of a variety of X-ray novae not only show that the hard X-ray flux often rises and peaks earlier than the outburst in soft X-rays, but can also show precursor events at hard X-rays several days prior to the main outburst (Chen et al. 1997). While it is not possible to associate the outburst in IGR J17098-3628 with any particular X-ray nova mechanism spectrally, it is clear that the typical accretion scenario for the low mass X-ray binaries holding a black hole is not capable of reproducing the observed lag between the hard and soft X-ray outbursts. In this scenario, the soft X-rays are produced by the accretion disk, while the hard X-rays are produced by comptonization of soft seed photons in the inner part of the accretion disk (Di Salvo et al., 2004; Di Salvo, & Stella, 2002). Clearly, large changes in the hard X-ray flux can, at best, be coeval with large changes in the soft X-ray seed photons and cannot precede variations of the soft X-ray photons that the process of comptonization relies on to produce the hard X-ray tail. One potential mechanism that may reproduce the observed lag is for an instability in the disk to trigger the formation of a temporary jet, which produces hard X-rays via inverse comptonization, in advance of any change in the flux of soft X-rays from the disk.
A more straightforward scenario in understanding this different time behaviour between the hard and the soft X-rays may lie in the tie-up with the structure of the accretion flow. The precursor event can be explained as the transition from the ”hard” state to ”soft” state in the BHC system. The accretion time in the inner parts of the disk is much smaller than the duration of X-ray nova’s outburst therefore changes in the spectral state of these sources are connected with general changes in structure of the accretion flow rather than in changes in number of soft seed photons for Comptonization. Observations show that all BH systems have the hard Comptonized spectrum at low accretion rates and the soft DBB(disc blackbody) spectrum (with a possible weak hard tail) at high accretion rates. This may be connected with approaching of the inner radius of a cold accretion disk to the radius of marginally stable orbit when the accretion rate increases. The observed lag between outbursts in hard X-rays and soft X-ray may be directly connected with this observed dependence: the accretion rate is small at the initial stage of the outburst thus the spectrum is hard and the outburst is observed in hard X-rays, but later the accretion rate rises and the spectrum becomes soft thus the outburst is observed in soft X-rays.
Although no clear statement can be made regarding their nature, the discovery the lag/precursor event revealed by the concurrent RXTE ASM and INTEGRAL observations in 2005, is important piece of the IGR J17098-3628 puzzle that will help to resolve the as yet unknown nature of this perplexing source.
5 Acknowledgement
The authors are highly grateful to the anonymous referee for his/her many valuable comments that are great helpful to improve the paper. The authors would like to thank Prof. Cui Wei for his many valuable comments, especially regarding the details of the ASM data. This work was subsidised by the National Natural Science Foundation of China, and the CAS key Project KJCX2-YW-T03. J.-M. Wang would like to thank the Natural Science Foundation of China for support via NSFC-10325313, 10521001, 10733010, C.-M. Zhang would like to thank the Natural Science Foundation of China for support via NSFC-10773017, and N. J. Schurch would like to thank the Department for Innovation, Universities and Skills (UK) for support via a UK-China Fellowship for Excellence.
References
- Bodaghee et al. (2007) Bodaghee, A., Courvoisier, T. J.-L., Rodriguez, J., et al. 2007, A&A, 467, 585
- Cannizzo et al. (1982) Cannizzo, J.K., Ghosh, P., & Wheeler, J.C. 1982, ApJ, 260, L83
- Chen et al. (1997) Chen, W. , Shrader, C.R., & Mario L. 1997, ApJ, 491, 312
- Di Salvo et al. (2004) Di Salvo, T., Santangelo, A., & Segreto, A. 2004, NuPhS, 132, 446
- Di Salvo, & Stella (2002) Di Salvo, T., & Stella, L. 2002, to appear in the XXII Moriond Astrophysics Meeting ”The Gamma-Ray Universe” (Les Arcs, March 9-16, 2002), eds. A. Goldwurm, D. Neumann, and J. Tran Thanh Van, The Gioi Publishers (Vietnam), astro-ph/0207219
- Faulkner et al. (1983) Faulkner, J., Lin, D.N.C., & Papaloizou, J. 1983, MNRAS, 205, 359
- Grebenev et al. (2005a) Grebenev, S.A., Molkov, S.V., & Sunyaev R.A. 2005a, ATel, 444
- Grebenev et al. (2005b) Grebenev, S.A., Molkov, S.V., Revnivtsev, M.G., & Sunyaev, R.A. 2005b, ATel, 447
- Grebenev et al. (2007) Grebenev, S. A., Molcov, S. V., Revnivtsev, M.G., & Sunyaev, R.A. 2007, Proceedings of the 6th INTEGRAL Workshop ’The Obscured Universe’, ESA SP-622, page 373, astro-ph/07092313
- Gruber et al. (1996) Gruber, D.E., Blanco, P.R., Heindl, W.A., et al. 1996, A&AS, 120, 641
- Hameury et al. (1986) Hameury, J.M., King, A.R., & Lasota, J.-P. 1986, A&A, 162, 71
- Huang & Wheeler (1989) Huang, M., & Wheeler, J.C. 1989, ApJ, 343, 229
- Ichikawa et al. (1994) Ichikawa, S., Mineshige, S., & Kato, T. 1994, ApJ, 435, 748
- Kennea et al. (2005) Kennea, J.A., Burrows, D.N., Nousek, J.A., et al. 2005, ATel, 476
- Kennea et al. (2007) Kennea, J.A., Capitanio, F. 2007, ATel, 1140
- Kong (2005) Kong, A.K.H. 2005, ATel, 477
- Lund et al. (2003) Lund, N., Budtz-Jørgensen, C., Westergaard, N.J., et al. 2003, A&A, 411, L231
- Mas-Hesse et al. (2003) Mas-Hesse, J.M., Giménez, A., Culhane, J.L., et al. 2003, A&A, 411, L261
- Meyer & Meyer-Hofmeister (1984) Meyer, F., & Meyer-Hofmeister, E. 1984, A&A, 132, 143
- Mineshige & Wheeler (1989) Mineshige, S., & Wheeler, J.C. 1989, ApJ, 343, 241
- Mowlavi et al. (2005) Mowlavi, N., Kuulkers, E., Rodriguez, J., et al. 2005, ATel, 453
- Rupen et al. (2005) Rupen, M.P., Mioduszewski, A.J., & Dhawan, V. 2005, ATel, 490
- Steeghs et al. (2005) Steeghs, D., Torres, M.A.P., Jonker, P.G., et al. 2005, ATel, 478
- Swank (1994) Swank, J.H. 1994, AAS, 185.6701
- Ubertini et al. (2003) Ubertini, P., Lebrun, F., Di Cocco, G., et al. 2003, A&A, 411, L131
- Vedrenne et al. (2003) Vedrenne, G., Roques, J.-P., Schönfelder, V., et al. 2003, A&A, 411, L63
- Winkler et al. (2003) Winkler, C. Courvoisier, T. J.-L., Di Cocco, G., et al. 2003, A&A, 411, L1
| Label | Revolution | Start Date | End Date | Exposure (ks) | IGR J17091-3624 | IGR J17098-3628 |
| counts/s (significance) | counts/s (significance) | |||||
| T1 | 0037–0063 | 2003-02-01 | 2003-04-22 | 593 | 0.35(8.6) | - |
| T2 | 0100–0120 | 2003-08-09 | 2003-10-07 | 652 | 1.64(41.8) | - |
| T3 | 0164–0185 | 2004-02-16 | 2004-04-19 | 360 | 2.51(44.9) | - |
| T4 | 0224–0246 | 2004-08-15 | 2004-10-20 | 477 | - | - |
| T5 | 0286–0297 | 2005-02-15 | 2005-03-22 | 456 | - | - |
| T6 | 0298–0299 | 2005-03-23 | 2005-03-28 | 152 | - | 6.08(73.4) |
| T7 | 0300–0307 | 2005-04-02 | 2005-04-21 | 341 | - | 0.96(16.9) |
| T8 | 0345–0370 | 2005-08-10 | 2005-10-26 | 386 | - | - |
| T9 | 0406–0423 | 2006-02-09 | 2006-04-03 | 337 | - | 0.49(7.8) |
| Date | Pow law | Cutoff pow law | Broken pow law |
|---|---|---|---|
| (phase) | |||
| (/) | (/) | (/) | |
| 03-23 03:13..03-25 02:35 | |||
| (rising phase) | (0.71) | (0.78) | (0.88) |
| 03-25 23:03..03-27 00:51 | |||
| (peaking phase) | (1.49) | (0.95) | (1.60) |
| 03-27 00:53..03-28 11:15 | |||
| (decaying phase) | (0.86) | (0.72) | (0.93) |
| model | / | d.o.f | (20–200 keV) | ||
| at 1 keV | erg cm-2 s-1 | ||||
| powerlaw | 0.71 | 10 |
| model | / | d.o.f | (20-200 keV) | |||
| at 1 keV | keV | erg cm-2 s-1 | ||||
| cutoffpl | 0.95 | 27 |
| model | / | d.o.f | (5-200 keV) | ||||
| at 1 keV | keV | erg cm-2 s-1 | |||||
| bknpower | 1.07 | 133 |