Star formation rates in Lyman break galaxies: radio stacking of LBGs in the COSMOS field and the sub-Jy radio source population.
Abstract
We present an analysis of the radio properties of large samples of Lyman Break Galaxies (LBGs) at , 4, and 5 from the COSMOS field. The median stacking analysis yields a statistical detection of the LBGs (U-band drop-outs), with a 1.4 GHz flux density of Jy. The stacked emission is unresolved, with a size , or a physical size kpc. The total star formation rate implied by this radio luminosity is year-1, based on the radio-FIR correlation in low redshift star forming galaxies. The star formation rate derived from a similar analysis of the UV luminosities is 17 year-1, without any correction for UV dust attenuation. The simplest conclusion is that the dust attenuation factor is 1.8 at UV wavelengths. However, this factor is considerably smaller than the standard attenuation factor , normally assumed for LBGs. We discuss potential reasons for this discrepancy, including the possibility that the dust attenuation factor at is smaller than at lower redshifts. Conversely, the radio luminosity for a given star formation rate may be systematically lower at very high redshift. Two possible causes for a suppressed radio luminosity are: (i) increased inverse Compton cooling of the relativistic electron population due to scattering off the increasing CMB at high redshift, or (ii) cosmic ray diffusion from systematically smaller galaxies. The radio detections of individual sources are consistent with a radio-loud AGN fraction of 0.3%. One source is identified as a very dusty, extreme starburst galaxy (a ’submm galaxy’).
1 Introduction
The power of discovering high redshift galaxies via the broad-band drop-out technique, ie. Lyman Break galaxies (LBGs), is now well established (Steidel et al. 1999; 2000). Using this technique, over a thousand galaxies have now been detected at . Detailed studies show that these galaxies have stellar masses between 1010 and 1011 , and a (comoving) volume density at of Mpc-3 (Giavalisco 2002).
A number of issues are still being investigated for LBGs. One important issue is deriving the total star formation rate. Besides model parameters such as the IMF and star formation history, the dust correction in the UV remains under investigation. Steidel et al. (1999) originally estimated a typical UV dust attenuation factor of about 5, based on optical spectroscopy. Adelberger & Steidel (2000) applied a similar method to a larger sample of LBGs, as well as observations at other wavebands (radio, submm), and conclude: ”…the mean extinction at 1600 Å for LBGs, a factor of 6 in our best estimate, could lie between a factor 5 and a factor of 9.” More recently, Reddy & Steidel (2004) have derived the average dust correction factors for UV-selected galaxies at based on deep X-ray, radio, and optical spectroscopic studies of galaxies in the GOODS north field. They find that, for galaxies with total star formation rates year-1, the dust attenuation factor is between 4.4 and 5.1.
A second issue for LBGs is the AGN fraction. Shapley et al. (2003) found that of LBGs at z3 have optical emission line spectra that are consistent with AGN.
The Cosmic Evolution Survey (COSMOS), covering 2 □∘, is a comprehensive study of the evolution of galaxies, AGN, and dark matter as a function of their cosmic environment. The COSMOS field has state-of-the-art multiwavelength observations, ranging from the radio through the X-ray (Scoville et al. 2007; Capak et al. 2007). A major part of this study is to identify the largest samples of LBGs to date. In section 2 we describe the LBG samples from the COSMOS survey based on U, B, and V-band drop-out searches.
In this paper we consider the radio properties of these large samples of LBGs, similar to the study of Lyman- emitting galaxies by Carilli et al. (2007). Observations of the COSMOS field have been done at 1.5 resolution (FWHM) at 1.4 GHz with the Very Large Array (Schinnerer et al. 2007). We employ the new VLA image that has added integration time in the central (Schinnerer in prep.), giving an rms at the field center of Jy beam-1. In section 3.1 we search for radio counterparts to individual LBGs, while in section 3.2 we perform a stacking analysis to derive the statistical properties of the samples. In section 4 we discuss the implications these observations have on the questions of dust extinction and the AGN fraction in LBGs. We adopt a standard concordance cosmology.
2 A conservative COSMOS LBG sample
We have identified large samples of U,B, and V-band drop-out galaxies using the COSMOS photometric data (Capak et al. 2007). For an initial, robust analysis of the radio properties of high z LBGs, we have adopted a series of conservative criteria to identify LBGs at the different redshifts. The U, B, and V-band drop selection criteria are give in Table 1, where u’ = CFHT u, i’ = Subaru i, and r’ = Subaru r (Lee et al. in prep.).
It is well documents that LBG samples can include contaminants (see Steidel et al. 2000, Capak et al. 2004, Bouwens et al. 2007). In the U and B-band drop-out selection, the contamination comes from A and M stars along with star forming galaxies, while the V-band drop-out selection is contaminated with M and T stars along with obscured galaxies. Since these contaminating objects can be sources of radio emission, we take several steps to produce a clean sample of high redshift objects. We begin by removing all ACS point sources with a star- or AGN-like spectral energy distribution using the star/galaxy/AGN classifier described in Robin et al. (2007). In addition we remove all stars identified by a BzK diagram (Daddi et al. 2007) at , this removes very red stars which may not be identified by the Robin et al. (2007) classifier. We then use the BPZ photometric redshifts from Mobasher & Mazzei (2000) to remove objects with a best fit photo-z at , , and for the U, B, and V-band drop-outs, respectively. Finally we remove objects with a % probability of being at .
The resulting sample is largely clear of contaminants. Redshifts were obtained with DEIMOS on Keck-II using the 830l/mm grating and 3.5-4h of integration time for a sample of color selected objects with and or (Capak et al. in Prep). The spectroscopic sample matches 2 U-band drop-outs, 18 B-band drop-outs, and 7 V-band drop-outs in our cleaned LBG sample. Of these objects, only 1 V-band drop-out object, which is a faint M star, is not in the expected redshift range, yielding a contamination fraction of %. However, the U-band drop-outs sample was not specifically targeted, so the constraint on the contamination fraction for these objects is weak. Of the remaining 26 objects at , one B-band drop-out shows an AGN signature, implying a residual AGN fraction of %.
Although our sample is clean, it is not complete. In general, the phot-z cut creates a bias towards galaxies which have good photometry, and closely match the expected UV-Optical spectral templates used for the photometric redshifts. Objects with unusual spectra, such as AGN/galaxy composites, or objects with reddening that does not conform to the Calzetti et al. (1997) or Milky Way laws, will likely be excluded. Furthermore, we have explicitly excluded optically bright broad line AGN, and the probability requirements systematically bias us against faint () objects. The flux bias occurs because faint objects have broad probability distributions due to their poor photometric measurements.
We are also potentially biased against heavily obscured objects which will have fainter UV fluxes, and hence poor phot-z fits. An effort to use intermediate band photometry (Ilbert et al. in prep) and a systematic deep spectroscopic follow-up (Lilly et al. 2007, Capak et al. in prep) is underway to fully characterize this sample and understand the biases.
Table 2 summarizes the current samples. Column 2 indicates the redshift range implied for a given drop-out band. Column 3 shows the number of sources in the sample. Even with these conservative selection criteria, we identify thousands of high redshift LBGs due to the very wide COSMOS field. In this initial study, we feel it important to work with such a conservative sample of sources, in order to make robust conclusions concerning the radio properties of LBGs.
For reference, the radio luminosity density at a rest frame frequency of 1.4 GHz, for a source with Jy, assuming a spectral index of (Condon 1992), at is: ergs s-1 Hz-1. For comparison, the nearby radio AGN source M87 has erg s-1 Hz-1, while the luminous starburst galaxy Arp 220 has erg s-1 Hz-1. In M87, the radio emission is powered by a relativistic jet emanating from the supermassive black hole with (Gebhardt et al. 2000), while in Arp 220 the radio emission is driven by star formation with a total star formation rate year-1 (Carilli & Yun 2000; Yun & Carilli 2001). Even at the sensitivity of the COSMOS survey, we are limited to detecting either radio AGN sources, or extreme starburst galaxies, ie. galaxies with star formation rates a few thousand year-1.
3 The Radio properties of Lyman Break Galaxies
3.1 Individual sources
We have searched for radio emission from each of the LBGs in the COSMOS field. At each position we determine the surface brightness, and the rms noise in the region. The median rms in the LBG fields was Jy beam-1 for all three samples, implying a median detection limit of 60Jy beam-1. Our radio images have a synthesized beam FWHM = 1.5”, hence we have searched for radio sources brighter than 4, within 1′′ radius of the LBG optical position. Column 4 in Table 2 lists the number of 4 radio counterparts in each sample. Roughly, for each drop-out band, we detect radio counterparts for of the UV sources.
We need to correct for the number of detections we expect by chance in such a survey, either due to image noise, or faint sources unrelated to the LBG. We calculate this correction factor by performing searches with identical criteria as for the LBG positions, but at random positions selected to be away from the coordinates of the LBG samples. This should give us a random sampling of the COSMOS field, with noise statistics that match the LBG regions. We find 19 4 random detections in the U-band drop-out fields, 4 for the B-band drop-outs, and 3 for the V-band drop-outs. These correspond to 0.29%, 0.28%, and 0.49%, respectively. We apply these corrections in column 5 of Table 2.
Overall, we detect radio counterparts to of the UV sources, with the expected number of detections at random being . These results imply that only a small fraction, , of the LBGs, are radio sources brighter than , where, on average Jy.
3.2 A stacking analysis
We investigate the statistical radio properties of the LBGs through a stacking analysis. We adopt the median stacking method used by White et al. (2007) in their stacking analysis based on the FIRST radio survey. White et al. perform detailed calculations that show that a median stacking analysis is superior to a mean stacking, since it is robust to small numbers of bright sources, and it does not require any maximum allowed flux density cut-off prior to stacking. Moreover, they show that: ’…in a limit where almost all of the values in the sample are small compared to the noise, it is straight-forward to interpret the median stack measurements as representative of the mean for the population.’ The COSMOS sample obeys this criterion.
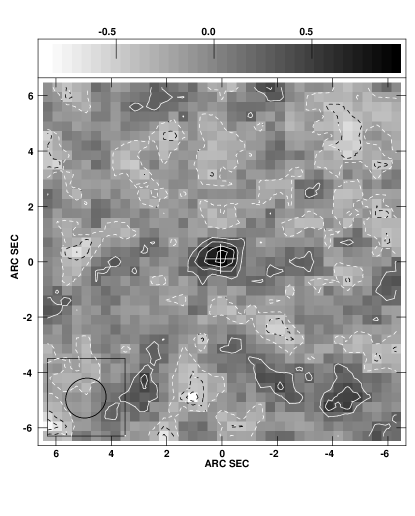
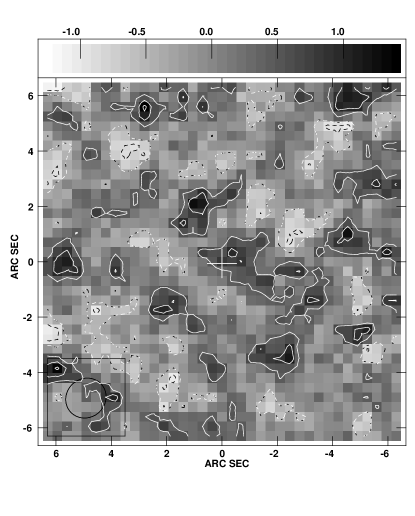
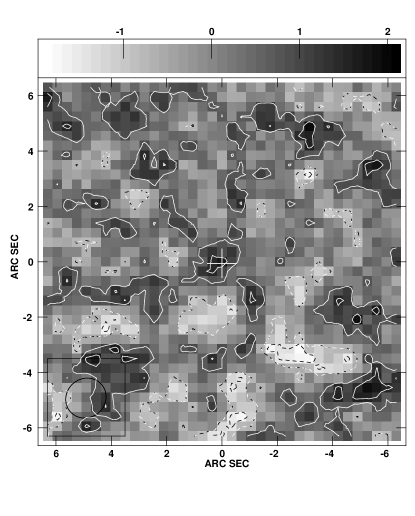
Figure 1 shows the images derived by a median stacking of all the sources in each drop-out band. These images are derived by extracting sub-images centered around each LBG with a size of . We then ’stack’ these sub-images, aligned at the center (on-source) position, and derive the median surface brightness at each pixel position. The off-source pixels serve as test positions for a random stacking analysis. We find that the mean values for the off positions equal zero, to within the noise, as expected for random positions. We also derive the statistical noise of the analysis from these off-positions.
Column 6 in Table 2 lists the peak surface brightnesses derived at the stacked LBG position, plus the rms off-source noise, for each sample. We obtain a clear detection of radio emission in the U-band drop-out sample, with a value of Jy. The other bands show marginal detections, although at value, and hence we consider these upper limits.
Our results are consistent with the upper limit found by Ivison et al. (2007), who performed a 1.4 GHz stacking analysis of 107 LBGs in the extended Groth strip (the AEGIS survey), for which they obtained a median value of Jy.
The stacked source is unresolved, with a size . The implied physical size is kpc, hence the typical source must be galaxy size, or smaller.
4 Discussion
4.1 The AGN fraction and massive starbursts
At the sensitivity limits of current deep radio surveys, such as COSMOS, detection of individual sources at is limited to either extreme starbursts (star formation rates year-1), or radio jet sources with luminosities comparable to M87.
After correcting for random detections, we obtain a detection rate of . Shapley et al. (2003) find an AGN fraction in LBG samples of , based on optical spectroscopy. If all of our detected sources are radio AGN, then the implied radio loud fraction is . Interestingly, a value of 10% is the canonical value for radio loud AGN based on studies of nearby galaxies (eg. Ivezic et al. 2002; Petric et al. 2007).
We emphasize caution in interpreting our results on the radio loud fraction of AGN at high redshift, for a number reasons. First, in a recent comparison of the FIRST and SDSS surveys, Jiang et al. (2007) find that the radio loud fraction likely depends on both optical luminosity and redshift. This study is not directly comparable to our COSMOS study, since they were limited to much more luminous sources at high redshift, by about two orders of magnitude in the radio.
Second, the above analysis does not consider the possibility that some of the 0.3% of the radio detections are extreme, highly obscured starbursts, comparable to the submm galaxies. Indeed, in a companion paper, we present the discovery of a submm galaxy in our radio-selected LBG COSMOS sample (Capak et al. 2008). The radio-detected LBG has a spectroscopic redshift of , and a radio flux density of Jy. Thermal emission from warm dust is detected from this galaxy at 250GHz using the MAMBO bolometer camera, with a flux density of mJy. This source is the first submm galaxy yet identified (spectroscopically) at (Capak et al. 2008).
And third are the caveats mentioned in section 2 concerning our conservative source selection criteria, eg. excluding obvious optically bright broad line AGN.
4.2 The sub-Jy radio source population
The unprecedented size of the COSMOS LBG sample has allowed us to reach sub-Jy sensitivity levels in the stacking analysis of the LBG samples. We obtain a clear statistical detection of Jy for the U-band () drop-outs. The implied rest frame 1.4 GHz luminosity density is erg s-1 Hz-1, assuming a spectral index of (Condon 1992).
Assuming the radio emission is driven by star formation, we can derive a total star formation rate (0.1 to 100 ), from the rest frame 1.4 GHz luminosity density. There are a number of recent calibrations of this relationship for nearby galaxies using, eg. the IRAS and NVSS surveys. These studies adopt the star formation rates derived from the far-IR emission based on the relations in Kennicutt (1998), assuming a Salpeter IMF, and then calibrate the radio conversion factor using the tight radio to far-IR correlation for star forming galaxies. We adopt the conversion factor from the study of Yun, Reddy, and Condon (2001):
where is in erg s-1 Hz-1. From this, we calculate a mean star formation rate of year-1. Note that the conversion factor above is within 10% of that derived by Bell (2003).
The mean observed UV luminosity at a rest frame wavelength of 1600 Å of the U-band drop-out sample is: erg s-1 Hz-1 (Capak et al. 2008 in prep). Using equation (1) in Kennicutt (1998) for the relationship between UV luminosity and total star formation rate, we derive a total star formation rate of 17 year-1, uncorrected for dust attenuation.
The ratio of radio derived star formation rate to UV derived star formation rate is . The simplest conclusion is that the UV emission is attenuated by dust by a factor of 1.8. However, this factor is considerably smaller than the standard factor adopted for LBGs (see Section 1). We consider some possible reasons for this difference.
One possibility is that the dust attenuation factor for the COSMOS LBG sample is indeed smaller than for other LBG samples. Most of the studies of dust attenuation of LBG galaxies have been at (see section 1), and hence it is possible that at higher redshift the dust attenuation factor decreases. An argument against this decrease is the recent X-ray and optical study of a sample of LBGs at by Nandra et al. (2002), who also derive a dust attenuation factor of about 5. We also re-emphasize that the COSMOS LBG sample analyzed herein de-selected sources with poor phot-z fits, which can occur for very heavily obscured objects (Section 2).
On the other hand, Wilkins, Trentham, & Hopkins (2008) present a detailed comparison of the build up of stellar mass in galaxies versus the cosmic star formation rate density. They conclude that there is a discrepancy between the rate of stellar mass creation, and the star formation rates derived from the UV luminosities, at high redshift, if one assumes the standard factor dust attenuation. The discrepancy is in the sense that the UV derived star formation rates are too high. They find that the peak in the discrepancy occurs at , and they suggest that the UV-derived star formation rates at this redshift may be over-estimated by a factor . They also point out that ’…this large deviation at high redshift offers an explanation for why the integrated star formation history implies a local stellar mass density in excess of that measured.’
A second possibility is that the conversion factor of radio luminosity to star formation rate is higher in the LBG COSMOS sample than has been derived for low redshift galaxies. Radio studies of 24m selected galaxies by Appleton et al. (2004) imply that the radio conversion factor is constant out to , ie. that the radio-FIR correlation is constant out to this redshift. Reddy & Steidel (2004) extend this conclusion out to in their extensive study of UV selected galaxies. Most recently, Ibar et al. (2008) conclude that the radio conversion factor remains constant out to , using a 24m source sample with redshifts from the SXDF. However, given the need for individual source detections in the radio, their radio sources have star formation rates about two orders of magnitude larger than the stacking results presented herein, and hence a direct comparison is problematic.
One physical reason why we might expect the radio conversion factor to diverge at the highest redshifts is increased relativistic electron cooling due to inverse Compton scattering off the cosmic microwave background (CMB). The ratio of relativistic electron energy losses due to synchrotron radiation, to energy losses due to inverse Compton radiation, equals the ratio of the energy density in the magnetic field to that in the photon field. The energy density in the CMB increases as: ergs cm-3. Figure 2 shows a comparison of with the typical energy densities in the magnetic fields in different regions in galaxies. We show the range of fields considered typical for spiral arms ( few G), and for starburst galaxy nuclei (of order 100G; Beck et al. 1994; see review by Beck 2005). The important point is that IC losses off the CMB will dominate synchrotron losses in a typical ISM at , and dominate in starburst nuclei at .
We note that inverse Compton losses will not affect the thermal electrons responsible for Free-Free emission from star forming galaxies. Such Free-Free emission may dominate the total radio emission from galaxies at rest frequencies between roughly 40 GHz and 100 GHz (Condon 1992), and hence become an important factor in radio continuum studies of very high redshift galaxies.
A depressed radio luminosity for a given star formation rate could also arise if the LBGs are systematically smaller galaxies. The standard model that produces the radio-FIR correlation (Condon 1992) requires a cosmic ray processing box size kpc. It has been observed that dwarf galaxies at low redshift depart from the radio-FIR correlation by about a factor of 2, in the sense of being radio under-luminous. The hypothesis is that the cosmic rays diffuse out of the galaxy on timescales shorter than required to maintain the standard radio-FIR correlation (Yun et al. 2001). Giavalisco (2002) describes high LBGs as having typical half-light radii of 4 to 7 kpc, significantly larger than typical dwarf galaxies. However, he points out that: ”..frequently the galaxies have disturbed or fragmented morphologies, with one bright core, or multiple knots embedded in diffuse nebulosity, reminiscent of merger events.”
In this paper, we report the first robust statistical (median) detection of sub-Jy radio emission from LBG galaxies at . This detection was made possible by the very wide area, and depth, of the Cosmos field. While our physical interpretation of the result remains inconclusive, there are a number of future studies we are pursuing to address the interesting questions raised concerning the UV attenuation factor for LBGs, and the the radio luminosity to star formation rate conversion factor, at . The most important study involves obtaining optical spectra of a large sample of LBGs from the COSMOS sample. Spectra will elucidate the nature of the sources, and allow for a study of the dust correction factor as a function of galaxy type (AGN, starburst, elliptical…). Also, the selection criteria for this LBG sample were very conservative (Section 2). We will further refine (and increase) our LBG samples using the Cosmos multiband photometry, and perform statistical analyses of the radio properties as a function of eg. stellar mass, or . We are also exploring the IR properties of these samples with Spitzer. Such IR studies have particular relevance in the light of the results of Ivison et al. (2007), who find that for the seven IR luminous LBGs in their AEGIS sample (Jy), the median 1.4 GHz flux density is 44Jy, comparable to that expected for sub-mm galaxies. Lastly, unambiguous identification of radio AGN using eg. optical spectra, will provide input into faint radio source population models that are being generated in the context of planning for future, large area radio telescopes (Wilman et al. 2008). The results presented herein indicate that future deep (sub-Jy), wide field surveys with the Expanded Very Large Array, will detect routinely the radio emission from individual LBGs out to .
at http://www.astro.caltech.edu/cosmos. CC thanks the Max-Planck-Gesellschaft and the Humboldt-Stiftung for support through the Max-Planck-Forschungspreis. We thank the referee for helpful comments.
References
- (1) Appleton, P.N., Fadda, D. T.; Marleau, F. et al. 2004, ApJS, 154, 147
- (2) Adelberger and Steidel 2000, ApJ, 544, 218
- (3) Bell, E. 2003, ApJ, 586, 794
- (4) Beck, R. 2005, in ’Magnetic fields in the Universe: From Laboratory and Stars to Primordial Structures,’ AIP Conference Proceedings, 784, 343
- (5) Beck, R. Carilli, C.L., Holdaway, M.A., Klein, U. 1994, 292, 409
- (6) Bouwens,R.J., Illingworth, G.D., Franx, M., Ford, H. 2007, ApJ, 670, 928
- (7) Capak, P. et al. 2008, ApJ letters, 681, L53
- (8) Capak, P. et al. 2007, ApJS, 172, 99
- (9) Capak, P. et al. 2004, AJ, 127, 180
- (10) Carilli, C.L. et al. 2007, ApJS, 172, 518
- (11) Carilli, C.L., Yun, M.S. 2000, 530, 618
- (12) Calzetti, D. 1997, AJ, 113, 162
- (13) Condon, J. 1992, ARAA, 30, 575
- (14) Daddi, E., Dickinson, M., Morrison, G. et al. 2007, ApJ, 670, 156
- (15) Gebhardt, K. et al. 2000, ApJ, 539, L13
- (16) Giavalisco, M. 2002, ARAA, 40, 579
- (17) Ibar, E., Cirasoulo, M., Ivison, R., Best, P., Smail, I. et al. 2008, MNRAS, 386, 953
- (18) Ivezic, Z., Menou, K., Strauss, M., Knapp, J., et al. 2002, AJ, 124, 2634
- (19) Ivison, R.J. Chapman, S.C., Faber, S.M., Smail, I., Biggs, A. et al. 2007, ApJ, 660, L77
- (20) Jiang, L., Fan, X., Ivezic, Z. et al. 2007, ApJ, 656, 680
- (21) Kennicutt, R. 1998, ARAA, 36, 189
- (22) Meurer, G., Calzetti, D., Heckman, T. 1999, ApJ, 512, 64
- (23) Mobasher, B. & Mazzei, P. 2000, A& A, 363, 517
- (24) Nandra, K. et al. 2002, ApJ, 576, 625
- (25) Petric, A., Carilli, C.L., Bertoldi, F., Beelen, A., Cox, P., Omont, A. 2006, AJ, 132, 1307
- (26) Reddy, N. & Steidel, C. 2004, ApJ, 603, L13
- (27) Robin, A.C., Rich, R.M., Aussel, H. et al. 2007, ApJS, 172, 545
- (28) Schinnerer, E. et al. 2007, ApJS, 172, 46S
- (29) Scoville, N. et al. 2007, ApJS, 172, 38S
- (30) Shapley, A., Steidel, C., Pettini, M., Adelberger, K. 2003, ApJ, 588, 65
- (31) Steidel, C., Adelberger, K., Shapley, A., Pettini, M., Dickinson, M., Giavalisco, M. 2000, ApJ, 532, 170
- (32) Steidel, C.C., Adelberger, C., Giavalisco, M., Dickinson, M., Pettini, 1999, ApJ, 519, 1
- (33) Wilkins, S., Trentham, N., Hopkins, A. 2008, MNRAS, 385, 687
- (34) White, Richard L., Helfand, David J., Becker, Robert H., Glikman, Eilat; de Vries, Wim 2007, ApJ, 654, 99
- (35) Wilman, R.J, Miller, L., Jarvis, M., Mauch, T., Levrier, F. et al. 2008, MNRAS, 388, 1335
- (36) Yun, M.S., Reddy, N., Condon, J. 2001, ApJ, 554, 803
- (37) Yun, M.S., Carilli, C.L. 2002, ApJ, 568, 88
| U-band drop-outs | ( | ( | ( |
|---|---|---|---|
| B-band drop-outs | ( | ( | |
| V-band drop-outs | ( |
| Band | Redshift | # of LBGs | # of Sources | Corrected # of Sources | Median flux density |
| Jy | |||||
| U | 2.5–3.5 | 6457 | 43 (0.67%) | 24 (0.38%) | |
| B | 3.5–4.5 | 1447 | 8 (0.55%) | 5 (0.34%) | |
| V | 4.5 | 614 | 5 (0.81%) | 2 (0.33%) |