The Infrared Luminosity of Galaxy Clusters
Abstract
Context. The cosmological models for the formation of the first stars and the large scale structures now raise the question of how many dust particles were released to the general diffuse gas and how these impact the star formation process. In this framework, we focus on the scale of galaxy clusters.
Aims. The aim of this study is to quantify the infrared luminosity of clusters as a function of redshift and compare this with the X-ray luminosity. This can potentially constrain the origin of the infrared emission to be intracluster dust and/or dust heated by star formation in the cluster galaxies.
Methods. We perform a statistical analysis of a large sample of galaxy clusters selected from existing databases and catalogues.We coadd the infrared IRAS and X-ray RASS images in the direction of the selected clusters within successive redshift intervals up to .
Results. We find that the total infrared luminosity is very high and on average 20 times higher than the X-ray luminosity. If all the infrared luminosity is to be attributed to emission from diffuse intracluster dust, then the IR to X-ray ratio implies a dust-to-gas mass abundance of . However, the infrared luminosity shows a strong enhancement for , which cannot be attributed to cluster selection effects. We show that this enhancement is compatible with a star formation rate (SFR) in the member galaxies that is typical of the central Mpc of the Coma cluster at and evolves with the redshift as .
Conclusions. It is likely that most of the infrared luminosity that we measure is generated by the ongoing star formation in the member galaxies. From theoretical predictions calibrated on extinction measurements (dust mass abundance equal to ), we expect only a minor contribution, of a few percent, from intracluster dust.
Key Words.:
Galaxies: clusters, Infrared: galaxies, X-rays: galaxies: clusters, intergalactic medium, diffuse radiation, Galaxies: starburst1 Introduction
Dust is only a minor constituent of the known cosmic matter. It represents only 1% of the total diffuse (non-stellar) baryonic mass in our Milky Way (see e.g. Spitzer (1978), page 7 and 8), and possibly 0.002% in the diffuse intergalactic medium (Aguirre et al. 2001). However, small solid bodies (i.e. dust grains) are the main source of opacity for the electromagnetic radiation emitted by stars because they allow some electrons to be far more mobile than in free atomic or molecular orbitals. The practical consequence of this opacity is that dust thermal re-emission of absorbed photons has become a very efficient and popular tracer of the star formation efficiency (see the review by Lagache, Puget & Dole (2005) and references therein).
Moreover, the photodetachment of electrons from dust grains can occur more easily than from either a free atom or molecule, because the binding energies are smaller. This implies that the gas in which dust grains are embedded can be heated by photoelectrons if the stellar radiation is sufficiently strong (see Weingartner, Draine & Barr (2006) and references therein). Heating by the photoelectric effect of grains and cooling by their thermal infrared (IR hereafter) emission, are two opposite energy routes that, in addition to the gas processes, can have an important impact on the energy balance of gas clouds, and therefore on their ability to fragment, condense and form stars (De Jong 1977). Finally, it has been conjectured since the advent of molecular astrophysics (Gould & Salpeter 1963) that the grains surfaces play an important role in interstellar chemistry, and particularly in the synthesis of molecular hydrogen (see Cazaux & Tielens (2002) for a recent estimation).
The question of whether dust could play a role in optically thinner media and on cosmological scales such as the intergalactic medium (hereafter IGM) or the intracluster gas (hereafter ICM), if present, has been scrutinized on a theoretical point of view by several authors: see Dwek, Rephaeli & Mather (1990), Popescu et al. (2000), and Montier & Giard (2004) . Montier & Giard (2004) computed the balance of dust heating and cooling with respect to the dust abundance: cooling dominates at high temperatures in the hot gas of virialized structures (i.e. galaxy clusters), and heating dominates in low temperature plasma under high radiation fluxes such as in the proximity of quasars. The details, of course, depend on the local physical parameters such as the grain size and gas density. The limitations of and uncertainties in the modeling are due to incomplete knowledge how both the formation of the first supernovae and the production of dust, correlate spatially and precede in time the heating of gas accreted onto the large-scale structures and dust destruction. The processes of feeding and enriching both the ICM and IGM with dust is even more of a key issue when taking into account that dust in these media is affected strongly by thermal sputtering and has lifetimes ranging from yr to yr (depending on the grain size). Therefore, when attempting to understand in detail the formation of large-scale structures in the Universe, the impact of a dust component on the thermodynamics of the early ICM raises the important question of the heavy elements and dust grain synthesis in the first supernovae (SNe) and how they were able to seed the primordial diffuse gas and change its ability to fragment and form more stars and galaxies (see for instance Schneider et al. (2006) or Kampakoglou, Trotta & Silk (2008)).
Elfgren & Désert (2004) and Elfgren, Désert & Guiderdoni (2007) evaluated the dust emission in large scale structures from the time of reionization to the present by assuming the dust density to be a fraction of the dark matter density and its mass distribution to follow that of the dark matter, and by fixing the dust lifetime. Depending on the dust lifetime, these authors found that the integrated signal from the dust thermal emission produces brightness fluctuations on arcminute scales, which can be comparable to CMB and galactic dust fluctuations.
We therefore expect dust in the IGM/ICM to contribute to the diffuse IR emission in the direction of the large scale structures, and particularly towards galaxy clusters. The only claim of detection of IR emission from intracluster dust was that of Stickel et al. (1998, 2002) towards the Coma cluster using the ISOPHOT instrument. A statistical detection of intracluster dust extinction towards SDSS quasars located behind clusters of galaxies was obtained by Chelouche, Koester & Bowen (2007). An upper limit was also derived by Muller et al. (2008) by studying the statistical reddening of galaxies behind 458 RCS clusters. Finally, Bai et al. (2007b) derived upper limits at 24 and 70 m from observations by the Spitzer telescope of the cluster Abell 2029 (). Detecting emission from the ICM is indeed a difficult task because it must be distinguished from the IR emission of the cluster galaxies. The overall cluster IR emission for a single cluster is comparable or lower than the average sky fluctuation produced by galactic cirrus clouds and the cosmic infrared background (due to background galaxies).
From observational results, the IR emission from clusters is expected to originate primarily in star-forming cluster galaxies. Montier & Giard (2005) performed a statistical detection of this overall dust emission in the direction of clusters by stacking the IRAS emission at 12, 25, 60, and 100 m towards more than 11 000 known galaxy clusters. They measured significant, but faint, emission at all IRAS wavelengths. This emission corresponded to the dust emission originating in both intracluster dust and dusty star-forming cluster galaxies.
From measurements of the IR emission of star-forming galaxies from observations by the Spitzer telescope at 24 m, Bai et al. (2006, 2007) derived the luminosity function of infrared galaxies in the Coma cluster () and MS1054-0321 (). They demonstrated that the cluster galaxy luminosity function resembles that of field galaxies at both studied redshifts. They also emphasized the strong increase in IR luminosity with redshift, which implied that the star formation rate (SFR) was higher in the past within cluster environments as it was for field galaxies. Their luminosity functions, when integrated over the entire range of galaxy masses, inferred a total infrared bolometric luminosity of and erg/s respectively for Coma and MS1054-0321 (Bai et al. (2007) and private communication from the author). In contrast, the rest-frame X-ray bolometric luminosities of the two clusters are respectively erg/s (Arnaud & Evrard 1999) and erg/s (Kotov & Vikhlinin 2005).
In this paper we use the stacking method formerly developed by Montier & Giard (2005) to probe statistically the IR dust luminosity of galaxy clusters as a function of redshift. Our objective is to determine whether this luminosity evolves with redshift and discriminate if possible between the contribution of the SFR in member galaxies and the diffuse emission from intracluster dust. The stacked analysis was also completed on the X-ray Rosat All Sky Survey (RASS). We used the RASS as a reference, because the X-ray properties of galaxy clusters (i.e. structural and scaling properties) are well studied and constrained (see reviews by Voit (2005) and Arnaud (2005)). More specifically, it is well known that the X-ray luminosity correlates well with the temperature or mass of clusters (Arnaud & Evrard (1999), Maughan (2007), Vikhlinin et al. (2008) or Pratt et al. (2008)).
The paper is organized as follows. Sections 2 and 3 present the details of the data used, the selection of the fields stacked, and the stacking method. Our results are presented and discussed in Sects. 4 and 5.
In this paper, we use the following cosmology: , and .
2 Data sets and catalogues
2.1 The catalogues of clusters
| Numbers in each Catalogue | NED | NSC | SDSS |
| All references | 18 829 | 8 155 | 13 823 |
| Distinct fields (10′) | 13 746 | 7 888 | 11 982 |
| Fields rejected : | |||
| Data missing | 1 665 | 972 | 1 545 |
| Gal. plane: | 17 | 0 | 0 |
| Strong sources | 1 651 | 947 | 1 063 |
| Noisy fields | 2 120 | 1 244 | 1 898 |
| Number of fields stacked | 8 293 | 4 725 | 7 476 |

We used three different lists or catalogues of galaxy clusters as input to our stacking method.
-
•
The first one was a generic extraction from the NED database111see the NED web site: http://nedwww.ipac.caltech.edu/index.html of objects classified as “clusters of galaxies”. Each object has a coordinate and redshift. This list is extremely inhomogenous. We started with a total of 18 829 references, which reduced to 13,746 clusters fields after source duplication and overlapping fields had been identified (see Sect. 3). Hereafter, we refer to this list as the NED sample. This is the same as the cluster list used in our previous investigation (Montier & Giard 2005).
-
•
The second selection corresponds to the Northern Sky optical Cluster survey (NSC hereafter) by Gal et al. (2003). It contains 8 155 references, each with an indicator of richness, .
-
•
The third catalogue is the SDSS/MaxBCG cluster catalogue (SDSS hereafter) from Koester et al. (2007), which provides a precise measurement of the cluster richness (, i.e. the number of galaxies within ). However, the redshift coverage of this selection is limited to . We begin with 13 823 references.
In Fig. 1 we provide the redshift histograms of three sets of stacked fields (see the description of the selection process in Sect. 3).


2.2 All sky survey data sets
We performed our stacking analysis over five sets of all-sky survey data: the IRAS at 12, 25, 60, and 100 m data and the ROSAT All Sky Survey broad band data (i.e. [0.1-2.4]keV RASS). For the IRAS survey, we used the reprocessed IRIS data set that was recalibrated with DIRBE and cleaned of the instrumental stripes (Miville-Descênes & Lagache 2005).
For the RASS, we first derived count rate images that where computed to be the ratio of the count images (i.e. rs93*im1.fits) to the corresponding exposure map (i.e. rs93*mex.fits222see the ROSAT Status Report #180 (ROSAT NEWS No. 70) on the web for a detailed description of the RASS products: http://heasarc.nasa.gov/listserv/rosnews/msg00126.html). We then converted these count rate images into unabsorbed flux images by correcting for the absorption due to the hydrogen column density in the [0.1-2.4]keV band. We used a fixed conversion factor from counts to fluxes of for one count. This factor was derived using a WABS*MEKAL model with XSPEC (see Arnaud (1996)) assuming a temperature of 1.5 keV and a metallicity of Z⊙ for the intracluster hot plasma at the median redshift of (see Fig 1), and a hydrogen column density of , which was the average for the fields stacked.
The value of the conversion factor was almost insensitive to the cluster redshift. From , there is a slight increase of % up to and of % up to . However, this is quite sensitive to both the intracluster gas temperature and the column density of the foreground HI. By varying the intracluster gas temperature from 1 keV to 5 keV, the conversion factor is changed from to , respectively. The most important effect originates in the foreground HI column density: the conversion factor rises from to for that increases from to .
Considering that the average HI column density of the fields stacked is with an rms fluctuation of , we became concerned about the errors introduced into the stacked fluxes when using a single conversion factor. We completed the stacking analysis therefore using a conversion factor for each cluster corresponding to its individual value. Surprisingly there was almost no detectable impact on the averaged fluxes obtained after stacking. The reason was that, although the conversion factor varies significantly from cluster to cluster, the averaging process is completed for such a high number of clusters that the effect of any scatter on the averaged image diminishes to zero. The same was true for the cluster gas temperature, for which an initial scattering in the conversion factor was smaller. The average temperature used, 1.5 keV, was consistent with the average richness of the clusters that we selected from the SDSS entries, , and the to gas temperature correlation derived by Rykoff et al. (2008) for the same clusters (see their Table 4).
After calculating the stacked fluxes, they were converted to luminosities in the [0.1-2.4]keV band using the associated luminosity distances computed for the adopted cosmology (see Sect. 1).
Finally, we derived the X-ray bolometric luminosities from the broad band [0.1-2.4]keV luminosities using a correction factor of 1.35, which was also computed by XSPEC using a MEKAL model for a cluster at of temperature keV and metallicity Z⊙). The bolometric correction was mostly sensitive to the cluster gas temperature with a conversion factor of 1.24 at 1 keV (or 2.07 at 5 keV). However, the significant size of our cluster sample enables us to use a single correction factor computed for the average gas temperature.
We were able to confirm our luminosities by comparison with those given by Bohringer et al. (2004) in the same energy band for clusters in the REFLEX catalogue; these numbered about one hundred of clusters with luminosities ranging from a few erg/s to a few erg/s. Our luminosities were systematically slightly lower than the REFLEX ones with a mean difference of and a rms scatter of .
3 Stacking the IR and X-ray maps in different redshit bins
The entire stacking method used was similar to that described by Montier & Giard (2005). We recall the main steps of the analysis:
-
1.
Distinct fields : We first eliminated multiple occurrences of the same field. This could occur for two reasons. First, because several clusters were neighbors on the sky (at the chosen scale of our fields). Second, because the lists of clusters that we used, as in the case of the NED list, contained several references to the same object. In practice, once a field had been selected for stacking, it was identified by the coordinates of its center and any other field whose center coordinates were closer than 10 arcmin was not selected.
-
2.
Data missing : We then retained only fields for which data existed in all five sky surveys (i.e. the IRIS 12, 25, 60, and 100 m surveys and the RASS). This step eliminated 1 665 fields from the NED list, 972 from the NSC catalogue, and 1 545 from the SDSS catalogue. At this stage, we extracted a sq. degree field for each of the relevant cluster direction. The pixel size of all extracted field was set to IRIS pixel size of 1.5 arc-minutes. The RASS images had an original pixel size of 0.75 arc-minute, which was rebinned to 1.5 arc-minutes by coaddition of pixels and nearest neighbor approximation. This rebinning was performed to facilitate the data handling process for the different surveys.
-
3.
Galactic plane : We excluded all fields within a distance of 10 degrees from the Galactic plane (NED references).
-
4.
Strong sources : In each field, we then masked all obvious sources in a pixels square area. The sources were first taken from the IRAS point source catalogue. This was completed by a source detection algorithm for both the IRIS and the X-ray images. This algorithm performed a 3x3 boxcar smoothing of each field and selected sources identified at a confidence level of 5 sigma with respect to the average. If an infrared source was detected at the center of a field (i.e. within a radius of 5 pixels) the field was removed from the list. However, we allowed fields to have an X-ray source detected at their center since massive galaxy clusters were well detected in the RASS data. This eliminated 1 651 more fields from the NED list, 947 from the NSC, and 1 063 from the SDSS lists.
-
5.
Background subtraction : At this stage, we performed a background subtraction for each map. We chose a 3 degree polynomial surface as background layer. The best polynomial was obtained by applying a least square fit to the image over an external ring which extended from pixel # 10 to pixel # 20 (i.e. between radii of 15’ to 30’ from center). The source mask defined previously in each sky direction was used to blank the image area used for the fit. The order chosen for the polynomial surface ( order) is optimum because it is able to adapt to most backgrounds without altering data at the field center due to some uncontrolled oscillation in the fit.
-
6.
Noisy fields and weighting : Finally, we eliminated the noisiest fields and weighted the remaining fields with their intrinsic noise level at m wavelength. This was performed by computing the rms flux in each masked image over the outer ring defined for the background fit (between radii of 15’ to 30’ from center). All fields for which this rms was higher than 5 times the standard deviation of all rms were then excluded. This rms evaluation of the sky fluctuation performed on each field at m was also used to compute the weight of each image in the final stacking. For field we used the following weighting: . The median of all rms values was added to each rms value to prevent any extremely flat images (which statistically happen) dominating the final sum. This final selection step eliminated 2 120 more fields from the NED, 1 244 from the NSC, and 1 898 from the SDSS lists.
Our final data set contained 8 293 fields from the NED list, and respectively 4 725 and 7 476 from the NSC and the SDSS catalogues. The average Galactic HI column density in the direction of the selected NED clusters was about (and for the NSC and SDSS selection).
Regarding the cluster richness, the average number of galaxies in the NSC and SDSS clusters selected were respectively and . From the correlation between and the gas temperature derived for the SDSS cluster catalogue by Rykoff et al. (2008) (see their Table 4), we obtained a mean temperature of 1.5 keV for our SDSS selection.
To study the evolution of the cluster luminosity with redshift, the selected cluster fields were sorted in order of increasing redshifts. Redshift bins were then defined to have an equal number of clusters in each bin (that is 830 clusters in each of the 10 bins for the NED selection). The average flux image for each bin was calculated using the optimal weights specified above. The bins, weights, and source masks used in the stacking were the same at all wavelengths.
When a positive signal was detected at the center of a stacked field at a given redshift, we computed the corresponding averaged luminosity. This luminosity was calculated by integrating the flux inside the central 18’ (9’ radius from center) of the stacked images after subtraction of a possible residual background computed to be the average flux in an outer annulus between 9’ and 18’ radii from the field center.
For the infrared data, the luminosity was computed for a wavelength interval of . This is a convenient quantity since astrophysical dust models show that the total infrared luminosity can be well approximated as the sum of these contributions in the four successive IRAS bands (Désert, Boulanger & Puget 1990).
4 Results
The stacking provided firm detections at all redshifts only in the 60 m, 100 m and X-ray bands.
Fig. 2 shows the radial profiles computed for the stacked images of the NED selection at m and [0.1-2.4]keV for three redshift bins: , , and . There is a clear signal detected at all redshifts, at both infrared and X-ray energies.
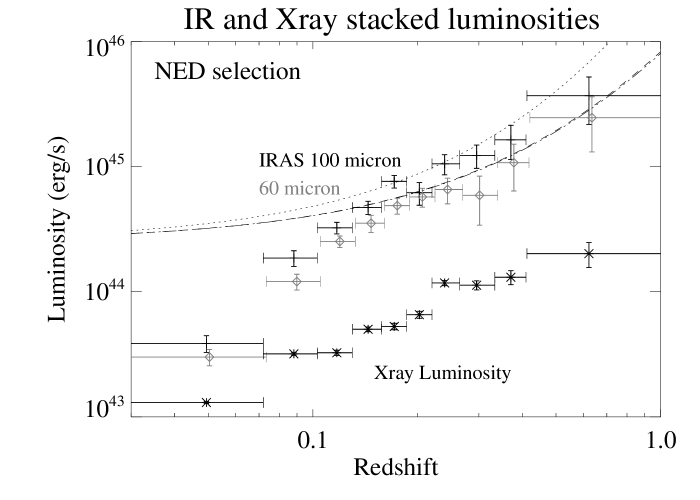
In Fig. 3, we show the average infrared and X-ray luminosities in each bin for the NED clusters sample.
In Fig. 4, we show the ratio of the total infrared luminosity to the X-ray bolometric luminosity. According to the dust model of Désert, Boulanger & Puget (1990), the total infrared luminosity (i.e. bolometric) was approximated by the sum of the 60 and m luminosity : . This value should certainly be taken to be a lower limit for the total IR luminosity since we know from direct observation or from modelling that dust emits a large fraction of its luminosity longward of , both in normal quiescent spiral galaxies (Sauvage, Tuffs & Popescu 2005) and for intracluster physical conditions (Popescu et al. 2000). The two star symbols in the same plot indicate the IR-SFR to X-ray luminosity ratio derived by Bai et al. (2007) for two peculiar clusters, Coma and MS 1054. The infrared luminosity of these two clusters was derived from Spitzer m photometry of the member galaxies and does not include the diffuse emission if any is present. We assigned a error bar to the IR luminosity of these two clusters as measured by the authors.

4.1 Origin of the IR luminosity
The first conclusion to draw from our results is that the average bolometric infrared luminosity of galaxy clusters is far higher than their X-ray luminosity. The average IR to X-ray ratio is about 20, possibly showing a slight increase with redshift (see Fig. 4).
Our measurements of IR luminosity probe the contributions of all sources of infrared emission in clusters; i.e. star formation in the member galaxies and any diffuse emission from intracluster dust. These two emission processes have different physical origins and consequences. On one hand, infrared emission from galaxies is correlated with the total star formation rate, which provides a net energy contribution to the immediate environment. On the other hand, emission from intracluster dust is a cooling agent that can accelerate the condensation of diffuse baryons into stars and galaxies.
High IR to X-ray luminosity ratios were also measured for two individual clusters of galaxies by Bai et al. (2007): and , for Coma () and MS1054-0321 () respectively. However, in these two cases, the IR luminosity is due only to the contributions of the individual cluster galaxies detected by the Spitzer-IRAC camera at m, and does not measure any diffuse intracluster dust emission.
Although this comparison relies on only two clusters, and should therefore be considered with care, it implies that the IR luminosity contribution of cluster member galaxies represents a significant fraction of the IR luminosity measured in our stacked data, although possibly not all of the luminosity. Any additional IR emission could either be due to a population of unresolved galaxies in the Spitzer observations, such as IR emitting dwarf galaxies with low surface brightness (Popescu et al. 2002; Hinz et al. 2006), or to diffuse intracluster dust. In the following, we attempt to assess quantitatively the validity of these two hypotheses: the IR originates in (1) cluster galaxies, or (2) intracluster dust.
4.2 Intracluster dust
We use the simple model of intracluster dust emission developed by Montier & Giard (2004), where the dust grains are heated by collisions with free electrons and radiate in the infrared with properties typical of interstellar dust grains. To first order, the IR to X-ray luminosity ratio is proportional to , which is the dust-to-gas mass ratio. If we normalize on the curve shown in Fig. 8 of Montier & Giard (2004), the IR to X-ray luminosity ratio over the relevant electron temperature range ( to ) is then given by:
| (1) |
To derive an IR to X-ray ratio similar to that measured, i.e. , from the thermal emission of diffuse intracluster dust alone, we therefore require a dust-to-gas mass ratio of .
This dust-to-gas mass ratio would represent a significant fraction (%) of the total mass of metals available in an intracluster environment (assuming ). The precise dust-to-gas mass ratio in the intracluster medium cannot be easily constrained on purely theoretical grounds, since it is the result of a complex balance between the production and destruction processes of ICM dust (see the discussion in Montier & Giard (2004)).
4.3 SFR of the member galaxies
It is now well established that the infrared emission of galaxies increases significantly between redshift and , because the star formation rate (SFR) is measured to be higher in the past than the present. With Spitzer data, the evolution of the infrared luminosity function of galaxies was characterized quantitatively for both field galaxies in the Chandra Deep Field-South by Le Floc’h et al. (2005) and galaxies in massive clusters by Bai et al. (2007).
We adopt the Schechter formalism (Schechter 1976) to count the number of objects within each logarithmic (base ten) luminosity interval:
| (2) |
where is fixed as in Bai et al. (2006).
Both Le Floc’h et al. (2005) and Bai et al. (2007) were able to describe the evolution of this luminosity function using power laws for and :
| (3) |
with , in Le Floc’h et al. (2005), or , in Bai et al. (2007). It is important to note that the two sets of coefficients are compatible within the reported error bars in these two works.
We integrated the luminosity functions to derive the evolution of the total SFR luminosity with redshift. The normalisation used at is adjusted from the so-called BvdHC sample of IR galaxies in the Coma cluster (see filled circles in Fig. 5 of Bai et al. (2007)) :
| (4) | |||||
The resulting total infrared SFR luminosities are plotted in Fig. 3 as dashed (Le Floc’h et al. 2005) and dotted (Bai et al. 2007) lines. These integrated luminosities are actually close to a evolution law. We emphasize that this normalisation of the SFR luminosity is relative to a projected cluster area of ; it is a coincidence that it corresponds to the same level as the total luminosities computed from our stacked IRAS images at redshifts higher than 0.1. Although we do not exploit this coincidence, we believed that it was noteworthy for future quantitative investigations of this question.
5 Discussion
A clear interpretation of our results is difficult because the galaxy cluster sample that we extracted from the NED catalogue is obviously affected by selection effects. For instance, the net decrease in the IR luminosities compared with the SFR model at redshifts lower than 0.1 is likely to be a strong selection effect in the cluster mass function that produces a strong bias towards low mass clusters at low redshifts with respect to high mass clusters (i.e. the relative number of identified low mass with respect to high mass systems is far more important at low than at high redshift). This issue was the first motivation for stacking the cluster data at X-ray wavelengths and to use the X-ray data as a reference data set. In a second time, to tackle this problem further, we repeated our stack analysis for the NSC catalogue, which has a more carefully defined selection function and provides an indication of cluster richness: . Finally, we checked with the SDSS cluster sample, which provides a more robust determination of the cluster richness (i.e. ), that in the NSC is a valid measure of the cluster richness, at least for statistical studies like this one.
5.1 The and the dust-to-gas mass ratios
As shown in Sect. 4.2, we require a dust-to-gas mass ratio of to explain the IR to X-ray luminosity ratio if dust in the ICM is the unique source of the IR emission. This ICM dust abundance is actually to be taken as an upper limit since we obviously know that there is also a contribution to the IR from the star formation in the member galaxies. The comparison with the IR-SFR to X-ray luminosity ratios measured for the two clusters Coma and MS1054-0321 (Bai et al. 2007) confirms that the measured SFR may be insufficient to explain the high IR to X-ray luminosity ratio derived by our stacking analysis. Moreover, our upper limit to the dust in the ICM is of the same order as that measured by Muller et al. (2008) from their search for statistical reddening of background galaxies behind a sample of 458 RCD clusters with . Their extinction value converted into an upper limit to the dust mass within the central Mpc is M⊙. This value then translates into a dust mass abundance limit of .
Conversely, one can use the existing constraints on the intracluster dust abundance to derive the ratio. By looking at the reddening of QSOs behind SDSS clusters, Chelouche, Koester & Bowen (2007) measured an average color excess of mag. This detection is valid for the external parts of the SDSS clusters (i.e. Mpc). If we extrapolate this to the central Mpc of a cluster, this corresponds to a total dust mass of M⊙ (see their Eq. 4). Compared with the corresponding gas mass in the same volume, this leads to . Note that our stacking integrates the luminosity within a disk area of radius, which translates into Mpc radius at and respectively Mpc radius at . The dust abundance derived from this extinction measurement is consistent with the upper limit derived by Bovy, Hogg & Moustakas (2008) from measurement of reddening of SDSS galaxies behind galaxy clusters and with theoretical predictions given by Popescu et al. (2000). From Eq. (1), a dust abundance translates into . This is only about of the IR luminosity measured in the stacked data, leaving most of it () to SFR in the member galaxies.
5.2 Selection effects

Obviously the cluster richness for the NED extraction increases with redshift as a result of ill-determined selection effects, and this will affect the stacked luminosities (IR and X-ray).
To confirm this, we reproduced the entire stacking analysis for the NSC selection. The NSC spans a narrower redshift range than the NED selection ( for the NSC sample, and for the NED sample), but it includes an estimation of the cluster richness. To quantify the selection bias, we averaged the cluster richness in the same redshift bins as those fixed for the IR and X-ray luminosities. The stacked luminosities for the NSC sample are plotted in Fig. 5. We have retained the same redshift binning as for the NED analysis, meaning that we now have unequal numbers of clusters in each bin. We don’t show the final two bins which have too few clusters to provide a statistical significant result (these two bins contain respectively 61 and 14 clusters, whereas we have more than 350 clusters in all other bins). The average richness in each bin, , is shown in Fig. 6.
The IR luminosities derived from the NSC selection show the same behaviour as those obtained from the NED selection. The average richness in the bins indicates that the selection is homogeneous for with a mean NSC richness of . As expected, there is a clear bias toward smaller clusters at , with a mean richness of for the first bin, corresponding to .
Finally, we checked that the richness parameter given in the NSC catalogue is a robust probe of the cluster richness. We show in the lower panel of Fig. 7 that the X-ray luminosity correlates well with . To compile this plot, we simply run the stacking again, but for clusters stacked into bins of equal instead of redshift. However, for this analysis, the stacking procedure was modified to compute the background subtraction and luminosity of each cluster field individually, before stacking. The correlation between and the infrared luminosity is good, but not as significant as for the X-ray luminosity, particularly because of the large error bar in the first richness bin.
From this analysis, we derived the following power laws, correlating the X-ray and infrared luminosities to :
| (5) |

We completed the same analysis for the SDSS selection and the corresponding cluster richness . The results are plotted in the upper panel of Fig. 7. They indicate that both the X-ray and the infrared luminosities correlate well with . This is not surprising because the richnesses given for the SDSS clusters by Koester et al. (2007) were carefully determined in a homogenous way. The correlation analysis provides the following power laws:
| (6) |
If we compare our relation with that derived by Rykoff et al. (2008) (their Fig. 6), we see that our results are compatible for , given that our luminosities are bolometric and refer to instead of (i.e. ). However, their slope is steeper because we did not scale our aperture in terms of either redshift or cluster richness in the same way as these authors ( 750 kpc or ). Therefore we measure slightly higher luminosities for the low richness clusters ().
The tight correlation between X-ray luminosity and richness is clear both for the NSC and the SDSS clusters and confirms that in the NSC catalogue is a robust measure of the cluster richness, at least for statistical purposes as in Fig. 6 to investigate whether the cluster richness is biased with redshift.
A secondary result of this analysis is that the exponent of the to correlation is lower than for the X-ray (0.8 instead of 1.5 for the SDSS clusters). This is definitely related to differences in the physical emission processes that occur in the infrared and the X-rays. However, we do not investigate this property in this paper.


6 Conclusion
We have coadded IRAS and RASS images in the direction of thousands of galaxy clusters selected in the NED database for their low noise properties (smooth background) following the same method as Montier & Giard (2005). We have compared the IR and X-ray luminosities, and investigated their evolution with redshift. We showed that the averaged infrared luminosities are on average 20 times higher than the X-ray luminosities, and that the infrared luminosity increases with redshift approximately as for redshifts between 0.1 and 1. We applied the same method to clusters selected from the NSC catalogue by Gal et al. (2003). This is a well selected catalogue of galaxy clusters for which a qualitative control of the selection bias with the redshift was possible. This showed the same behavior as the previous catalogue, but for a restricted redshift range , which confirmed our result for the evolution of the IR luminosity.
If all the infrared luminosity that we measure is attributed to emission from diffuse intracluster dust, this implies a dust-to-gas mass abundance in the intracluster gas of . However, given other constraints on the abundance of intracluster dust ( from the extinction towards the outer parts of the SDSS clusters measured by Chelouche, Koester & Bowen (2007) and Bovy, Hogg & Moustakas (2008)), and the fact that the IR luminosity mimics the evolution of the SFR with redshift, we believe that it is more likely that the main contribution to the cluster IR luminosity is from the ongoing star formation in the member galaxies. From theoretical predictions calibrated with the afore mentioned extinction measurement, we expect that only a minor contribution (a few percent) could originate in intracluster dust. This conclusion is supported independently by the overall shape of the spectral energy distribution of the stacked data that we published in Montier & Giard (2005), and which showed a high to color ratio (of 0.062 for flux density, or 0.52 for luminosity). This high color ratio implies that nanoparticles emitting in the mid IR are abundant relative to big grains within the emitting phase. These tiny particles would not survive in hot intracluster gas, and are instead typical of normal spiral and star-forming galaxies.
7 Acknowledgments
We thank the Referee, C. Popescu, for pointing to us an important inconsistency in the former version of the paper and for several suggestions and comments which allowed us to significantly improve the paper.
For this work the authors made use of the SIMBAD database, operated at CDS, Strasbourg, France, and of the NASA/IPAC Extragalactic Database (NED) which is operated by the JPL, CALTECH, under contract with NASA.
EP and LM acknowledge the support of grant ANR-06-JCJC-0141.
References
- Aguirre et al. (2001) Aguirre, A., Hernquist, L., Schaye, J., Katz, N., Weinberg, D., and Gardner, J. 2001, ApJ 561, p521
- Arnaud (1996) Arnaud, K. A. 1996, Astronomical Data Analysis Software and Systems V, A.S.P. conference Series, Vol. 101, p17
- Arnaud & Evrard (1999) Arnaud, M., and Evrard, A. 1999, MNRAS 305, p631
- Arnaud (2005) Arnaud, M. 2005, in ”Background Microwave Radiation and Intracluster Cosmology”, Edited by F. Melchiorri and Y. Rephaeli. Proceedings of the International School of Physics ”Enrico Fermi”, Course CLIX, Part of the Italian Physical Society series. ISBN 1-58603-585-1 (IOS); ISBN 88-7438-025-9 (SIF); Library of Congress Catalog Card No. 2005937974. Published by IOS Press, The Netherlands, and Societ Italiana di Fisica, Bologna, Italy, 2005, p77
- Bai et al. (2006) Bai, L., Rieke, G., Rieke, M., Hinz, J., Kelly, D., and Blaylock, M. 2006, ApJ 639, p827
- Bai et al. (2007) Bai, L., Marcillac, D., Rieke, G., Rieke, M., Tran, K., Hinz, J., Rudnick, G., Kelly, D., and Blaylock, M. 2007, ApJ 664, p181
- Bai et al. (2007b) Bai, L., Rieke, G. and Rieke, M. 2007, ApJ 668, L5
- Bohringer et al. (2004) Bohringer, H., Schuecker, P., Guzzo, L., Collins, C.A., Voges, W., Cruddace, R.G., Ortiz Gil, A., Chincarini, G., De Grandi, S., Edge, A.C., MacGillivray, H.T., Neumann, D.M., Schindler, S., Shaver, P. 2004, A&A 425, p367
- Bovy, Hogg & Moustakas (2008) Bovy, J., Hogg, D. W. and Moustakas, J. 2008, submitted to ApJarXiv0805.1200.
- Cazaux & Tielens (2002) Cazaux, S. and Tielens, A. 2002, ApJL 577L, p127
- Chelouche, Koester & Bowen (2007) Chelouche, D., Koester, B. and V. Bowen, D. 2008, accepted in ApJ L, arXiv 0711.1167
- Elfgren & Désert (2004) Elfgren, E., and Désert, F.-X. 2004, A&A 425, p9
- Elfgren, Désert & Guiderdoni (2007) Elfgren, E., Désert, F.-X., and Guiderdoni, B. 2007, A&A 476, p1145
- Désert, Boulanger & Puget (1990) Désert, F.X., Boulanger, F. and Puget, J.L. 1990, A&A 237, p215
- Gal et al. (2003) Gal, R., de Carvalho, R., Lopez, P., Djorgovski, S., Brunner, R., Mahabal, A. and Odewahn, S.2003, A.J. 125, p2064
- Dwek, Rephaeli & Mather (1990) Dwek, E., Rephaeli, Y. and Mather, J., 1990, ApJ350, p104
- Gioia et al. (2004) Gioia, I. M., Braito, V., Branchesi, M., Della Ceca, R., Maccacaro, T. and Tran, K. V. 2004, A&A, 419, 517
- Gould & Salpeter (1963) Gould, R. and Salpeter, E., ApJ138, p393
- De Jong (1977) de Jong, T 1977, A&A 55, p137
- Hinz et al. (2006) Hinz, J. L., Misselt, K., Rieke, M.J., Rieke, G.H., Smith, P.S., Blaylock, M. and Gordon, K.D. 2006, ApJ, 651, p874
- Kampakoglou, Trotta & Silk (2008) Kampakoglou, M., Trotta, R., and Silk, J. 2008, MNRAS 384, p1414
- Koester et al. (2007) Koester, B.P., Mckay, T.A., Annis, J. et al. 2007, ApJ 660, p239
- Kotov & Vikhlinin (2005) Kotov, O., and Vikhlinin, A. 2005, ApJ 633, p781
- Lagache, Puget & Dole (2005) Lagache, G., Puget, J.L., and Dole, H. 2005, ArAA 43, p727
- Le Floc’h et al. (2005) Le Floc’h, E., Papovich, C., Dole, H. et al. 2005, ApJ 632, p169L
- Maughan (2007) Maughan, B. J. 2007, ApJ, 668, p772
- Montier & Giard (2004) Montier, L., and Giard, M. 2004, A&A 417, p401
- Montier & Giard (2005) Montier, L., and Giard, M. 2005, A&A 439, p35
- Miville-Descênes & Lagache (2005) Miville-Descênes, M.A., and Lagache, G. 2004, ApJS 157, p302
- Muller et al. (2008) Muller, S., Wu, S.Y., Hsieh, B.C., Gonzalez, R., Loinard, L., Yee, H., Gladders, M. 2008, ApJ680, p975
- Neumann et al. (2003) Neumann, D. M., Lumb, D. H., Pratt, G. W., & Briel, U. G. 2003, A&A, 400, 811
- Popescu et al. (2000) Popescu, C., Tuffs, R., Fischera, J., and Völk, H. 2000 A&A 354, p480
- Popescu et al. (2002) Popescu, C. C., Tuffs, R.J., Völk, H.J., Pierini, D. and Madore, B.F. 2002, ApJ, 567, p221
- Pratt et al. (2008) Pratt, G., W., et al. 2008, private communication, to be submitted.
- Rykoff et al. (2008) Rykoff, E. S., McKay, T.A., Becker, Evrard, A., Johnston,D.E., Koester, B.P., Rozo, E., Sheldon, E.S., and Wechsler, R.H. 2008, ApJ 675, p1106
- Sauvage, Tuffs & Popescu (2005) Sauvage, M., Tuffs, R., and Popescu, C., 2005, Space Science Reviews vol 119, p313.
- Schneider et al. (2006) Schneider, R., Omukai, K., Inoue, A., and Ferrara, A. 2006, MNRAS 369, p1437
- Schechter (1976) Schechter, P. 1976, ApJ 203, p297
- Spitzer (1978) Spitzer, L. 1978, ”Physical Processes in the interstellar Medium”, Wiley & Sons, p7
- Stickel et al. (1998) Stickel, M., Lemke, D., Mattila, K., Haikala, L.K. and Klaas, M. 1998, A&A 329, p55
- Stickel et al. (2002) Stickel, M., Klaas, U., Lemke, D., and Mattila, K. 2002, A&A 383, p367
- Vikhlinin et al. (2008) Vikhlinin, A., Burenin, R.A., Ebeling, H., Forman, W.R., Hornstrup, A., Jones, C., Kravtsov, A.V., Murray, S.S., Nagai, D., Quintana, H. and Voevodkin, A. 2008, submitted to ApJ, ArXiv e-prints, 805, arXiv:0805.2207
- Voit (2005) Voit, G. M. 2005, Reviews of Modern Physics, 77, p207
- Weingartner, Draine & Barr (2006) Weingartner, J., Draine, B. T. and Barr, D. 2006 ApJ, 645, p1188