A STUDY OF H2 EMISSION IN THREE BIPOLAR PROTO-PLANETARY NEBULAE: IRAS 165944656, HEN 3401, AND ROB 2211affiliation: This work was based on observations with the NASA/ESA Hubble Space Telescope, obtained at the Space Telescope Institute, which is operated by AURA, Inc., under NASA contract NAS5-26555. 22affiliation: The paper is based on observations obtained at the Gemini Observatory, which is operated by the Association of Universities for Research in Astronomy, Inc., under a cooperative agreement with the NSF on behalf of the Gemini partnership: the National Science Foundation (United States), the Particle Physics and Astronomy Research Council (United Kingdom), the National Research Council (Canada), CONICYT (Chile), the Australian Research Council (Australia), CNPq (Brazil) and CONICET (Argentina).
Abstract
We have carried out a spatial-kinematic study of three proto-planetary nebulae, IRAS 165944656, Hen 3-401, and Rob 22. High-resolution images were obtained with NICMOS on the HST and high-resolution spectra were obtained with the Phoenix spectrograph on Gemini-South. IRAS 165944656 shows a “peanut-shaped” bipolar structure with emission from the walls and from two pairs of more distant, point-symmetric faint blobs. The velocity structure shows the polar axis to be in the plane of the sky, contrary to the impression given by the more complex visual image and the visibility of the central star, with an ellipsoidal velocity structure. Hen 3-401 shows the emission coming from the walls of the very elongated, open-ended lobes seen in visible light, along with a possible small disk around the star. The bipolar lobes appear to be tilted 1015 with respect to the plane of the sky and their kinematics display a Hubble-like flow. In Rob 22, the appears in the form of an “S”-shape, approximately tracing out the similar pattern seen in the visible. is especially seen at the ends of the lobes and at two opposite regions close to the unseen central star. The axis of the lobes is nearly in the plane of the sky. Expansion ages of the lobes are calculated to be 1600 yr (IRAS 165944656), 1100 yr (Hen 3-401), and 640 yr (Rob 22), based upon approximate distances.
1 INTRODUCTION
Proto-planetary nebulae (PPNs) are objects in transition between the asymptotic giant branch (AGB) and planetary nebula (PN) stages of stellar evolution. Studies over the past decade, particularly imaging studies with the Hubble Space Telescope (HST), have shown that this transition stage is key to understanding the shaping of PNs (Balick & Frank, 2002). In the interacting stellar winds model (Kwok, 1982), which was later generalized to include an equatorial density gradient (Balick, 1987), it was assumed that a fast wind from the central star interacted with the detached, slowly-moving remnant AGB envelope to shape the nebula. HST images of PPNs show that many and perhaps most of them display a basic bipolar structure (Ueta et al., 2000; Su et al., 2001; Sahai et al., 2007; Siíodmiak et al., 2008). These are shapes that appear to be further developed in the PN stage. In addition, a point symmetry is often seen; Sahai & Trauger (1998) attribute this to collimated jets, which may be episodic and change their direction, and which they advocate as the main shaping agents of PNs.
Studying in PPNs is one of the best ways to probe the presence of a fast, perhaps collimated, post-AGB wind and its effect in shaping the nebula. is the main constituent of the detached circumstellar envelope around a PPN. While a fast wind (V100 km s-1) has the energy to dissociate the on direct impact, it can also produce shocks in the medium that move at a slower speed and collisionally excite the . Recent surveys have shown the presence of shock-excited in bipolar PPNs (García-Hernández et al., 2002; Kelly & Hrivnak, 2005). Detailed high-resolution studies have been published of approximately a half dozen PPNs (Sahai et al., 1998; Kastner et al., 2001; Cox et al., 2003; Davis et al., 2005; Hrivnak et al., 2006; Van de Steene et al., 2008).
In this paper we present the results of a detailed emission study of three bipolar PPNs, IRAS 165944656 (“Water Lily Nebula”), Hen 3401 (IRAS 101785958), and Rob 22 (IRAS 101975750). All three have relatively hot central stars for PPNs, B and A spectral types, and all possess large infrared excesses due to circumstellar dust (Parthasarathy & Pottasch, 1989; García-Lario et al., 1999a). All three are or would be classified as DUPLEX (“DUst Prominent, Longitudinally-EXtended”) nebulae in the classification system of Ueta et al. (2000, see also ()).
Rob 22 has a nebula that looks like a pair of butterfly wings. At high spatial resolution, the lobes show a filamentary structure in visible light. In addition to bipolar structure, some point symmetry is apparent in the lobes. A large halo extends out to 25 (Sahai et al., 1999a). The nebula appears to be viewed essentially edge on, with a dark lane obscuring the star in visible light. In the more detailed morphological classification system of Sahai et al. (2007), this object is classified as Bcw,ml,ps(s),h(e): bipolar nebula with closed lobes, central obscuring waist, minor lobes present, point-symmetric shape, and enlongated halo. The spectral type is A2 Ie, based on light reflected off the lobes of the nebula (Allen, 1978). The circumstellar envelope appears to have a dual chemistry, with an oxygen-rich region evidenced by OH maser emission (OH284.18-0.79; Allen, Hyland, & Caswell, 1980) and crystalline silicate emission (Molster et al., 2002) and a carbon-rich region evidenced by PAH emission (Molster et al., 1997).
The nebula of Hen 3-401 possesses long, narrow lobes. It seems to be viewed at a slightly larger angle with respect to the plane of the sky, with the central star appearing faintly between the lobes (Sahai et al., 1999b). The morphological classification of this object is Bow*(0.6),sk: bipolar nebula with open lobes, central obscuring waist with star evident (at 0.6 m), with a skirt-like structure (Sahai et al., 2007). The spectral type of the star is Be, and the spectrum shows strong Balmer emission lines and lots of permitted and forbidden low-excitation emission lines (Allen, 1978; García-Lario et al., 1999b). The circumstellar envelope appears to be carbon-rich, since it shows CO emission (Loup et al., 1990; Bujarrabal & Bachiller, 1991) and PAH emission (Parthasarathy et al., 2001) but not OH (Silva et al., 1993) emission or crystalline silicates (Parthasarathy et al., 2001).
In IRAS 165944656, the star is clearly seen and relatively bright compared to the nebula, giving the impression that the nebula is at a larger orientation angle. The nebula has the appearance of a basic bipolar structure with a pronounced point symmetry, consisting of three pairs of oppositely-directed, slightly curved, thin lobes. Also seen is a smaller elliptical structure oriented from northwest to southeast (Hrivnak, Kwok, & Su, 1999). The morphological classification of this object is Mcw*(0.6),an,ps(m,an),h(a): multipolar nebula with closed lobes, central obscuring waist with star evident (at 0.6 m), ansae present, point symmetry with two or more pairs of diametrically opposed lobes and with ansae, and a halo with centrosymmetric arcs (Sahai et al., 2007). Its spectrum shows Balmer emission lines (García-Lario et al., 1999a) and has been classified as B7 based on the H line (Van de Steene, Wood, & van Hoof, 2000). Reyniers (2002), on the basis of high-resolution spectra, fit the spectrum with Teff=14,000 K and logg=2.1, slightly hotter than Ori (B8 I); this indicates a spectral type of B5-7 Ie. He also observed many emission lines. The nebula appears to be carbon rich, showing PAH features and displaying the 21 m and 30 m features seen in carbon-rich evolved stars (García-Lario et al., 1999a; Volk et al., 2002). Van de Steene et al. (2008) recently published a detailed kinematic and morphologic study of this object using H2 emission, and we will refer to their results in the present study.
We begin with an examination of the high-resolution images (see Sahai et al. (2000) for preliminary images of Rob 22 and Hen 3401 and Hrivnak et al. (2004) for preliminary images of IRAS 165944656), then present new high-resolution, long-slit spectra, and then follow with a discussion of the kinematics. From these, we are able to determine properties of the collimated winds in these three PPNs and how they have shaped the surrounding nebulae.
2 HIGH-RESOLUTION H2 IMAGING OBSERVATIONS
High-resolution near-infrared imaging observations of the three PPNs were obtained with the Hubble Space Telescope (HST) and the Near-Infrared Camera and Multiobject Spectrometer (NICMOS) camera 2 (NIC2). The camera has a resolution of and a field of view of 195 193. Observations were made with a narrow-band filter (F212N) and also with an adjacent continuum filter (F215N) for the purpose of distinguishing the 10 S(1) emission from the scattered starlight.
Hen 3-401 and Rob 22 were observed on 1998 under General Observer program ID No. 7840 (PI: Kwok) using the original HST NICMOS camera. Observations were also made with the F160W (H) and F222M (K) filters for both of these objects. IRAS 165944656 was observed in 2002 under General Observer program ID No. 9366 (PI: Hrivnak) using the refurbished HST NICMOS camera. Observations were also made with the F110W (J) filter. The observing log is listed in Table 1.
The data were taken in the multiple non-destructive mode (MULTIACCUM) to obtain a high dynamic range without saturating the detector. Three sets of observations were made through each filter at each position on the array, and each target was imaged at three (Hen 3-401, Rob 22) or four (IRAS 16594-4656) different positions of the NIC2 array using a predefined dither pattern.
The data were processed using the standard NICMOS calnica pipeline, which applied bias subtraction, dark subtraction, flat-fielding, and cosmic ray removal. The more recent data for IRAS 165944656 were re-calibrated using the HST archival On-the-Fly Reprocessing system, which provides recalibration using the most up-to-date reference files. The individual files were then corrected for the “pedestal effect” using IRAF/STSDAS pedsub task to flattening the sky value in the four quadrants of the NIC2 array. We then combined the twelve images with each filter using the IRAF STSDAS/Dither package with the parameters suggested in the HST Dither Handbook (Koekemoer et al., 2002). The data for Hen3401 and Rob 22, which were taken and reduced earlier, were reduced with the same philosophy but in a more manual fashion, as described by Su et al. (2003).
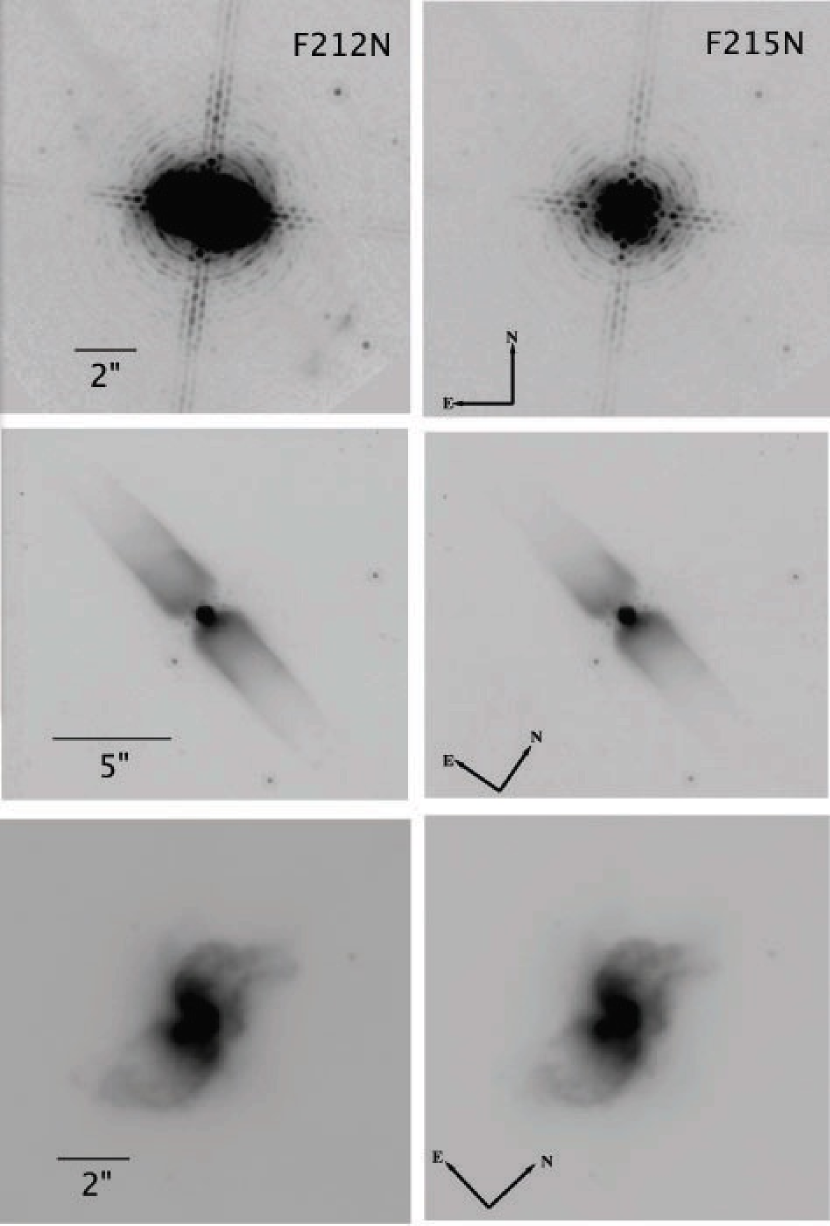
The reduced F212N and F215N images were then flux calibrated using the appropriate calibration values for each filter before and after the NICMOS refurbishing. These calibration values are listed in Table 2. The individual F212N and F215N images for the three PPNs, with the thermal backgrounds removed, are displayed in Figure 1.
For IRAS 165944656, the relatively-bright central star is surrounded by a distinct peanut-shaped nebula in the F212N image, while only some smaller and fainter nebulosity surrounds the star in the F215N image. Thus one can immediately see that most of the nebular light in the F212N image is due to the emission rather than scattered starlight. One can also see faint emission from two of the pairs of longer, thin lobes, with brighter emission (“ansae”) at their ends. For Rob 22, the F212N and F215N images appear rather similar. They each show, rather than a central star, emission coming from two closely-spaced regions separated by a dark equatorial band. These bright regions may represent light from the central star scattered toward us from above and below an obscuring disk or torus. The two bright regions lie roughly along the line that connects the approximately point-symmetric outer ends of the two lobes. The dark space between the two bright regions might thus be due to the torus. The nebula appears to be a little brighter in the F212N image than in the F215N image, especially in the outer regions, indicating that in the F212N image the nebula is seen mostly in scattered light but with some contribution from emission. For Hen 3401, the nebula is seen more clearly and is larger in the F212N image than in the F215 image, indicating that in the F212N image, it is seen in both scattered light and emission. The star is bright in each image.
3 H2 IMAGES
To produce images of these three PPNs showing only emission requires the removal of the scattered light from the F212N image, which can be accomplished through the subtraction of an appropriately scaled image of the adjacent continuum (F215N image). The scaling is necessary to correct for differences in the source continuum in the two bandpasses. Differences due to the filter profiles and detector response were corrected by the flux calibration. In a similar previous study (Hrivnak et al., 2006), we examined the question of how best to scale the F215N continuum image for subtraction from the F212N image to remove the scattered continuum light. The object of that study, IRAS 171503224, had no other emission lines in these two bandpasses, and thus a simple correction for the continuum levels was appropriate. In these cases, we also need to be concerned about other emission features which may be contributing to the flux in the two filters.
In the following sub-sections we discuss the details of the continuum removal and the resulting image for each object.
3.1 IRAS 165944656
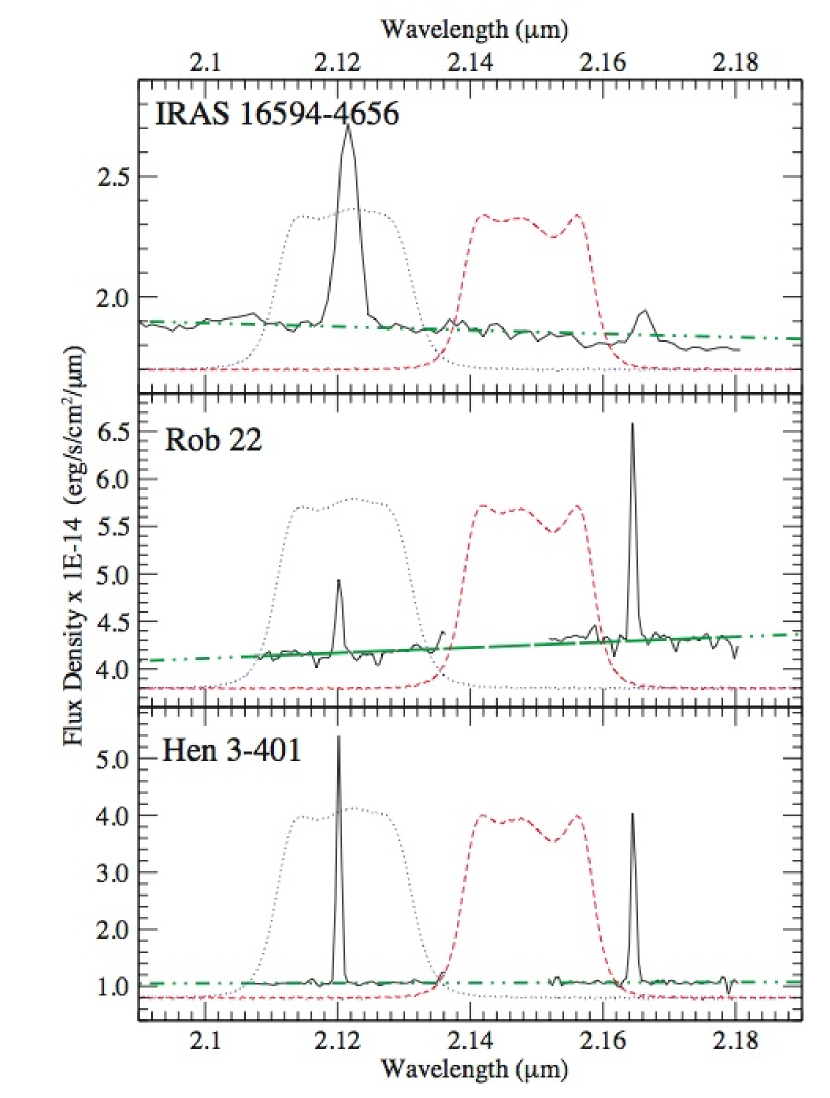
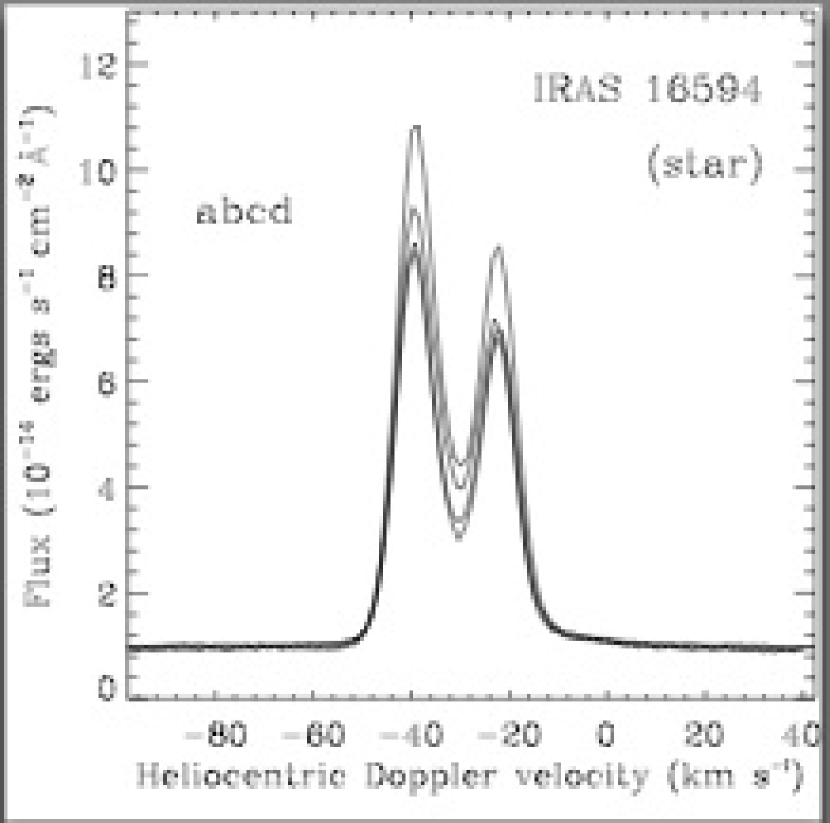
A spectrum for IRAS 165944656 in the 2 m region (2.102.27 m) has been published by Van de Steene & van Hoof (2003). It was obtained with a long slit 10 wide and oriented E-W. The spectrum shows a relatively strong feature at 2.12 m with a much weaker Br emission line. Since the Br is at a wavelength that places it at the edge of a wing of the F215N filter profile, its contribution is insignificant in this image. This is illustrated in Figure 2, which shows the spectrum of the object plotted together with the filter profiles. Thus, for the continuum removal, we convolved a linear fit to the observed spectral continuum (with the emission removed) with the filter profiles and the detector response using the STSDAS/SYNPHOT calcphot task. This resulted in a scale factor of 1.016 that we used to scale the F215N image prior to subtraction of the flux-calibrated images.
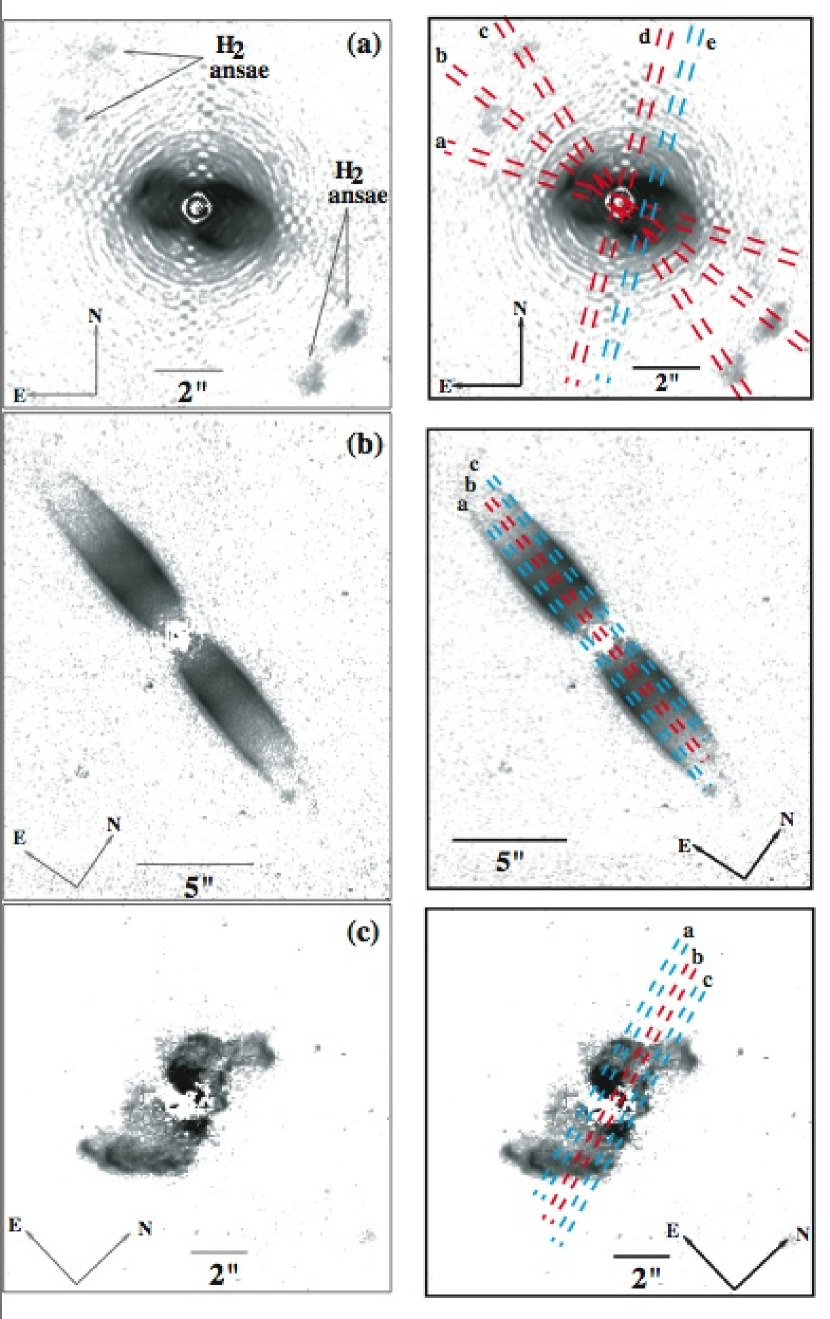
The resultant image of IRAS 165944656 is displayed in Figure 3a. It shows a limb-brightened, double-lobed bipolar structure with the west lobe larger and brighter (ratio of 1.6) than the east lobe. Approximate sizes (10 level) are 26 by 28 for the west lobe and 22 by 25 for the east lobe. In addition, one can see two pairs of more distant -emitting ansae, each pair collinear on a line passing through the star. The ansae to the SW are brighter and farther from the star than those to the NE, with distances of 62 and 54 for the ansae at PA=33 and of 58 and 47 for the those at PA=54. These ansae are found at the ends of the thin lobes seen in the visible light images (Hrivnak, Kwok, & Su, 1999; Su et al., 2001), and will be discussed together with the visible image in Section 5. The emission at the position of the star appears to approximately cancel out, indicating that there is little, if any, emission from the star.
3.2 Hen 3-401
Spectra of the 2.12 m line and the Br line of Hen 3-401 have been published by García-Hernández et al. (2002). They observed this object twice with a 45-wide slit oriented at P.A. = 70 and 90, approximately along the bipolar axis, and they found the emission to be clearly extended. The line is stronger than the Br line by about a factor of 1.5, and since the latter lies in the wing of the F215N filter, its contribution to the flux in the F215N image is very small. This is illustrated in Figure 2. Neglecting the contribution of the line results in a scale factor of 0.994 (the spectrum is essentially flat in this region).
The resulting image of Hen 3-401 is shown in Figure 3b. emission extends along the two almost cylindrical, slightly barrel-shaped lobes, each with a size of 25 10. The east lobe is brighter, with a ratio of 1.2. The two lobes are limb-brightened and appear to be brightest 2553 (E) and 1543 (W) from the star. The ends of the lobes are open. Little, if any, of the emission appears to come from the central star.111García-Lario et al. (1999b) previously displayed the HST data, using a scale factor based upon the field stars, and obtained a similarly appearing image.
3.3 Rob 22
Rob 22 was also observed spectroscopically in this region by García-Hernández et al. (2002). They observed with the slit oriented at P.A. = 90, in this case almost perpendicular to the bipolar lobes. With a slit width of 45, they likely included most of the nebula but missed some of the emission from the very ends of the lobes. Their spectra show the Br line to be stronger than the H2 2.12 m line by about a factor of 2.5, but since it still falls on the extreme edge of the filter profile, its contribution will be small. Nevertheless, we examined the scaling of the F215N image with and without consideration of this emission line. Neglecting the contribution of the line results in a scale factor of 0.979, while including it results in a scale factor of 0.967. We will use the scale factor with the line included, but note that the difference is only at the 1% level. Note, however, that the difference can be larger in localized regions, since the Br and H2 emissions likely have different distributions.
The resulting image of Rob 22 is shown in Figure 3c. The nebula appears to have somewhat of a point-symmetric “S” shape, with a bright clump in the inner part of each lobe near the position of the unseen central star (clump to the NE is brighter) and a ridge of along the the end of each lobe (especially the S lobe). The north lobe is brighter, with a ratio of 1.2. Much of the extended structure within a few arcsec of the star disappears after continuum subtraction, indicating that the features at the bases of the polar lobes nearest the star are due to scattered light from a dusty flared disk or torus, not H2 emission.
4 HIGH-RESOLUTION SPECTRA
4.1 Observations and Reduction
High dispersion, long-slit spectral observations were made of the three sources in the =10 S(1) line at 2.1218 m using the near-infrared echelle spectrograph Phoenix (Hinkle et al., 1998) on the 8-m Gemini-South telescope on Cerro Pachon, Chile. Phoenix has a 1024256 InSb detector with a pixel scale of 0085 1.26 km s-1 at a wavelength of 2 . The slit width was 034, providing an effective velocity resolution of 6 km s-1 (R50,000). The spectrum covers a range of 1300 km s-1 (0.0086 m) centered on this line. The area of the sky projected by the long slit onto the detector is 134 in length, so for the observations of IRAS 165944656 and Hen 3-401, more than one exposure was taken moving along the slit, yielding a longer effective slit to cover each target. The observations were made in 2003 under three queue observing programs (GS-2002B-Q-53, GS-2003A-Q-27, GS-2003B-Q-41). Image quality on the different nights varied from 07 to 10 as measured in the R band.
Several spectra were obtained for each of the PPNs at various positions. For each object, one spectrum was taken with the slit oriented through the star along the major axis of the lobes. Additional spectra were taken at various offsets and orientations. For IRAS 165944656, two of the slit positions were oriented to pass though the star and the pairs of clumps. An observing log listing the slit positions is given in Table 3, and the orientations of the slit for these various observations are shown in Figure 3.
The weather for these observations was mostly clear, although some patchy clouds were present during observations of Rob 22 and IRAS 165944656. Sky subtraction was accomplished by obtaining one exposure of blank sky near each source immediately before or after a pair of exposures of the target. Spectral flat fields were obtained using an internal quartz emission lamp. For each target, a bright standard star was observed on the same night with the same grating setting in order to correct for telluric absorption and for flux calibration. Numerous telluric lines were also used for wavelength calibration, adopting the telluric spectrum available from NOAO222ftp://ftp.noao.edu/catalogs/arcturusatlas/ir/. We calculated the apparent velocities adopting a rest wavelength of 21218.356 Å for the H2 =1–0 S(1) line (Bragg, Brault, & Smith 1982), and these velocities were then corrected to a heliocentric reference frame. Uncertainty in the resulting velocities is roughly 1 km s-1, dominated by scatter in the dispersion solution for the numerous telluric lines across the observed wavelength range.
4.2 Position-Velocity Diagrams
4.2.1 IRAS 165944656
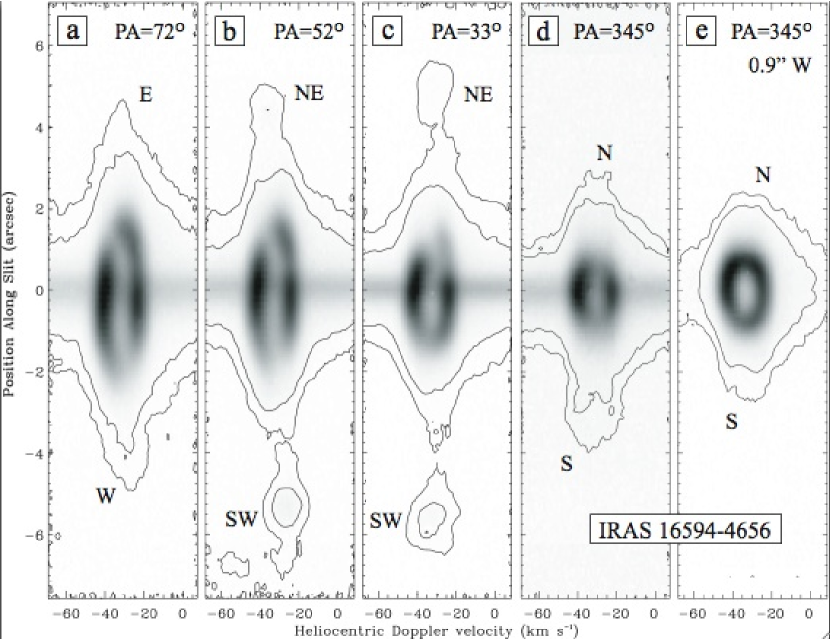
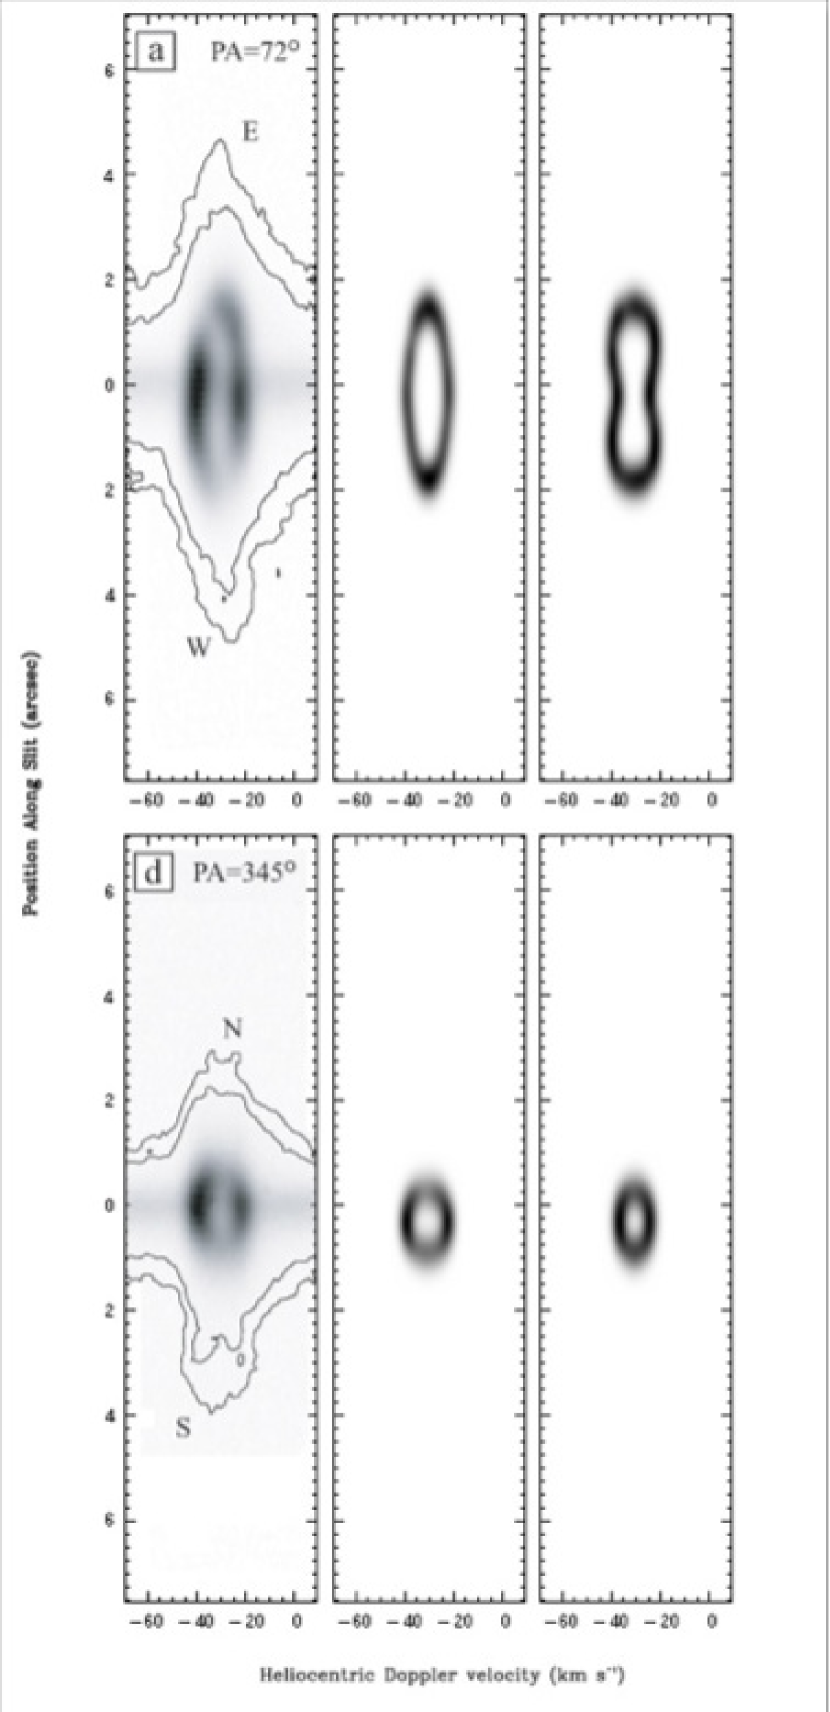
Spectra of IRAS 165944656 were obtained at five different positions on the nebula, as illustrated in Figure 3. The resulting position-velocity (PV) diagrams are shown in Figure 4. In all cases the brightest emission displays a closed ellipse, but with different sizes and strong variations in intensity around the ellipse. In slit position a (PA=72), which is along the major bipolar axis, and slit position b (PA=52), which is rotated 20 from the major axis, the inner ellipses seem to be tilted slightly, with the W-SW lobe slightly blue-shifted compared to the E-NE lobe. However, this is a small effect, and the polar axis appears to lie very close to the plane of the sky.
Slit positions c (PA=33) and d (PA=345) also pass through the star, but are oriented closer to the minor axis (slit position d is along the minor axis), and the size of the bright inner ellipse is correspondingly smaller. Slit position e (PA=345) is parallel to the minor axis but offset from the star through the larger W lobe. The PV diagram at this position is consistent with a slice through a shell expanding with a velocity of 8-9 km s-1 and with the N side brighter.
Intensity contours are shown in Figure 4 to display the faintest emission levels. Slit position a shows that the emission extends 5″ along the major axis. Slit positions b and c pass through the clumps at the ends of extended arms in the nebula, and in both spectra these clumps are seen in emission. In slit position b, the centroid velocities of the two clumps differ by 10 km s-1 (36 to 26), with each about 5 km s-1 from the mean velocity of 30 km s-1. In slit position c, the velocity of the two clumps is about the same. These velocities can be explained by a model in which the clumps are ejected by rotating jets. The clumps at slit position b appear closer to the star than those at slit position c; this can be a result of a projection effect and/or temporal effect, assuming that they are moving outward from the central star at the same speeds. If the clumps in each point-symmetric pair began moving from the location of the star at the same time, then they should be at the same distance from the star. However, in both cases the brighter SW clumps appear farther from the star than the NE clumps, so the assumption of constant velocity for the clumps may not be correct. Alternatively, the clumps may simply be non-uniform brightness enhancements at the ends of the filaments.
The bright ellipses are consistent with limb-brightened lobes. When allowance is made for the resolution of the spectra, it appears that the interiors of the lobes are devoid of emission. In the four slit positions that include the star (Fig. 4, panels ), the blue-shifted side of the inner ellipse is brighter. This may be due to extinction within the lobes or intrinsically brighter emission from the side facing us. The elliptical morphologies of the PV diagrams for the four slit positions through the star, especially the one along the major axis, are consistent with an expanding ellipsoid. Thus they differ from the “peanut-shape” PV diagram that one might expect from two bipolar expanding bubbles. Thus the expansion along the minor axis does not appear to be significantly retarded by a constraining higher-density torus.
We investigated the velocity field in more detail using the morpho-kinematic modeling program SHAPE (Steffen & López, 2006). In this program, the morphology of the nebula and the velocity field can be specified and a resulting PV diagram produced. The shape of the nebula was assumed to be a three-dimensional symmetrical dumbbell based on the H2 (cross-sectional) image. It was then assumed that the H2 emissivity uniformly followed the contours of the nebula. We began by investigating a velocity field in which the velocity increased linearly with distance (so-called “Hubble flow”), which is seen in some PNs and is seen in Hen 3401 (Section 4.2). This produced a PV diagram that had a peanut shape, contrary to the elliptical shape seen (see Figure 5. left and right panels). When we assumed on the other hand a constant velocity (9 km s-1), the PV diagram agreed more closely with the observed ellipse but was slightly diamond-shaped. A very good fit was obtained by the addition of a slight Hubble flow, with V = (8 + 2.4r/1) km s-1, as shown in the middle panels of Figure 5. We determine, based on adding an inclination to the model, that the tilt of the polar axis is no more than 10 from the plane of the sky.
Slices in velocity across the P-V diagrams at position along the slit = 0″ (along the line of sight through the star) with width 077 are displayed in Figure 6. These show a uniform expansion of the shell with an expansion velocity of Vexp = 9 km s-1. The velocity center is at 30 km s-1. The expansion velocity of the lobe at 09 west of the star is similar; this is consistent with uniform expansion of an elliptical bubble.
These observations reveal a systemic heliocentric radial velocity of Vhel() = 30 km s-1, which translates to VLSR = 26 km s-1, with Vexp = 9 km s-1. These velocities can be compared with the millimeter-wave CO =10 emission line of VLSR(CO) = 26 km s-1 with Vexp = 16 km s-1 (Loup et al., 1990). The CO expansion represents the velocity of the outer remnant of the AGB mass loss expanding into the ambient ISM, while the expansion represents the velocity of the shock front at the edge of the inner bipolar cavity along the line-of-site direction, which is essentially perpendicular to the polar axis. The difference between these two expansion velocities appears to reflect the two different kinematic regions. Heliocentric radial velocity measurements of individual lines in the visible spectrum showed a range of 10 to 40 km s-1, with average values of 20 km s-1 for the absorption lines and 32 km s-1 for the emission lines (Reyniers, 2002).
4.2.2 Hen 3-401
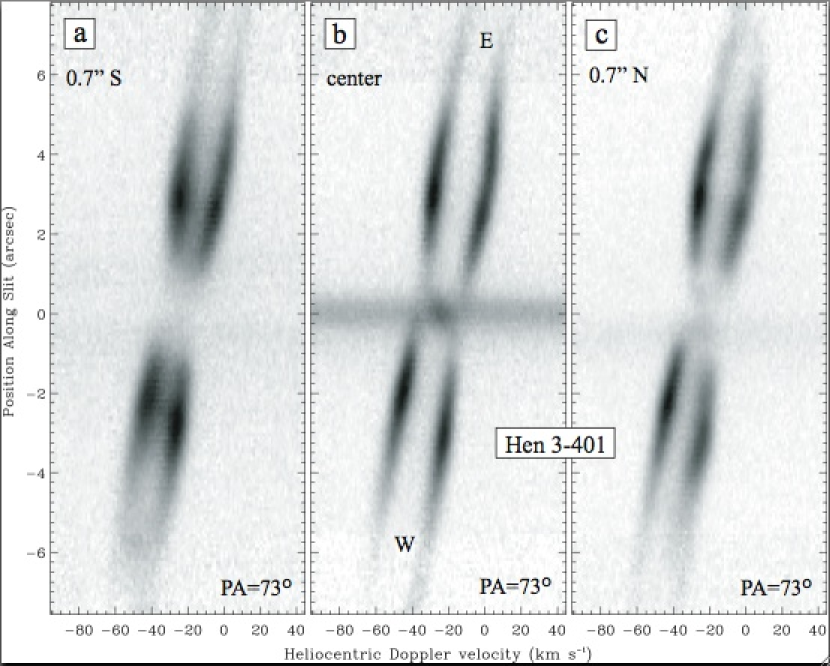
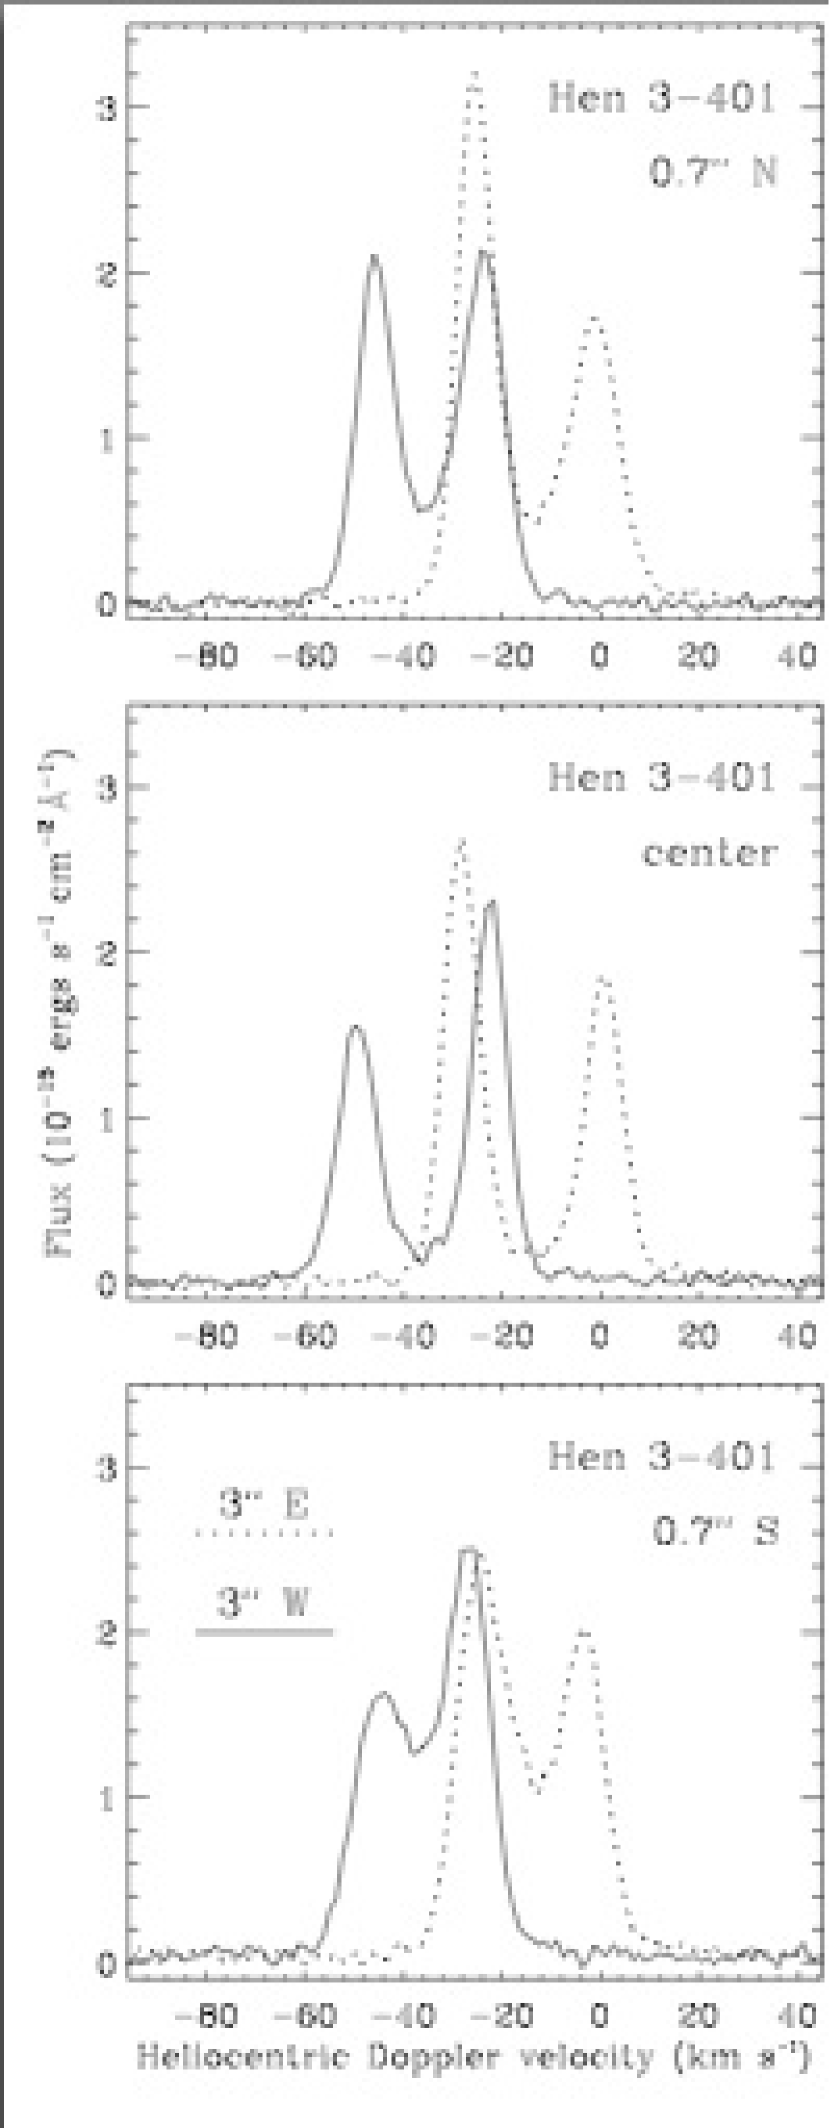
Spectra of Hen 3-401 were obtained at four different positions on the nebula. The resulting position-velocity diagrams for the three oriented along the bipolar axis are shown in Figure 7. (The fourth one, passing through the star but oriented perpendicular to the axis, showed no extended structure, only emission at the position of the star with the systemic velocity). In each of these three slit positions, we see a pair of convex arcs from each lobe. They are not closed at the ends, indicating open lobes out to at least 7″ from the star. At the two offset positions, some emission appears to partially fill the interior of the lobes; this may simply be contamination from the very edges of the lobes due to seeing.
The bipolar axis is obviously tilted from the plane of the sky, with the W lobe moving toward us, and with velocities along the lobes that are proportional to distance from the star (Hubble flow). The pairs of convex arcs represent emission from the thin front and back walls of slightly barrel-shaped lobes. The difference between the pair in each lobe is about 30 km s-1 for the slit passing through the star (Fig. 7b) but about 23 km s-1 in the two offset positions; this is consistent with seeing the radial expansion along the bipolar axis but only a projected component of it in the offset positions. If the expansion really is a Hubble flow, then the relationship between observed expansion velocities of the front and back sides of the lobes in Figure 7b compared to their apparent spatial size can constrain the dynamical age of the nebula for a given distance. If we assume axial symmetry — so that the lobes have roughly the same length-to-width ratio as in H2 images (this seems justifiable based in the similar morphology in Figures 7b and 12) — then one can stretch the PV plot in Figure 7b to have the correct aspect ratio. Figure 7b thus represents a slice through the structure of the nebula in the plane along our line-of-sight (see Smith, 2006, for a more detailed explanation in the case of the bipolar lobes of Eta Carinae). This yields a tilt of the polar axis from the plane of the sky for Hen 3-401 of roughly 15(5). In that case, the lateral expansion speed of the lobes (the radial expansion speed perpendicular to the polar axis) is V15.5(1) km s-1. In the images, the polar lobes have a width of roughly 25, which corresponds to 3.71011() km, where is the heliocentric distance in kpc to Hen 3-401. Thus, the age of the nebula would be only about 380 yr if the expansion has been ballistic. Assuming a distance of 3 kpc (Bujarrabal & Bachiller, 1991) thus yields a nebular age of 1100 yr.
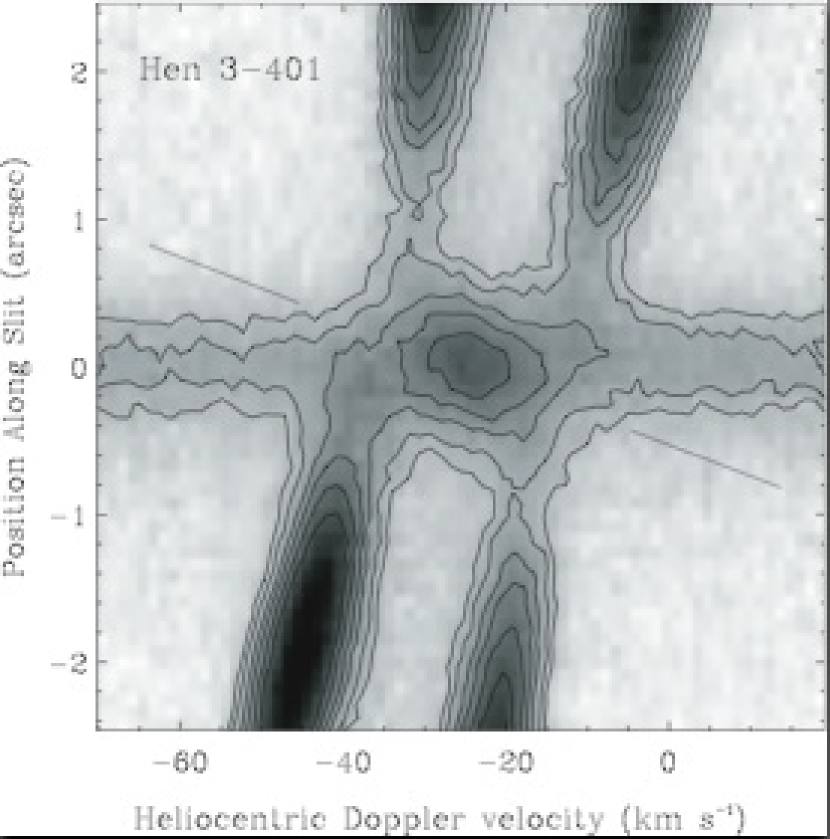
There is some weak emission coming from the star as well. In fact, the very weak central peak appears to show some extended structure, with a possible tilt i.e. it is slightly blueshifted toward the east and redshifted toward the west, as shown in Figure 8 in an expanded view of the region around the central star. This may be emission from an inner ring or disk surrounding the central star. This same type of tilted structure from the central peak is also seen in similar spectra of the young PN M 2-9. In fact, it is remarkable that all aspects of the overall kinematic structure of emission from Hen 3-401 in panel b of Figure 7 are almost identical to those of M 2-9 (Smith et al., 2005). Even the lateral expansion velocity of the lobes is roughly the same as for M 2-9. Although the apparent size of Hen 3-401 is smaller by a factor of 4.5, it distance is larger by about the same amount, so the two objects have the same size, nebular age, and overall appearance. A detailed comparison of their central stars might therefore be quite illuminating.
At most positions, emission from the far sides of the lobes is fainter than on the near side, especially where the far side is behind an area of bright emission on the near side. A similar effect is seen in M2-9, where it is probably due in part to extinction by dust in the lobes (Smith & Gehrz, 2005). However, an asymmetry does appear in the brightness of the east-west lobes of Hen 3-401, with the brighter peak from the near side closer to the star in the west lobe, position 2″ while in the east lobe it is at position 3; this is in accord with what is seen in the image (Section 3.2).
Slices in velocity across the positions and with width 026 are displayed in Figure 9. Velocity widths of the arcs are narrower along the axis (Figure 7b) than in the offset positions. This is due to projection effects in a Hubble flow. For a hollow cylinder with walls of constant thickness, the path length through the walls reaches a minimum for a sight line passing through the polar axis, translating to the smallest spread in velocity.
These observations reveal a radial velocity for the system of Vhel() = 24 km s-1 (VLSR=36 km s-1), with Vexp = 15 km s-1. These are in good agreement with the millimeter-wave CO =10 emission-line values of VLSR(CO) = 36 km s-1 with Vexp = 16 km s-1 by Loup et al. (1990) (although Bujarrabal & Bachiller (1991) measured the somewhat different value of VLSR(CO) = 28 km s-1 with Vexp = 15 km s-1 using the CO =10 and CO =21 lines).
4.2.3 Rob 22
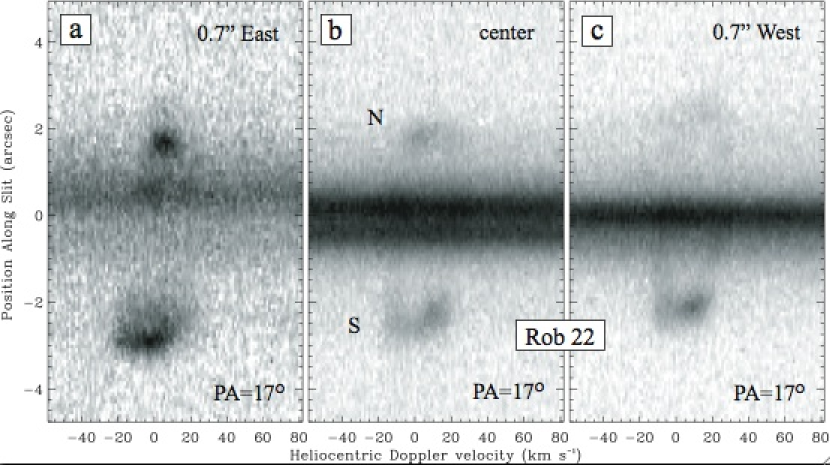
Figure 10 shows the long-slit Phoenix spectra of Rob 22, with one slit positioned along the middle of the lobes through the center of the nebula (panel b) and offset slit positions on either side. The very weak emission and the complex continuum structure in the long-slit spectra indicate that even a narrowband F212N image is actually dominated by dust structures seen in reflected continuum light. This is true over most of the nebula, with the exceptions being the N and S ends of the polar lobes. In the center slit position (b) there appear to be two continuum sources separated by 06, with the northern one the brighter, while in the slit position to the west there is one continuum source. These are consistent with the image. These continuum sources likely represent light from the obscured central star scattered toward us by regions of enhanced density. The three panels show a slight positional offset in the emission pattern, in agreement with the “S” shape of the nebula.
The spectra of the nebula show very faint emission from two hollow expanding lobes with an ellipsoidal velocity structure. The southern lobe is brighter and larger in , in agreement with the image. The nebula appears to have a polar axis very close to the plane of the sky, although the southern lobe is slightly blue-shifted and thus tilted slightly toward us. The lateral expansion speed of the lobes (difference in velocity between the front and back of the S lobe) is approximately 30 km s-1. Thus Vexp 15 km s-1 and Vhel() +5 km s-1, which transforms to VLSR 7 km s-1. These are in general agreement with the OH maser measurement of VLSR(OH) = 63 km s-1, Vexp=20 km s-1 (Allen, Hyland, & Caswell, 1980; Silva et al., 1993). However, they differ from the molecular-line CO =10 measurement of VLSR(CO)=0.1 km s-1, Vexp 35 km s-1 (Bujarrabal & Bachiller, 1991), although the investigators commented on the severe galactic CO contamination in this direction.
5 DISCUSSION
5.1 IRAS 165944656
The PV diagrams for IRAS 165944656 indicate an expanding ellipsoidal nebula with its major axis nearly in the plane of the sky. This is a different orientation and morphology than had been concluded based upon the visual images of the nebula. In the visual images (see Fig. 11a), the star appears bright and the SW lobe(s) appears brighter and perhaps larger than the NE lobe(s). This is in contrast to nebulae like AFGL 2688 (Egg nebula), IRAS 171503224, IRAS 174412411, and Rob 22, in which the star is obscured and the two lobes look more symmetrical in size, suggesting that the polar axis is very nearly in the plane of the sky. Inspection of the visual images had previously led us to conclude that IRAS 165944656 was inclined at an intermediate orientation (30) with respect to the plane of the sky with the SW lobe oriented in the direction of the observer (Su et al., 2001). Even the new image, with the SW lobe appearing larger than the NE lobe, suggests this, assuming symmetry in the lobes.
However, other more recent observations at other wavelengths support our conclusion based upon kinematics that the axis of the main bipolar lobes, as delineated in the H2 image, is nearly in the plane of the sky. A polarization study of this source (Ueta et al., 2005) indicates a hollow shell with reflection from the walls. The polarization structure is aligned with the major axis of the nebula, with low polarization perpendicular to this, suggesting the presence of a dusty torus. A high-resolution mid-infrared study clearly shows the limb-brightened ends of such a torus (Volk et al., 2006). The mid-infrared image does not show the elliptical structure expected of a torus seen at an intermediate angle, but rather shows a bar with bright ends, consistent with a torus seen nearly edge-on. The bright mid-IR emission is located at the two ends of the pinched waist seen in the H2 image, showing the presence of enhanced dust density which shapes the outflow. The approximately similar amounts of polarizations seen at opposite sides of the nebula are consistent with a nebula in which the bipolar axis is close to the plane of the sky rather than at an intermediate angle, and the authors suggest an angle of 15 with respect to the plane of the sky (Ueta et al., 2005). Thus both the polarization and mid-infrared images are consistent with the result of this kinematic study, and the corresponding one of Van de Steene et al. (2008), that the bipolar lobes are aligned nearly in the plane of the sky.
The image shows limb-brightened lobes, consistent with the idea that they were carved out by collimated outflows. Based on the angular diameter across the lobes of 20 and the measured Vexp= 9 km s-1, one can calculate an approximate expansion age for the lobes of 530 yr. Using the polar velocity determined using SHAPE, along with the angular diameter between the two ends of the bipolar lobes of 40, leads to a expansion age of 740 yr This leads to an estimated age for the lobes of 1400-1900 yr, using a distance of 2.6 kpc based on an assumed total luminosity of 104 L☉ (Hrivnak, Volk, & Kwok, 2000).
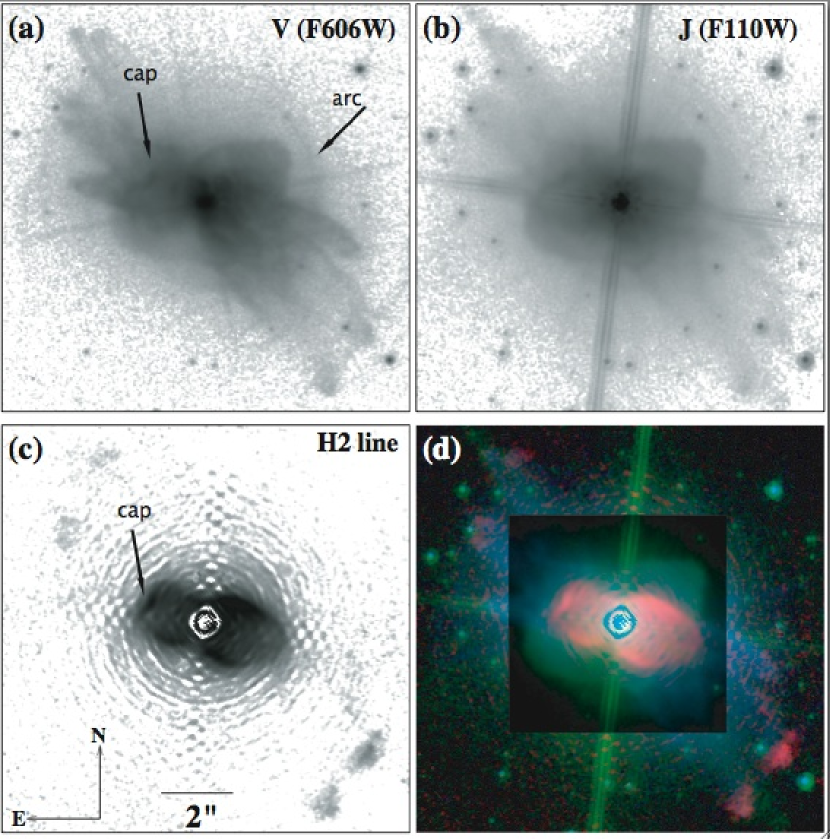
Comparing the morphology of the nebula in different wavelength regions shows several striking features. In visible light (Fig. 11a), the nebula shows a basic bipolar structure, but with a series of three pairs of point-symmetric thin lobes. Thus at this wavelength it has been classified as point-symmetric and multipolar. Portions of several circumstellar rings are also seen (Hrivnak, Kwok, & Su, 2001). In the J band (Fig. 11b) the thin lobes are present and a portion of at least one ring is seen faintly. Seen more prominently, however, is a somewhat elliptical morphology extending from the northwest to the southeast that is also present in the visible image. However, it is not actually an ellipse, since the axes are not separated by 180; the northwest lobe is at a position angle of 305 and the southeast one at 110. The published H-band image is similar (Su et al., 2003), with the star relatively brighter compared to the fainter thin lobes. The H2 image (Fig. 11c), in contrast, shows a clear bipolar, “peanut” morphology with shorter, more spherical lobes. The major axis is at a position angle of 75 with the west lobe larger. Some of the structures that define these peanut-shaped lobes can be seen upon close examination in the V and H images. Among these is the bright “cap” at the end of the eastern lobe. As mentioned earlier, the mid-IR images at 10 and 20 m reveal two bright regions just outside the pinched waist of the “peanut.” The mid-IR emission also faintly delineates the edges of the two peanut-shaped lobes seen in H2. Volk et al. (2006), in comparing the mid-IR images to this H2 image, concluded that the coincidence of the faint mid-IR emission with the H2 emission from the walls of these lobes suggested that the mid-IR emission was likely partially shock heated. The walls of these peanut-shaped lobes are clearly outlined in polarized light (Ueta et al., 2007), agreeing with the position of the dust seen in the mid-IR.
In a composite image (Fig. 11d), we see the enhanced H2 emission from the walls of the peanut-shaped bipolar lobes and the H2 at the ends of the long, thin lobes. The non-uniformity in the emission from the walls may indicate lower density regions, through which jets may have carved holes from which the long, thin lobes may have emerged. This composite image also shows clearly several different structures seen in this object at different wavelengths, reinforcing the idea that the morphology of this nebula is more complex than simply symmetric bipolar lobes. It is more complex than either of the other PPNs of this study.
In their excellent study of this object, Van de Steene et al. (2008) used their long-slit H2 spectra together with our spectra (from the archive) to produce channel maps and from these to determine a more detailed three-dimensional image of the shell structure of IRAS 165944656. While it basically consists of two hollow bipolar lobes joined at the waist, it is more complex, with some holes and extended structures (see their Fig. 8). These correspond to the brightness variations and the “cap” seen in our H2 image. They also analyzed [OI] and [CI] emission lines, and making the reasonable assumption that these lines were produced in the same shock as the H2 lines, they used these as diagnostics of the physical conditions in the shock region. From these, they deduce that the emission arises in very high density regions, 3 106 ne 5 10m-3. At these conditions of density, temperature (Trot1400 K; Van de Steene & van Hoof, 2003), and velocity (8 km s-1), the excitation can be due to either C-type or J-type shocks (Van de Steene et al., 2008). They also made long-slit observations of the [FeII] 1.645 m emission line, which indicate that this emission arises, not in the lobes, but from a wind close to the star.
5.2 Hen 3-401
This nebula is very highly collimated, with the lobes extending 145 from the central star with a length to width ratio for each lobe of 7. The lobes in this object do not appear to be closed, but rather have “tattered” ends. The PV diagrams show a Hubble flow in the velocity in the lobes. This can arise due to an eruptive ejection (ballistic motions) or (self-similar) hydrodynamic growth patterns (Balick & Frank, 2002). The velocities show that the eastern lobe is tilted away from us and the western lobe toward us. From the complementary image and spectroscopy, an estimate can be made of the velocity at the ends of the lobes and the inclination angle of the bipolar axis. With the measured length of the open-ended lobes of 145 and the width of 22 (from the sharpened V image, Sahai et al., 1999b), and the lateral lobe expansion velocity of 15.5 km s-1, one can calculate a minimum expansion velocity at the ends of the lobes of 200 km s-1. The PV diagram along the bipolar axis (Fig. 7b) shows that the velocity at the ends of the two lobes differ by 20 km s-1 from that of the star. This implies an inclination angle of 6 to the plane of the sky. This is somewhat smaller than we found from the appearance of the PV diagram in Section 4.2.2, but both clearly indicate a small inclination angle.
In visible light, a “skirt” structure is seen surrounding the inner parts of the bipolar lobes and extending coaxially with the lobes for 3 from the star (discussed by Sahai et al., 1999b). This skirt also appears in the H-band image but not in H2. This is seen in Figure 12. The western lobe is the brighter in scattered light, with brightness ratios in the different bands of 2.4 (V; Sahai et al., 1999b), 1.4 (J), and 1.4 (2.15 ). If one assumes an intrinsic symmetry in the two lobes, then this suggests some obscuration by an extended equatorial disk. In contrast, the eastern lobe is brighter in , with a ratio of 1.2. This may be a result of the differing local shock conditions in the nebula. There is a suggestion of a torus from the optical image (Sahai et al., 1999b) and from the polarization measurements (Scarrott & Scarrott, 1995; Ueta et al., 2007). A recent high-resolution mid-infrared imaging study shows that the mid-IR emission arises mostly from a 1 core, with weaker emission arising from the walls extending out to about 3 from the star (Muthumariappan, Kwok, & Volk, 2006). These authors suggest that the core contains a flared disk, based upon the temperature gradient detected in the core.
In the H band, the star is more prominent than in the visible and the inner region of the lobes is slightly less prominent. In visible light, there is a bright inner edge to the lobes, with enhanced light out to the ends of the skirt. This is also seen in the H band but not the H2 image. A faint halo is seen in both the visible and H-band images. The H2 emission is particularly bright 2.05.5 from the star. These different regions of brightness are seen in the composite image (Fig. 12d).
Based upon the extremely large intensity ratio of the 10 S(1) to 21 S(1) line of 26 (García-Hernández et al., 2002), it is clear that the excitation mechanism is due to shocks. These presumably arise as the fast wind, that carved out the narrow lobes, produces shocks in the walls that excite the . H wings are observed to extend out to 1600 km s-1 (García-Lario et al., 1999b).
The young PN M 2-9 is very similar to Hen 3-401 in visible appearance, as has been remarked upon by García-Lario et al. (1999b), and also in its mid-infrared appearance (although with not quite as pinched a waist; Smith & Gehrz, 2005) and its kinematics. It possesses smooth, almost cylindrical lobes, a bright central star, and a thin zone (Hora & Latter, 1994; Smith et al., 2005). A recent study of winds driven by magnetic pressure from a toroidal field was able to reproduce well the morphology of these two objects (García-Segura et al., 2005).
5.3 Rob 22
The PV diagrams for Rob 22 show an expanding nebula with the emission arising from the ends of the lobes and the walls. The bipolar axis lies nearly in the plane of the sky with the south lobe expanding slightly toward us compared with the north lobe. Given the expansion velocity of 15 km s-1 and the angular size of the lobes of 2.0, this leads to a kinematic age of 320 yr. For a distance of 2 kpc (Allen, Hyland, & Caswell, 1980), this yields an age for the lobes of 640 yr.
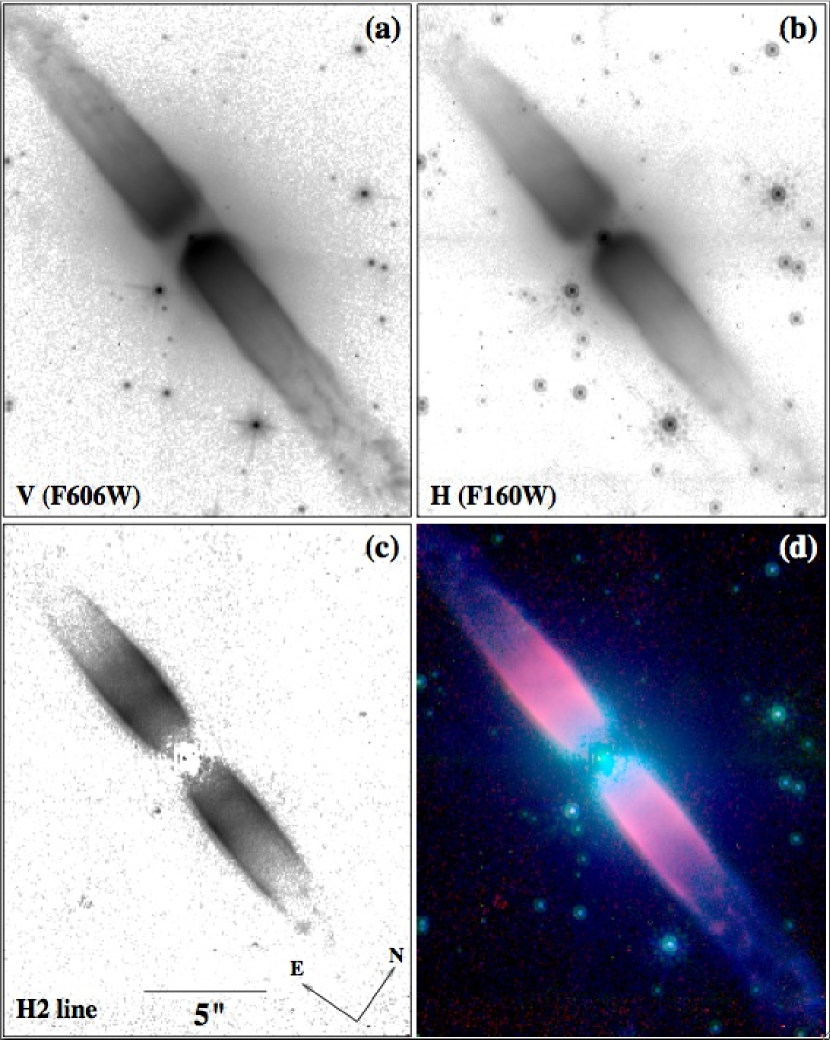
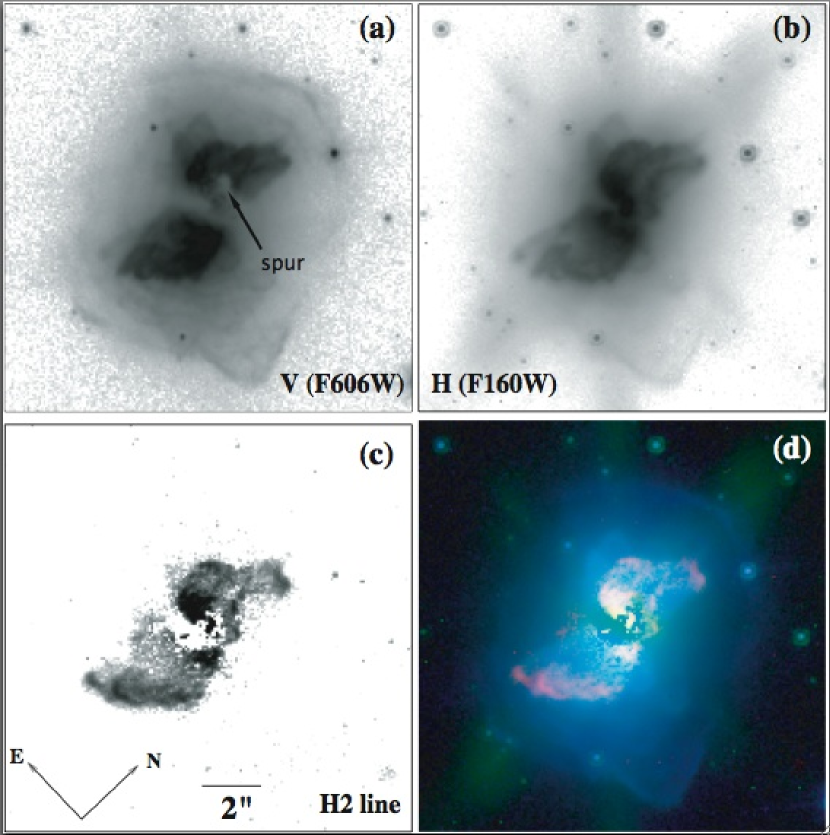
In the visual image (Figure 13a; Sahai et al., 1999a), the south lobe is brighter than the north lobe with a ratio of 1.6. In the near-infrared, the north lobe is slightly brighter, with ratios of 1.05 in H (F160W; Figure 13b), 1.1 in 2.15 m, and 1.2 in the image (Figure 13c). If the reduced relative brightness in the south lobe in the V band is due to extinction by the dense equatorial disk, then the disk would need to be extremely large if it were orthogonal to the axis of the outflow, which as we have seen is very close to the plane of the sky. It may be more likely that there is simply an intrinsic asymmetry in the lobes that contributes most of the difference.
If we compare the different images (Fig. 13), we see a strong point symmetry in the “S” shape. Even at 7.7 and 8.7 m this “S” shape is seen (Muthu, Kwok, & Volk, 2004). Such a pattern can be formed by collimation of an outflow by a precessing disk. The H emission has wings to at least 450 km s-1 (Allen, Hyland, & Caswell, 1980).
The V image shows a distinct dark band separating the lobes. In the H image, this dark lane is not so prominent, and a bright, compact clump appears. This bright clump is red but not point-like, and likely represents warm dust heated by the obscured central star. The nebula is brighter close to the star, with a particularly bright region NE of the center of the nebula. A similar morphology to the H-band image is seen in a recent adaptive optics very high resolution (R0.06) K-band image obtained by Lagadec et al. (2008); this shows some finer detail and in particular a bright linear extension toward the SE from the very bright region near the center, defining the southern part of the “V”-shaped central obscured region. The halo is evident in both the V and H images. A faint region in the N lobe (referred to as a “spur” by Sahai et al. (1999a)) is seen in both the V and H images, although in the V image it is outlined by emission farther out in the lobe while in the H image it is outlined by emission closer to the center. In the image, the emission is particularly strong in the same region NE of the center, with a less bright region on the other side (SW) of the center. In addition, the is particularly bright along the ends of the lobes. This can arise due to shock excitation produced as the collimated wind, that may have produced the S-shaped nebula, interacts with the AGB wind of the halo. Polarization measurements show scattering from the ends of the lobes, in addition to the presence of a equatorial dust torus (Ueta et al., 2007).
The faint region “spur” in the N lobe is evident in all three images. It is interesting that in the OH observations (Dyer et al., 2001), the more negative velocities arise from this faint region; perhaps it represents an evacuated hole punched through the nebula.
The OH emission appears to be confined primarily to the equatorial regions (Sahai et al., 1999a; Dyer et al., 2001; Zijlstra et al., 2001), where it may represent the expansion or rotation of a disk. The mixed C and O circumstellar chemistry might also suggest a disk, as this explanation has been advocated as the cause of the mixed chemistry in several other post-AGB objects, such as the Red Rectangle (van Winckel, 2003). The detection of hot dust, manifested in the spectral energy distribution of this object (but not in the other two), is consistent with a disk. Or it may be that this object is in transition between an O-rich chemistry to a C-rich one, with the PAH emission arising closer to the star, as may be the case for PN with [WC] central stars.
5.4 Comparison With Other Spatial-Kinematic Studies of PPNs
A small number of other bipolar PPNs have also been studied spatially or kinematically in . We discuss these for comparison.
AFGL 2688 (“Egg” nebula) has been imaged using HST-NICMOS (Sahai et al., 1998) and shows emission from clumps in its spindle-shaped closed lobes, especially near their outer ends. This is consistent with the emission arising along the walls of the lobes. It also shows strong emission from an extended equatorial region. A kinematic study by Kastner et al. (2001) shows that the highest velocity along the polar axis resides close to the star and that the velocity of the decreases along the polar axis away from the star. They find a similar effect for AFGL 618. They interpret this as resulting from a faster collimated wind colliding with slower-moving AGB material. The equatorial shows one side to be blue- and the other red-shifted, which Kastner et al. (2001) interpret indicating a combination of expansion and rotation. An alternate interpretation would be multiple bipolar jets along the equator (Cox et al., 2003) rather than rotation, and this seems to be the more likely explanation. This decrease with distance along the polar axis seen in AFGL 2688 and AFGL 618 is in contrast with what is seen in Hen 3-401. Hen 3-401 displays a clear trend of the velocity increasing in velocity with distance away from the star, in accord with what one would expect from an unhindered ejection of material from the region of the central star.
Davis et al. (2005) recently made spatially-resolved high-resolution (R20,000 or 16 km s-1) observations of four bipolar PPNs. They observed them with the spectrograph slit oriented along the bipolar axis and then offset slightly to each side, similar to our observing pattern for Hen 3401 and Rob 22. In two of these objects, M 12 and IRAS 174412411, one sees a distinct velocity difference between the two lobes (V of 55 and 10 km s-1, respectively), for IRAS 172431755 is detected only weakly from one lobe, and for IRAS 171503224 the two lobes have similar velocities (bipolar axis in the plane of the sky). For this last object, they also suggested that there may be rotation in the lobes based on systematic velocity differences seen in the offset positions.
Hrivnak et al. (2006) also studied IRAS 171503224 with higher spectral resolution, and they obtained a high-resolution (02) HST-NICMOS image. The image shows the emission to come primarily from clumps near the ends of the lobes, but these are not resolved in the spectra, which basically show the integrated emission and velocity of the clumps. The two lobes have a similar velocity, as in the above study, with slight velocity differences in the offset positions due to small effects of the different clumps rather than rotation.
As we have referred to previously, Van de Steene et al. (2008) also recently studied the kinematics of IRAS 165944656. They also observed with the Phoenix spectrograph on Gemini-South at even somewhat higher spectral and spatial resolution than we did. Their spectra show a similar picture of an expanding H2 ellipsoid with Vexp = 8 km s-1. They combined their spectra with ours to produce a detailed three-dimensional image of the shell structure.
In none of these earlier studies does one see such clearly-resolved spatial-kinematic structures as are seen in the new Gemini-South Phoenix data of IRAS 165944656, Hen 3401, and Rob 22. In all three the emission from the walls of the lobes is clearly traced in the PV diagrams. The small slit size and high spectral resolution, together with the high spatial resolution images, result in exceptional kinematic detail for a PPN.
6 SUMMARY AND CONCLUSIONS
The high-resolution HST-NICMOS images of these three PPNs have allowed us to determine the spatial location of their emission and the spatially-resolved spectroscopic observations have allowed us to determine the kinematics of the emitting regions. In all three cases, the systemic and expansion velocities are similar to those determined from the molecular-line CO or OH measurements. We find the following results for these three PPNs.
IRAS 165944656: While the V and H-band images show a complex multi-lobe structure, the images shows a clear bipolar, peanut shape, although with variations in density (“holes”) and structure (see Van de Steene et al., 2008). The emission originates along the walls of the lobes (sides and ends), with fainter emission from more distant (ejected?) clumps. The PV diagram shows the to arise in an expanding ellipsoidal velocity structure, which is in contrast to the bilobes of the density structure. The kinematics indicates that the bipolar lobes are nearly in the plane of the sky (i10); this differs from the earlier interpretations of the lobes as being at some intermediate orientation, but it is consistent with recent mid-IR imaging and near-IR polarization studies. The lobes are estimated to have an age of 1600 yr.
Hen 3-401: The emission originates from the sides of lobes, which have open ends. The lobes are tilted somewhat to the plane of the sky (1015), with the western lobe moving toward us, and they show an increasing velocity with radial distance (Hubble flow). An estimated age for the lobes is 1100 yr. The open ends and unhindered outflow may be the consequence of its higher degree of collimation (greater linear momentum).
Rob 22: The emission originate primarily from ends of the S shaped nebula and from regions of the S shape near the obscured central star. The nebula is nearly in the plane of the sky, consistent with the absence of a visible star due to obscuration by a disk. An age of 630 yr is estimated for the lobes.
surveys of PPNs have shown that emission is commonly found in those with a bipolar morphology. As can be seen from this study, the combination of high-resolution images and spatially-resolved, high-resolution spectra provides valuable insight into the structure and shaping mechanisms for these bipolar nebulae.
References
- Allen (1978) Allen, D.A. 1978, MNRAS, 184, 601
- Allen, Hyland, & Caswell (1980) Allen, D.A., Hyland, A.R., & Caswell, J.L. 1980, MNRAS, 192, 505
- Balick (1987) Balick, B. 1987, AJ, 94, 671
- Balick & Frank (2002) Balick, B., & Frank, A. 2002, ARA&A, 40, 439
- Bragg et al. (1982) Bragg, S.L., Brault, J.W., & Smith, W.H. 1982, ApJ, 263, 999
- Bujarrabal & Bachiller (1991) Bujarrabal, V., & Bachiller, R. 1991, A&A, 242, 247
- Cox et al. (2003) Cox, P., Huggins, P. J., Maillard, J.-P., Muthu, C., Bachiller, R., & Forveille, T. 2003, ApJ, 586, L87
- Davis et al. (2005) Davis, C.J., Smith, D.M., Gledhill, T.M., & Varricatt, W.P. 2005, MNRAS, 360, 104
- Dyer et al. (2001) Dyer, K.K., Goss, W.M., & Kemball, A.J. 2001, AJ, 121, 2743
- García-Hernández et al. (2002) García-Hernández, D.A., Manchado, A., García-Lario, P., Domíngueq-Tagle, C., Conway, G.M., & Prada, F. 2002, A&A, 387, 955
- García-Lario et al. (1999a) García-Lario, P., Manchado, A., Ulla, A., & Manteiga, M. 1999a, A&A, 513, 941
- García-Lario et al. (1999b) García-Lario, P., Riera, A., & Manchado, A. 1999b, A&A, 526, 854
- García-Segura et al. (2005) García-Segura, G., López, J.A., & Franco, J. 2005, ApJ, 618, 919
- Hinkle et al. (1998) Hinkle, K. H., Cuberly, R. W., Gaughan, N. A., et al. 1998, Proc. SPIE, 3354, ed. A.M. Fowler, 810
- Hora & Latter (1994) Hora, J. L., & Latter, W. B. 1994, ApJ, 437, 281
- Hrivnak et al. (2004) Hrivnak, B. H., Kelly, D. M., & Su, K. Y. L. 2004, in ASP Conf. Ser. 313, Asymmetric Planetary Nebulae III, ed. M. Meixner, J.H. Kastner, B. Balick, N. Soker (San Franciso: ASP), 175
- Hrivnak et al. (2006) Hrivnak, B. H., Kelly, D. M., Su, K. Y. L., Kwok, S., & Sahai, R. 2006, ApJ, 650, 237
- Hrivnak, Kwok, & Su (1999) Hrivnak, B. H., Kwok, S. & Su, K. Y. L. 1999, ApJ, 524, 849
- Hrivnak, Kwok, & Su (2001) Hrivnak, B. H., Kwok, S. & Su, K. Y. L. 2001, AJ, 121, 2775
- Hrivnak, Volk, & Kwok (2000) Hrivnak, B. H., Volk, K. & Kwok, S. 2000, ApJ, 535, 275
- Kastner et al. (2001) Kastner, J.H., Weintraub, D.A. , Gatley, I., & Henn, L. 2001, ApJ, 546, 279
- Kelly & Hrivnak (2005) Kelly, D.M., & Hrivnak, B.J., 2005, ApJ, 629, 1040
- Koekemoer et al. (2002) Koekemoer, A. M., et al. 2002, “HST Dither Handbook”, Version 2.0 (Baltimore: STScI)
- Kwok (1982) Kwok, S. 1982, ApJ, 258, 280
- Lagadec et al. (2008) Lagadec, E., Chesneau, O., Zijlstra, A., & Mekarnia, D. 2008, in Asymmetric Planetary Nebulae IV, ed. R.L.M. Corradi, A. Manchado, , N. Soker, in publication
- Loup et al. (1990) Loup, C., Forveille, T., Nyman, L. ., & Omont, A. 1990, A&A, 227, L29
- Muthu, Kwok, & Volk (2004) Muthu, C., Kwok, S., & Volk, K. 2004, Bul. AAS, 36, 1570
- Muthumariappan, Kwok, & Volk (2006) Muthumariappan, C., Kwok, S., & Volk, K. 2006, ApJ, 640, 353
- Molster et al. (1997) Molster, F., Waters, L.B.F.M., de Jong, T., Prusti, T., Zijlstra, A., & Meixner, M. 1997, IAU Symp. 180: Planetary Nebulae, ed. H.J. Habing, H.J.G.L.M. Lamers (Kluwer: Dordrecht), 361
- Molster et al. (2002) Molster, F., Waters, L.B.F.M., Tielens, A.G.G.M., & Barlow, M.J. 2002, A&A, 382, 184
- Parthasarathy et al. (2001) Parthasarathy, M., García-Lario, P., Gauba, G. et al. 2001, A&A, 376, 941
- Parthasarathy & Pottasch (1989) Parthasarathy, M., & Pottasch, S.R. 1989, A&A, 154, L16
- Reyniers (2002) Reyniers, M. 2002, Ph.D. Thesis, Catholic University of Leuven
- Sahai et al. (1999b) Sahai, R., Bujarrabal, V., & Zijlstra A. 1999b, ApJ, 518, L115
- Sahai et al. (1998) Sahai, R., Hines, D. C., Kastner, J. H., Weintraub, D. A., Trauger, J. T., Rieke, M. J., Thompson, R. I., & Schneider, G. 1998, ApJ, 492, L163
- Sahai et al. (2007) Sahai, R., Morris, M., Sánchez Contreras, C., & Claussen, M. 2007, AJ, 134, 2200
- Sahai et al. (2000) Sahai, R., Su, K.Y.L., Kwok, S., Dayal, A. & Hrivnak, B.J. 2000, in ASP Conf. Ser. 199, Asymmetric Planetary Nebulae II - From Origins to Microstructures, ed. J.H. Kastner, N. Soker, S.A. Rappaport (San Franciso: ASP), 167
- Sahai & Trauger (1998) Sahai, R., & Trauger, J.T. 1998, AJ, 116, 1357
- Sahai et al. (1999a) Sahai, R., Zijlstra A., Bujarrabal, V., & te Lintel Hekkert, P. 1999a, AJ, 117, 1408
- Scarrott & Scarrott (1995) Scarrott, S.M., & Scarrott, R.M.J.,1995 MNRAS, 277, 277
- Silva et al. (1993) Silva, A.M., Azcárate, I.N., Poppel, W.G.L., & Likkel, L. 1993, A&A, 275, 510
- Siíodmiak et al. (2008) Siódmiak, N., Meixner, M., Ueta, T., Sugerman, B.E.K., Van de Steene, G.C., & Szczerba, R. 2008, ApJ, 677, 382
- Smith (2006) Smith, N. 2006, ApJ, 644, 1151
- Smith & Gehrz (2005) Smith, N., & Gehrz, R.D. 2005, AJ, 129, 969
- Smith et al. (2005) Smith, N., Balick, B., & Gehrz, R.D. 2005, AJ, 130, 853
- Steffen & López (2006) Steffen, W., & López, J.A. 2006, Rev. Mexicana Astron. Astrofis., 42, 99
- Su et al. (2001) Su, K. Y. L., Hrivnak, B. J., & Kwok, S. 2001, AJ, 122, 1525
- Su et al. (2003) Su, K. Y. L., Hrivnak, B. J., Kwok, S., & Sahai, R. 2003, AJ, 126, 848
- Ueta et al. (2000) Ueta, T., Meixner, M., & Bobrowsky, M. 2000, ApJ, 528, 861
- Ueta et al. (2005) Ueta, T., Murakawa, K., & Meixner, M. 2005, AJ, 129, 1625
- Ueta et al. (2007) Ueta, T., Murakawa, K., & Meixner, M. 2007, AJ, 133, 1345
- Van de Steene & van Hoof (2003) Van de Steene, G. C., & van Hoof, P. A. M. 2003, A&A, 406, 773
- Van de Steene et al. (2008) Van de Steene, G. C., Ueta, T., van Hoof, P. A. M., Reyniers, M., & Ginsburg, A.G. 2008, A&A, 480, 775
- Van de Steene, Wood, & van Hoof (2000) Van de Steene, G. C., Wood, P.R., & van Hoof, P. A. M. 2000, in ASP Conf. Ser. 199, Asymmetric Planetary Nebulae II - From Origins to Microstructures, ed. J.H. Kastner, N. Soker, S.A. Rappaport (San Franciso: ASP), 191
- van Winckel (2003) van Winckel, H. 2003, ARA&A, 41, 391
- Volk et al. (2006) Volk, K., Hrivnak, B.J., Su, K.Y.L. & Kwok, S. 2006, ApJ, 651, 294
- Volk et al. (2002) Volk, K., Kwok, S., Hrivnak, B.J., & Szczerba, R. 2002, ApJ, 567, 412
- Zijlstra et al. (2001) Zijlstra, A.A., Chapman, J.M., te Lintel Hekkert, P., Likkel, L., Comeron, F., Norris, R.P., Molster, F.J., & Cohen, R.J. 2001, MNRAS, 322, 280
| IRAS ID | Other Names | Observation | Total Exposure Times (s)aaNote that in two of our previous papers involving NICMOS images (Su et al., 2003; Hrivnak et al., 2006), we incorrectly listed as the total exposure times values that were one-third of the correct values. Thus for our F212N and F215N images of IRAS 171503224, for example, the total exposure times were 2448 s, not 816 s as listed (Hrivnak et al., 2006). | ||||
|---|---|---|---|---|---|---|---|
| Date | F212N | F215N | F110W | F160W | F222M | ||
| 101785958 | Hen 3-401 | 1998 Mar 6 | 1728 | 1728 | 576 | 1152 | |
| 101975750 | Rob 22 | 1998 May 18 | 1344 | 1344 | 320 | 768 | |
| 165944656 | 2002 Aug 13 | 1215 | 1215 | 192 | |||
| Filter | PHOTFLAM | PHOTFNU | ZP(Vega) | PSF FWHMbbBased upon a Gaussian fit to the observed field stars. | ||
|---|---|---|---|---|---|---|
| erg cm-2-1DN-1 | Jy sec DN-1 | Jy | ″ | |||
| F212N-new | 2.1213 | 0.0087 | 1.9135E-14 | 2.8722E-5 | 664.7 | 0.19 |
| F215N-new | 2.1487 | 0.0079 | 2.1031E-14 | 3.2389E-5 | 645.1 | 0.20 |
| F212N-old | 2.1213 | 0.0088 | 2.4272E-14 | 3.6432E-5 | 664.7 | 0.20 |
| F215N-old | 2.1487 | 0.0079 | 2.5533E-14 | 3.9323E-5 | 645.1 | 0.20 |
| F110W-new | 1.1235 | 0.1630 | 2.9059E-15 | 1.2234E-6 | 1784.4 | 0.12 |
| F160W-old | 1.6060 | 0.1177 | 2.3956E-15 | 2.0610E-6 | 1040.7 | 0.14 |
| Object | Date | P.A. ()aaThe letters in parenthesis for IRAS 165944656 refer to the slit orientations as displayed in Figure 4. | Position | texp (s)bbExposure times per observation. | No. Obs. |
|---|---|---|---|---|---|
| Rob 22 | 2003 Jan 14 | 17 | through star | 500 | 2 |
| Rob 22 | 2003 Jan 14 | 17 | 07 W of star | 500 | 2 |
| Rob 22 | 2003 Jan 14 | 17 | 07 E of star | 500 | 2 |
| Hen 3-401 | 2003 Dec 17 | 73 | through star | 500 | 2 |
| Hen 3-401 | 2003 Dec 17 | 73 | 07 S of star | 500 | 2 |
| Hen 3-401 | 2003 Dec 17 | 73 | 07 N of star | 500 | 2 |
| Hen 3-401 | 2003 Dec 17 | 163 | through star | 500 | 2 |
| IRAS 165944656 | 2003 May 08 | 52 (b) | through star | 600 | 2 |
| IRAS 165944656 | 2003 May 08 | 33 (c) | through star | 600 | 2 |
| IRAS 165944656 | 2003 May 08 | 345 (e) | 09 W of star | 600 | 2 |
| IRAS 165944656 | 2003 May 15 | 345 (d) | through star | 600 | 3 |
| IRAS 165944656 | 2003 May 15 | 72 (a) | through star | 600 | 2 |