Broad lifetime distributions for ordering dynamics in complex networks
Abstract
We search for conditions under which a characteristic time scale for ordering dynamics towards either of two absorbing states in a finite complex network of interactions does not exist. With this aim, we study random networks and networks with mesoscale community structure built up from randomly connected cliques. We find that large heterogeneity at the mesoscale level of the network appears to be a sufficient mechanism for the absence of a characteristic time for the dynamics. Such heterogeneity results in dynamical metastable states that survive at any time scale.
pacs:
89.75.Hc, 89.65.-s,89.75.Fb,89.75.-kI Introduction
A key characteristic for nonequilibrium dynamics of interacting many body systems is the relaxation time. Typically, finite systems starting from generic initial conditions far from equilibrium reach a final stationary state or attractor in a characteristic time. For simple nonequilibrium lattice models Marro and Dickman (1999) the dynamics often leads to an absorbing state. In some cases the system might get trapped in a metastable state, which generally also has a well defined expected lifetime. Frozen metastable configurations that persist indefinitely in the absence of fluctuations are also possible. An intriguing situation occurs when such a characteristic time cannot be defined. In particular this has been shown to occur when the system reaches different dynamical (nonfrozen) metastable states with very different lifetimes Castelló et al. (2007).
The two basic inputs in a model of interacting units are the interaction rules among units, and the network of interactions, i.e., links in the network defining who interacts with whom. The structure of this network is expected to strongly influence the dynamics and collective behavior arising from interactions. A particular feature of networks of social interaction is that they are structured into cohesive groups within which the internal links are dense, and which are sparsely interconnected Scott (2000); Fortunato and Castellano (2009); Newman (2004); Danon et al. (2005, 2007); Radicchi et al. (2004); Arenas et al. (2004); Newman and Girvan (2004); Palla et al. (2005, 2007); Kumpula et al. (2007). Such communities are known to have a deep impact on the dynamics taking place in the network. For example, for oscillators coupled via a complex network, synchronization takes place first within highly interconnected local structures, and synchronized domains expand via intercommunity connections Vega et al. (2004); Arenas and Díaz-Guilera (2007); Arenas et al. (2006); Oh et al. (2005); Zhou et al. (2007); Arenas et al. (2008). Similarly, information has been shown to spread rapidly within communities, but slowly across the network, particularly if intercommunity links are weak Onnela et al. (2007). Communities may also promote the emergence and survival of cooperation Lozano et al. (2008).
In dynamics of competing options, research has focused on the question of whether and how a system-wide consensus is reached Fortunato and Castellano (2009). For a two-spin system following the majority rule Krapivsky and Redner (2003), network topologies with communities can be constructed in which no consensus will take place Lambiotte et al. (2007). For a three-state model of competing options Castelló et al. (2006), the absence of a characteristic time until consensus is reached Castelló et al. (2007) seems to be associated with metastable traps caused by community structure. Dynamics sensitive to community structure have also been employed for identifying communities, including various spin systems such as in the Ising model Son et al. (2006); Fu and Anderson (1986), the Potts model Reichardt and Bornholdt (2004); Blatt et al. (1996), and models of random walks Zhou (2003); Eriksen et al. (2003); Simonsen (2005).
The question of general conditions under which a broad distribution of relaxation times is obtained merits a detailed and systematic study. In this paper we address this question by investigating the role of the network of interactions, in particular its mesoscopic structure and topological traps, in nonequilibrium ordering dynamics. For this, we will consider the AB model Castelló et al. (2006) which describes ordering dynamics towards an absorbing or state. This model is an extension of the simple two-state voter model Holley and Liggett (1975), in which dynamics at the interfaces has been proven to evolve by curvature reduction Castelló et al. (2006) in contrast to the noisy interface dynamics of the voter model Dornic et al. (2001); Al-Hammal et al. (2005). Thus, the results reported in this paper might be generic for a class of models in which the dynamics at the interfaces is curvature driven, such as the spin-flip kinetic Ising model (SFKI) Gunton et al. (1983). In addition, mesoscopic community structure of the networks is especially relevant in discussions of the AB model which was originally motivated by studies of language competition Abrams and Strogatz (2003); Minett and Wang (2008); Castelló et al. (2008, 2006). We focus on the question of which features of the network topology, such as relatively isolated groups of nodes, the presence of communities, their interconnectivity, or their size distribution, give rise to trapped metastable states. Here we study the dynamics of the AB model in a controlled setting by constructing test case networks in which community boundaries are clear.
The outline of the paper is as follows: In Sec. II we introduce and briefly review the AB model. We first consider random networks (Sec. III) where we identify substructures causing broad distributions of lifetimes in random networks with low mean degree. To explain the observations therein, we introduce the concept of dynamical robustness measured by the survival time (i.e., a characteristic relaxation time) of relatively isolated groups of nodes in a state different from the one in the final absorbing state. In Sec. IV we study the effect of the presence of communities starting from an underlying random network and communities of equal size, and considering later an exponential distribution for the sizes of different communities. The results and conclusions are summarized in Sec. V.
II The AB model
The AB model Castelló et al. (2006) considers a set of interacting units located at the nodes of a network. Each unit can be in either state or , or in a third state of coexisting options at the individual level. Thus the model describes the competition of two nonexcluding options or states. It can be seen as an extension of the two-state voter model Holley and Liggett (1975) by the introduction of a third nonsymmetric mixed state. A node changes its state with a probability that depends on the states of its neighbors in the network. The fraction of neighbors of an agent in each state (, , ) are called the local densities: , , and . Transitions from to always take place via the third mixed state. The AB model is defined by the following transition probabilities:
| (1) | |||||
| (2) |
The mean-field analysis of these equations shows that there exist three fixed points with two of them stable and one unstable. The stable fixed points correspond to consensus in either of the two options or , while the unstable one corresponds to a situation where the three states , and coexist. In our simulations we initially set each node in a network of size randomly to one of the states A, B, or AB. At each time step all nodes are updated in random order according to the transition probabilities Eqs. (1) and (2). The lifetime of a run is defined as the number of time steps it takes to reach either of the absorbing states. We monitor the fraction of alive runs, that is, the fraction of simulations which still have not reached an absorbing state at time t, , where is the probability distribution of lifetimes. In a two-dimensional regular and finite lattice, the system reaches in a finite time and with probability one an absorbing state, i.e., consensus in either of the single-option states, or (with the same probability Castelló et al. (2006)). Trapped metastable states have been observed in the AB model dynamics in a two-dimensional lattice, in which they take a stripelike form Castelló et al. (2006), but with well-defined mean lifetime (lifetimes of these metastable states are distributed exponentially).
In contrast with the voter model, the AB model dynamics is curvature driven Castelló et al. (2006), such that the and domains form and grow in size by a coarsening process in which the characteristic length of a domain, averaged over different realizations of the dynamics, grows as , . The agents never form domains but instead place themselves in the boundaries between and domains, transforming the noisy interface dynamics of the voter model into a curvature driven dynamics.
In a network with community structure Toivonen et al. (2006), the boundaries between homogeneous single-option domains tend to follow the community boundaries Castelló et al. (2007). The most interesting result for the AB model in these networks is the fact that there is no characteristic time scale for the dynamics: a power law distribution for the distribution of lifetimes is obtained with an exponent such that a characteristic time cannot be defined. This behavior seems to be associated with the existence of dynamical long-lived trapped metastable states that survive at any time scale. In order to obtain a fuller understanding of this phenomenon, in the remaining part of the paper we study the dynamics in networks with a predesigned mesoscopic structure.
III The AB model in random networks
III.1 Erdős-Rényi Networks
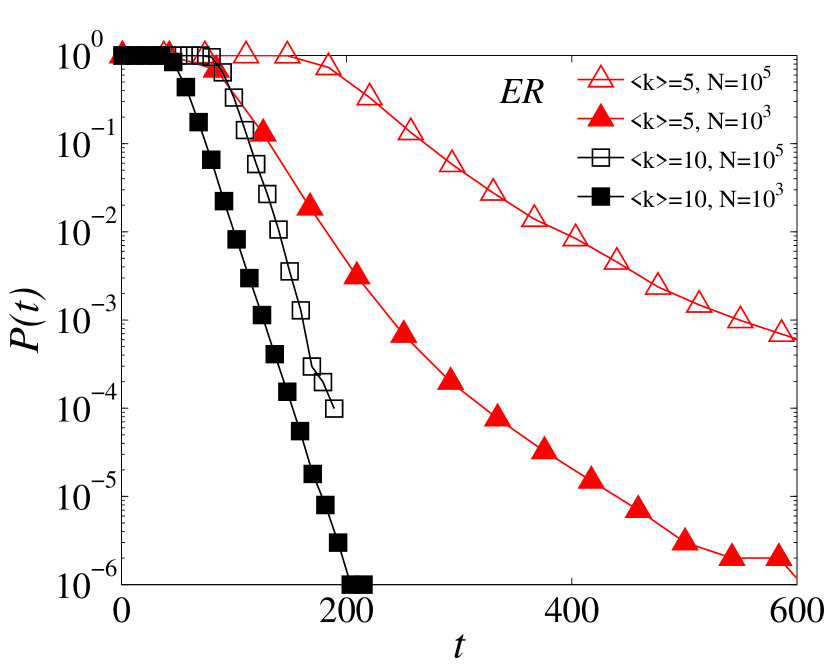
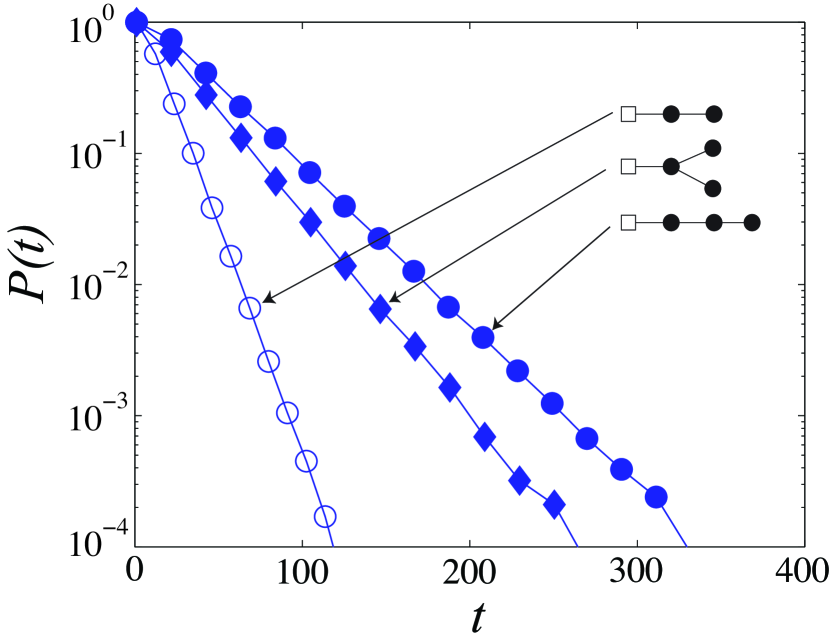
Here we first consider the Erdős-Rényi (ER) random network topology Erdős and Rényi (1959), in which each of the possible links between the nodes is present with probability . The network can equivalently be characterized by the average degree . We find that in Erdős-Rényi networks the fraction of alive runs depends unexpectedly on link density [Fig. 1], such that, for high link densities up to a fully connected network, is clearly exponential, but for low link densities it turns out to be broader, indicating the existence of metastable states. The cases of and are selected to illustrate this difference.
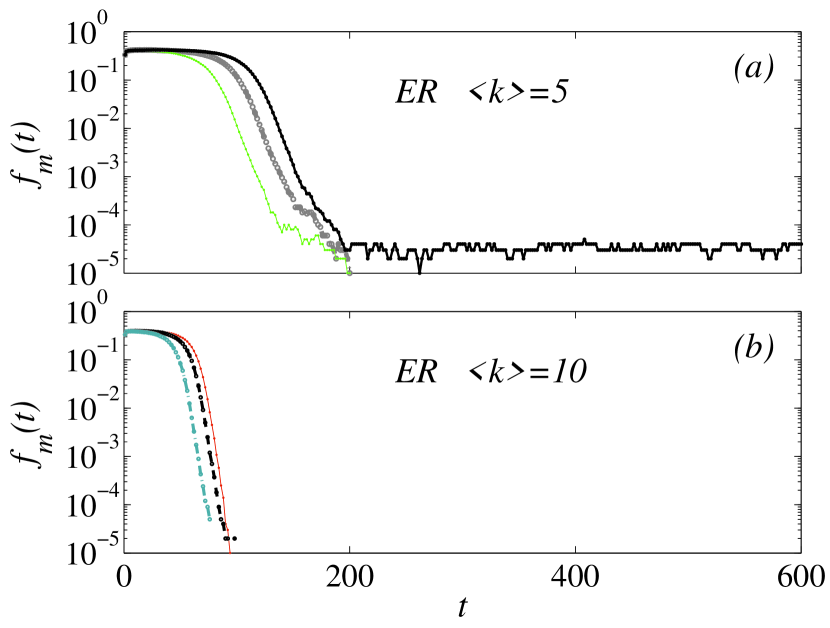
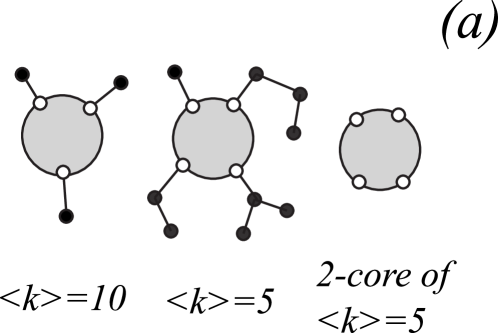
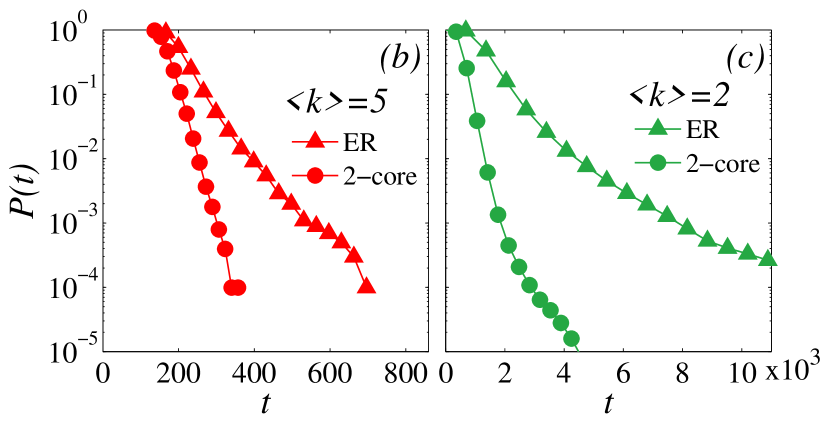
The metastable states are visualized by displaying the fraction of nodes in the minority state (the state or that becomes the minority and finally dies out) in individual runs [Fig. 2(a)]. Figure 2(b) shows that metastable states do not arise for . The observed metastable states concern only a very small fraction of nodes. Further analysis reveals that they are associated primarily with “branches”. We use the term branch here to indicate maximal treelike substructures that are connected to the rest of the network through a node that has degree , which we will call here the root node of the branch [see Fig. 3(a) for illustration]. Branches can be removed from the network (except for the root node) by successively removing nodes of degree until all the remaining nodes have degree , i.e., by taking the two-core of the network da F. Costa et al. (2007). We call the maximal network distance from the root node to any other nodes in the branch the diameter of the branch. Figure 3(a) displays schematically the difference between the ER networks with and with respect to the presence of branches. In the ER networks with typically only branches with unit diameter are present, while branches with diameter or arise frequently in ER nets with , often with bifurcations.
Taking the two-core of ER networks with and running the AB model in the resulting networks confirms the role of branches in producing a deviation from an exponential distribution in , see Fig. 3(b). The metastable states disappear and an exponential lifetime distribution is recovered. In very sparse ER networks, illustrated by the case in Fig. 3(c), a slight deviation not explained by branches remains that could be attributed to the largely chainlike structure of the networks 111Note also that it has been argued that modularity may arise from fluctuations in sparse ER networks Guimerá et al. (2004). However, the branches are clearly responsible for the longest-lived metastable states.
III.2 Dynamical robustness and survival times
In order to characterize the behavior of relatively isolated groups of nodes that remain in the minority state after most of the network has homogenized in either state or , we introduce the concept of dynamical robustness against invasion for a given topological structure. It concerns a group of nodes subjected to dynamics of competing options. It measures the resistance of against consenting to outside pressure applied to by its neighbors [Fig 4]. We initialize the nodes in to state , and fix the nodes in permanently to state . The dynamical robustness of is then characterized by a survival time, , defined as the characteristic time it takes for to homogenize to state . A substructure is dynamically robust when it has a large survival time.

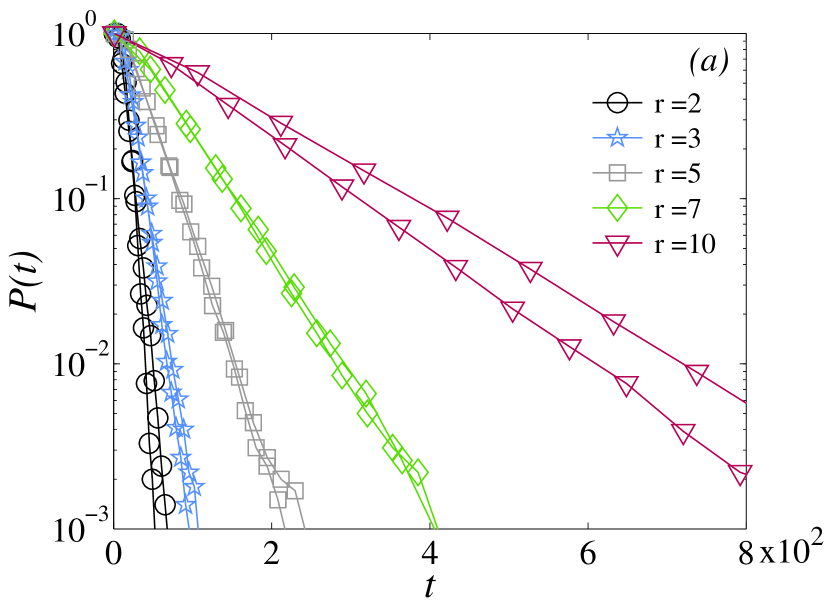
As an example, consider the dynamical robustness of branches with diameters and , one of them containing a bifurcation [Fig. 5]. The time it takes for each of these topologies to homogenize to the consensus state appears to be distributed exponentially, but with a different characteristic time , corresponding to different time scales. For a branch with given diameter, bifurcations increase the survival time. It is noteworthy that, compared to the times it takes for an Erdős-Rényi network with no branches to reach consensus [Fig. 3(b)], the time that a single branch may remain with the minority opinion is very long.
Each branch of different diameter, and with a different number of bifurcations, produces an exponential lifetime distribution with a different characteristic time . The combination of various time scales leads to the observed broader than exponential lifetime distribution in low-link-density ER networks.
IV The role of communities
IV.1 Networks with equally sized cliques
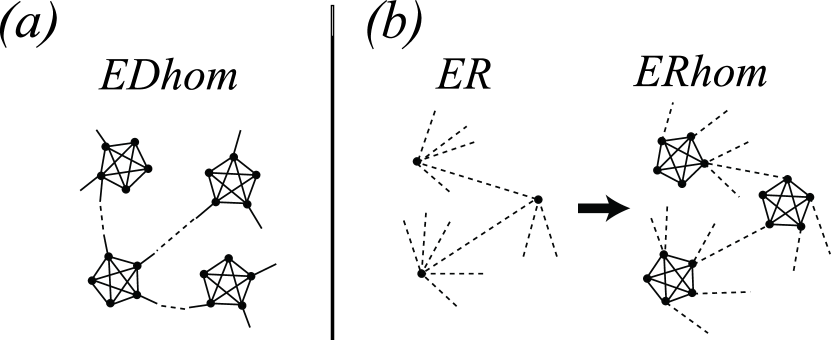
In this section, we discuss the effect of communities on lifetimes of the system, using simple test networks with equally sized communities. To keep things as clear as possible, we use cliques, i.e., fully connected graphs, as communities. We denote by the clique out-degree, or the number of links connecting each clique to outside nodes (note that the term out-degree here does not refer to directed edges). For a node in a clique of size , we denote the number of links to the other nodes within the clique by , and the average number of links to nodes outside the clique by .
We employ two different methods for connecting the cliques. In the first construction, is equal for all cliques. We label these networks EDH, for equal out-degree and homogeneously sized cliques. The link ends are assigned to randomly selected nodes in each clique, and then randomly paired, under the condition that two link ends from the same clique are not allowed to be connected [Fig. 6(a)]. In the second construction, we begin with an ER network, with high link-density to avoid branches with diameter larger than , and replace its nodes with equally sized cliques (Fig. 6(b)). Each link of the underlying Erdős-Rényi network, connecting two cliques, is again assigned to a uniformly randomly selected node in each clique. We label these networks ERH, as they are based on an underlying ER network, and consist of homogeneously sized cliques. In ERH networks, is distributed according to the Poisson distribution of the underlying ER network.
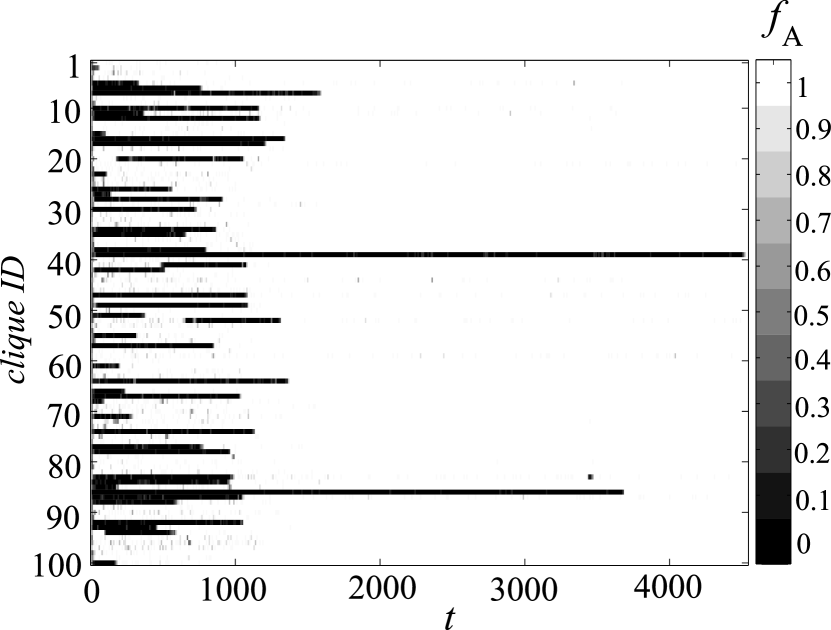
We run the AB model dynamics in different realizations of the EDH and ERH networks with and various clique sizes , always starting from random initial conditions. Let us first obtain a detailed view of the time evolution of the dynamics by monitoring the fraction of agents in each state within each clique. Note that, because the agents do not tend to form domains, the densities and of and agents within each clique will be practically complementary (). Figure 7 displays within each clique for a run in an ERH network, indicated by gray scale from white (all A agents) to black (no A agents). Each row corresponds to one clique. The randomly initialized cliques very rapidly homogenize to either state (white) or (black). The plot shows that cliques remain homogenized to either state or during most of the run, and that they do not often flip from one state to the other (this is also true for the EDH networks, not shown). Two of the clusters remained in the minority state for long after the rest of the network was homogenized to the opposing state, indicating a metastable state. These appeared frequently in the ERH networks, in contrast to the EDH networks.
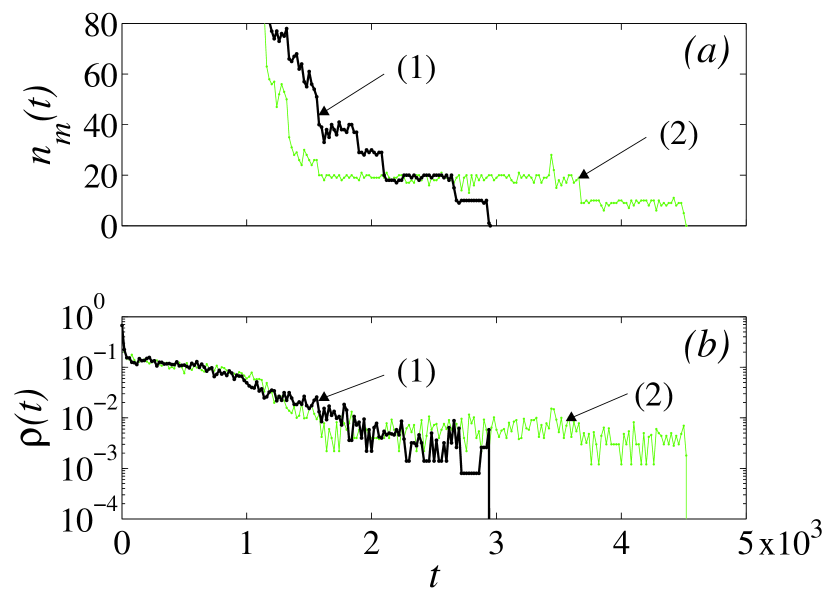
Two typical runs that developed metastable states in the ERhom network topologies are presented in Fig. 8, employing two measures: the number of agents in the minority state [Fig. 8(a)], and the interface density , i.e. the fraction of links that connect nodes in different states [Fig. 8(b)]. Run (2) corresponds to the detailed view in Fig. 7. We see that decreases in steps of size , indicative of cliques that are homogenized to the minority state, which are consenting to the majority state one by one. The number of minority agents rarely increases in the ERH networks. A closer inspection of the network topologies shows that the cliques that remain in the minority state longest have a relatively small number of out-links, although not necessarily only one (in runs (1) and (2) displayed in Fig. 8, 4 and 6, respectively).
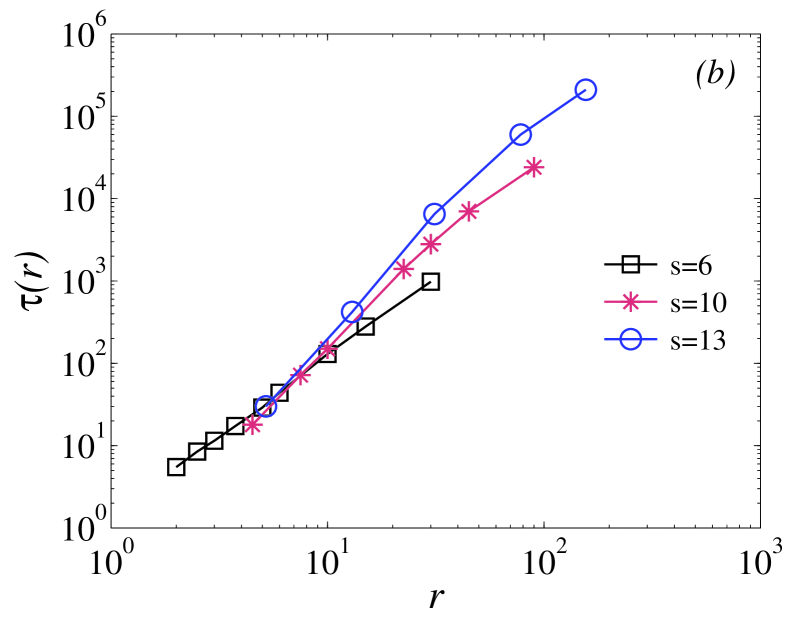
In order to shed more light on how cliques with various out-degrees resist changing their state, we study them in a controlled setting. In accordance with our definition of dynamical robustness, we initialize all agents within the clique to the state B, and the links leading out of the clique are connected to nodes permanently in state [as shown in Fig 4(b)]. As cliques remain mostly homogenized to one state during the evolution of the dynamics, the resulting lifetime distributions are also relevant for understanding the resistance of communities against changing their state within the network. Figure 9(a) displays the observed fraction of alive runs for cliques of various sizes and out-degrees . The distributions are roughly exponential, , and it turns out that their survival times show a clear trend with the ratio , which appears to be an appropriate topological measure of the dynamical robustness for cliques. Figure 9(b) displays the relation , determined for cliques of fixed size with varying clique out-degree. The time scales associated with the invasion of cliques grow rapidly with .
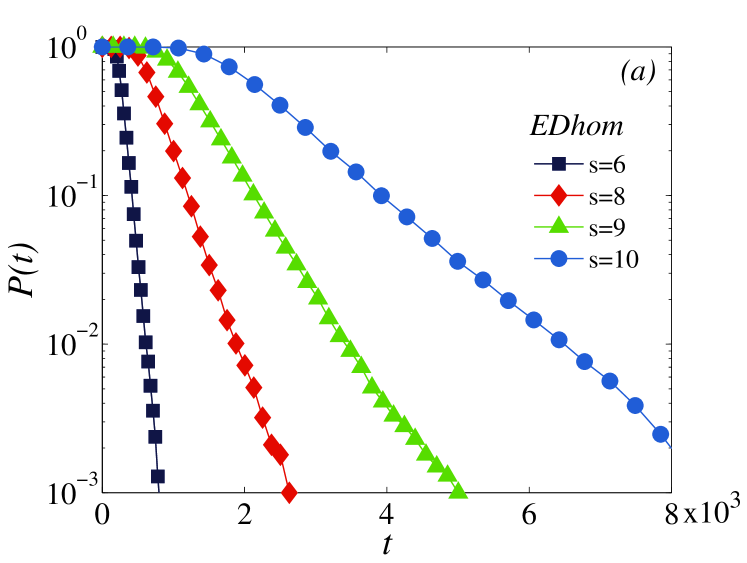
Finally, let us observe the fraction of alive runs in the networks with equally sized cliques. In EDH networks with clique sizes , , and , and clique out-degree , has an exponential tail [Fig. 10(a)], indicating that the presence of communities alone is not sufficient for a broad distribution to appear. In these networks, all cliques have equal dynamical robustness. In contrast, in the ERH networks the resulting fractions of alive runs are clearly broader than exponential, as depicted in Fig. 10(b) for clique sizes and , and average clique out-degree . The variance in dynamical robustness caused by the different clique out-degrees seems to play an important role.
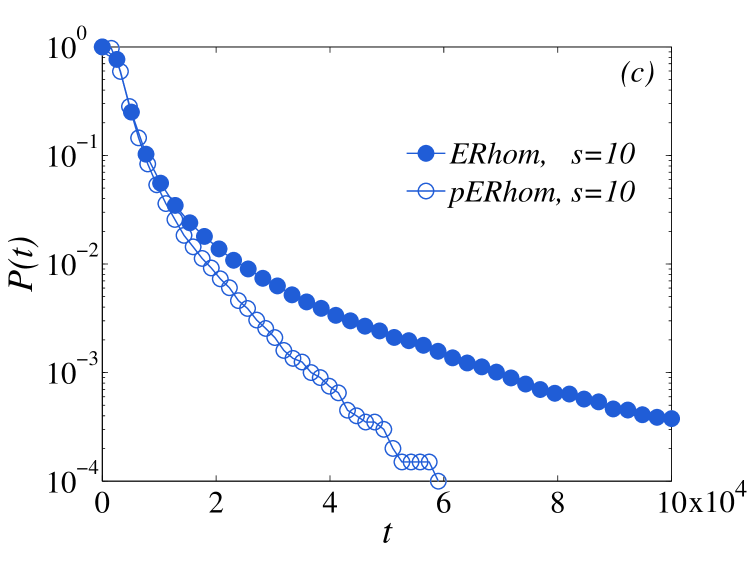
We probe the effect of the most isolated node groups in the ERH networks by eliminating the least well connected cliques, i.e., those that are connected to the network by a single link. This is done by taking the two-core of the underlying ER network before replacing its nodes with cliques. We call these networks PERH for “pruned” ERH. Figure 10(c) displays for ERH and PERH networks with and . It is seen that pruning the network results in a distribution that decays slightly faster, but remains broader than exponential. This gives further confirmation that the metastable states with various time scales produced by cliques with different out-degrees are responsible for the broader than exponential lifetimes in the ERH networks.
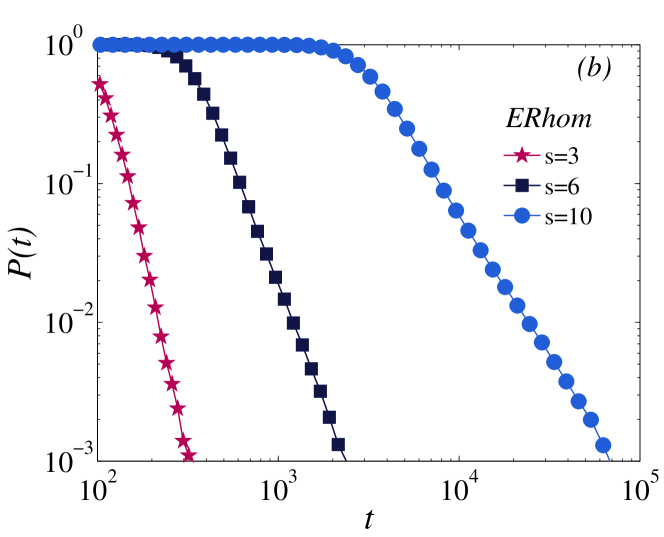
The fraction of alive runs in the ERH networks shown in Fig. 10(b) has broad tails that appear power-law like. Moreover, they appear to broaden with increasing clique size. Approximating these tails by power laws, the exponents would however be far larger than those observed in the networks studied in Castelló et al. (2007), in which the range of exponents was such that the variance of the lifetimes was not defined. Hence the distributions observed here are fundamentally different from the findings in Castelló et al. (2007). In order to obtain broader lifetime distributions, we apparently need a broader distribution in the dynamical robustness of communities, which in the case of cliques can be achieved by increasing variance in . As it is more practical to obtain large variance in by varying than , we take this approach in the following section.
IV.2 Networks with a broad size distribution of clique sizes
In this section, we study a network consisting of cliques with equal out-degree and with an exponential clique size distribution, shifted to obtain minimum clique size . We construct networks from cliques whose sizes are obtained as , where refers to rounding downwards and is drawn from the exponential distribution , leading to for integer values of starting from . As with the EDH networks, the out-links of each clique are randomly assigned to its nodes, and link ends are randomly paired, except that no two link ends from the same clique are connected. We label the networks as EDE, for equal out-degree and exponential clique size distribution.
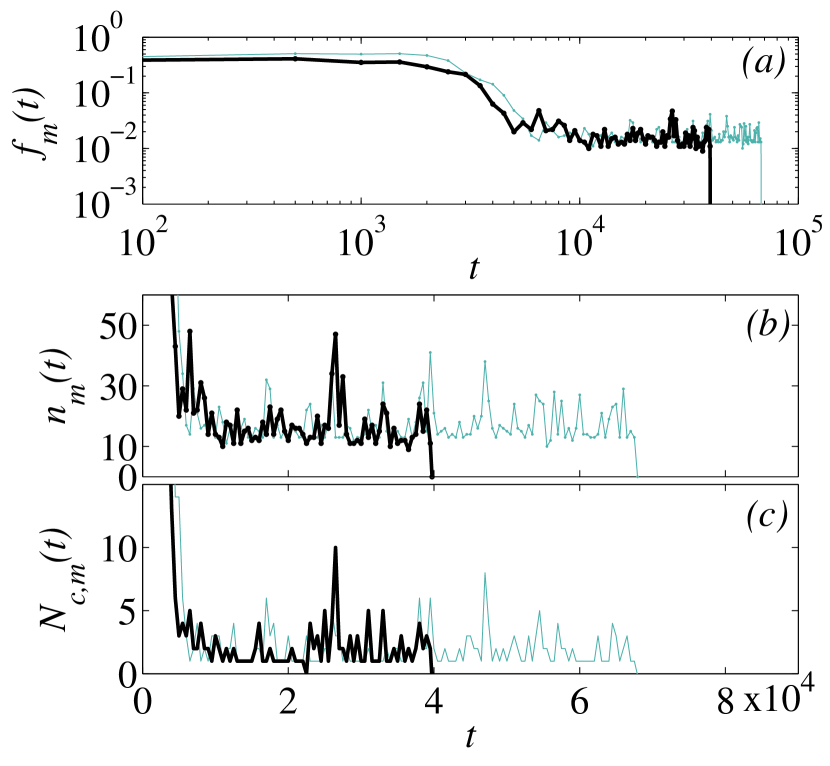
The communities in this network will display a very large variance in dynamical robustness. In Sec. IV.1 we saw that the factor of the exponential lifetime distribution of a clique being “invaded”, grows very rapidly with , which in turn grows approximately as . Again, cliques remain homogenized to either of the states or most of the time (not shown), but it turns out that some of the smaller cliques frequently adopt the state of a larger clique homogenized to the minority state. Figure 11(a) displays the fraction of nodes in the minority state in a few typical runs that developed metastable states in the EDE networks. A close-up of the same runs [Fig. 11(b)] shows that the number of minority nodes fluctuates above a baseline of roughly nodes. This seems to indicate a relatively large clique homogenized to the minority state that is “converting” its smaller (and hence less dynamically robust) neighboring cliques to the minority state, thereby producing around itself a buffer of cliques in the minority state. This assumption is confirmed by closer inspection of the networks, as well as by Fig. 11(c), which shows the number of clusters in which more than 90 % of the agents are in the minority state. Much of the time there is only one cluster in the minority [corresponding to the baseline in Fig. 11(b)], while it is frequently joined by other, mostly smaller clusters, judging by the combination of and .
The buffering effect is an additional ingredient causing metastable states with various time scales, beyond the dynamical robustness that depends on . We studied it in a more controlled setting using networks consisting of a single large clique and a large number of small cliques, with equal , connected similarly as in the EDH networks. The resulting in these networks had an exponential tail (not shown), suggesting that buffering is again a process that would individually have an exponential lifetime distribution, but broader distributions are produced when a combination of substructures with different dynamical robustness is present.
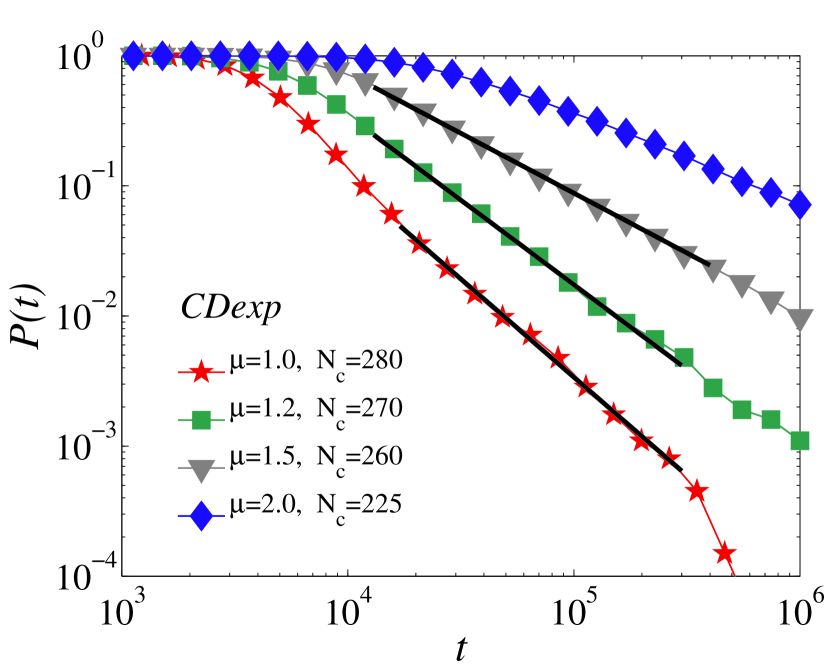
The EDE networks are seen to give rise to very broad lifetime distributions, shown in Fig 12 for , , , and . Approximating the tails of the fraction of alive runs by a power law , the best fits to the cases with and have exponents and , respectively. Values imply that the variance of the lifetime probability density distribution is not defined. In this way, we recover the result found in Castelló et al. (2007), where a characteristic lifetime could not be defined because of the existence of trapped dynamical metastable states. The best fit to the case with has an exponent smaller than unity, , indicating that a mean lifetime is not defined either. We note that for each network realization, the community sizes are sampled from a distribution, and the observed broad lifetime distribution is a result of averaging over several runs in many network realizations.
V Conclusions
In this study we set out to determine minimal network features that would produce broad lifetime distributions for the ordering dynamics described by the AB model. We have introduced the concept of dynamical robustness against invasion in relation to the dynamics of competing options to describe the resistance against outside influence of topological substructures that involve relative isolation from the rest of the network. Dynamical robustness is characterized by the survival time of the substructure, i.e., the characteristic time needed for this set of nodes before changing its option toward the one of the surrounding majority. In all of the topologies in which a broader than exponential distribution for the relaxation time of the whole system arose, we have identified substructures that individually have exponential lifetime distributions, implying a well defined survival time for such topologies. The broad distribution appears because of the heterogeneity of these substructures, such that the network has a variety of different substructures with different survival times.
In an Erdős-Rényi network, branches were seen to produce exponential lifetime distributions when isolated from the rest of the network. Their dynamical robustness has been proven to be affected by the diameter as well as the number and location of bifurcations. Lifetime distributions also appear to be exponential for isolated cliques, and the ratio has proven an appropriate topological measure to characterize the dynamical robustness of a clique.
In the case of networks with mesoscale structure built up from randomly connected cliques, it has been seen that simply the presence of communities is not a sufficient condition to produce a broader than exponential lifetime distribution. This was demonstrated by networks consisting of cliques with equal size and same out-degree, and hence equal dynamical robustness (EDH), where the lifetime distribution for the whole network has proven to be exponential. Although the interactions between the cliques in a network may cause clique lifetimes to deviate from those that arise in isolation, the broader than exponential lifetime distributions observed for ERH and EDE may in part be explained by the different dynamical robustness against invasion of the cliques forming the network, leading to a combination of exponential processes with various time scales. The most interesting feature is obtained for EDE networks where we have recovered the main results in Castelló et al. (2007), i.e. very broad with a best power law fit such that the second moment of the distribution is not defined, and therefore there does not exist a characteristic time scale for the dynamics. The results in this paper might be generic for a class of models where the dynamics at the interfaces is curvature driven.
In summary, complementing studies on the effects of heterogeneous interacting agents (a research line of growing interest Tessone et al. (2006)), we have seen that heterogeneity at the mesoscale level of the network of interaction results in non-trivial effects in the dynamics of ordering processes. A large variability in the dynamical robustness of different topological substructures appears to be a sufficient mechanism for the absence of a characteristic time for the dynamics. This mechanism causes the existence of dynamical metastable states that survive at any time scale. Substructures might have a well defined survival time, but the existence of a variety of substructures with different dynamical robustness (characterized by different survival times) results in a very broad that does not allow to identify a characteristic relaxation time for the whole system.
Acknowledgments
The authors acknowledge financial support from EU COST action P10 that enabled co-operation in the form of research visits. The work was also supported by the MEC (Spain) through project FISICOS (FIS2007-60327), by the European Commission through the NESTComplexity project PATRES (043268), and by the Academy of Finland, Center of Excellence program 2006-2011. X.C. also acknowledges financial support from a Ph.D. fellowship of the Govern de les Illes Balears (Spain), and R.T. was also supported by the ComMIT graduate school.
References
- Marro and Dickman (1999) J. Marro and R. Dickman, Nonequilibrium Phase Transitions in Lattice Models (Cambridge University Press: Cambridge, UK, 1999).
- Castelló et al. (2007) X. Castelló, R. Toivonen, V. M. Eguíluz, J. Saramäki, K. Kaski, and M. San Miguel, Europhys. Lett. 70, 66006 (2007).
- Scott (2000) J. Scott, Social network analysis: A Handbook, 2nd ed. (Sage, London, 2000).
- Fortunato and Castellano (2009) S. Fortunato and C. Castellano, in Encyclopedia of Complexity and System Science, edited by R. A. Meyers (Springer, 2009), URL arXiv:0712.2716.
- Newman (2004) M. Newman, Eur. Phys. J. B 38, 321 (2004).
- Danon et al. (2005) L. Danon, A. Díaz-Guilera, J. Duch, and A. Arenas, J. Stat. Mech.: Theory Exp. (2005) P09008.
- Danon et al. (2007) L. Danon, J. Duch, A. Arenas, and A. Díaz-Guilera, in Large Scale Structure and Dynamics of Complex Networks: From Information Technology to Finance and Natural Science (World Scientific, Singapore, 2007), pp. 93–113.
- Radicchi et al. (2004) F. Radicchi, C. Castellano, F. Cecconi, V. Loreto, and D. Parisi, Proc. Natl. Acad. Sci. (USA) 101, 2658 (2004).
- Arenas et al. (2004) A. Arenas, L. Danon, A. Díaz-Guilera, P. Gleiser, and R. Guimerá, Eur. Phys. J. B 38, 373 (2004).
- Newman and Girvan (2004) M. Newman and M. Girvan, Phys. Rev. E 69, 026113 (2004).
- Palla et al. (2005) G. Palla, I. Derényi, I. Farkas, and T. Vicsek, Nature 435, 814 (2005).
- Palla et al. (2007) G. Palla, A.-L. Barabási, and T. Vicsek, Nature 446, 664 (2007).
- Kumpula et al. (2007) J. M. Kumpula, J.-P. Onnela, J. Saramäki, K. Kaski, and J. Kertész, Phys. Rev. Lett. 99, 228701 (2007).
- Vega et al. (2004) Y. M. Vega, M. Vázquez-Prada, and A. F. Pacheco, Physica A 343, 279 (2004).
- Arenas and Díaz-Guilera (2007) A. Arenas and A. Díaz-Guilera, Eur. Phys. J. B 143, 19 (2007).
- Arenas et al. (2006) A. Arenas, A. Díaz-Guilera, and C. J. Pérez-Vicente, Phys. Rev. Lett. 96, 114102 (2006).
- Oh et al. (2005) E. Oh, K. Rho, H. Hong, and B. Kahng, Phys. Rev. E 72, 047101 (2005).
- Zhou et al. (2007) T. Zhou, M. Zhao, G. Chen, G. Yan, and B.-H. Wang, Phys. Lett. A 368, 431 (2007).
- Arenas et al. (2008) A. Arenas, A. Díaz-Guilera, J. Kurths, Y. Moreno, and C. Zhou, Phys. Rep. 469, 93 (2008).
- Onnela et al. (2007) J.-P. Onnela, J. Saramäki, J. Hyvönen, G. Szabó, D. Lazer, K. Kaski, J. Kertész, and A.-L. Barabási, Proc. Natl. Acad. Sci. (USA) 104, 7332 (2007).
- Lozano et al. (2008) S. Lozano, A. Arenas, and A. Sánchez, PLoS ONE 3, e1892 (2008).
- Krapivsky and Redner (2003) P. L. Krapivsky and S. Redner, Phys. Rev. Lett. 90, 238701 (2003).
- Lambiotte et al. (2007) R. Lambiotte, M. Ausloos, and J. Holyst, Phys. Rev. E 75, 030101(R) (2007).
- Castelló et al. (2006) X. Castelló, V. M. Eguíluz, and M. San Miguel, New J. Phys. 8, 308 (2006).
- Son et al. (2006) S.-W. Son, H. Jeong, and J. D. Noh, Eur. Phys. J. B 50, 431 (2006).
- Fu and Anderson (1986) Y. Fu and P. W. Anderson, J. Phys. A: Math. Gen. 19, 1605 (1986).
- Reichardt and Bornholdt (2004) J. Reichardt and S. Bornholdt, Phys. Rev. Lett. 93, 218701 (2004).
- Blatt et al. (1996) M. Blatt, S. Wiseman, and E. Domany, Phys. Rev. Lett. 76, 3251 (1996).
- Zhou (2003) H. Zhou, Phys. Rev. E 67, 061901 (2003).
- Eriksen et al. (2003) K. A. Eriksen, I. Simonsen, S. Maslov, and K. Sneppen, Phys. Rev. Lett. 90, 148701 (2003).
- Simonsen (2005) I. Simonsen, Physica A 357, 317 (2005).
- Holley and Liggett (1975) R. Holley and T. Liggett, Ann. Probab. 4, 195 (1975).
- Dornic et al. (2001) I. Dornic, H. Chaté, J. Chave, and H. Hinrichsen, Phys. Rev. E 87(4), 045701(4) (2001).
- Al-Hammal et al. (2005) O. Al-Hammal, H. Chaté, I. Dornic, and M. A. Munoz, Phys. Rev. Lett. 94, 230601 (2005).
- Gunton et al. (1983) J. Gunton, M. San Miguel, and P. Sahni, Phase Transitions and Critical Phenomena (London: Academic, 1983), pp. 269–46, 8th ed.
- Abrams and Strogatz (2003) D. M. Abrams and S. H. Strogatz, Nature 424, 900 (2003).
- Minett and Wang (2008) J. W. Minett and W. S.-Y. Wang, Lingua 118, 19 (2008), ISSN 0024-3841.
- Castelló et al. (2008) X. Castelló, R. Toivonen, V. M. Eguíluz, L. Loureiro-Porto, J. Saramäki, K. Kaski, and M. San Miguel, in The Evolution of Language: Proceedings of the 7th International Conference (EVOLANG7), edited by A. Smith, K. Smith, and R. Ferrer-Cancho (World Scientific, Singapore, 2008), pp. 59–66.
- Toivonen et al. (2006) R. Toivonen, J.-P. Onnela, J. Saramäki, J. Hyvönen, and K. Kaski, Physica A 371, 851 (2006).
- Erdős and Rényi (1959) P. Erdős and A. Rényi, Publ. Math. (Debrecen) 6, 290 (1959).
- da F. Costa et al. (2007) L. da F. Costa, F. A. Rodrigues, G. Travieso, and P. R. Villas Boas, Advances in Physics 56, 167 (2007).
- Tessone et al. (2006) C. Tessone, C. Mirasso, R. Toral, and J. Gunton, Phys. Rev. Lett. 97, 194101 (2006).
- Guimerá et al. (2004) R. Guimerá, M. Sales-Pardo, and L. A. N. Amaral, Phys. Rev. E 70, 025101(R) (2004).