Heavy Quark Production at the Tevatron
Abstract
Results are presented from four CDF analyses involving heavy quark production in proton-antiproton collisions at center of mass energy 1.96 TeV. The shapes of b-jets are found to be broader than inclusive predictions and broader than both PYTHIA and HERWIG defaults. A measurement of the production cross section for is consistent with Run 1 results and with theoretical predictions associated with parton distribution function energy dependence. The inclusive b-jet production cross section is also consistent with theoretical predictions over six orders of magnitude. The differential production cross section is compared to several theoretical models and found to be best described by MC@NLO + JIMMY.
I Introduction
We report on four measurements by the CDF Experiment cdf of processes involving heavy quark production. All use data recorded at center of mass energy 1.96 TeV at the Fermilab Tevatron Collider during Run II.
II Measurement of -jet Shapes in Inclusive Jet Production
The structure of jets derives from the gluon emissions from the primary parton involved. In heavy quark jets, the quark decay must be modeled as well as the underlying event. Multi-gluon emission is difficult to calculate so is often approximated by parton shower models. Jet shape is known to depend upon whether the primary parton is a quark or a gluon, and it is also expected to depend upon flavor. It is expected to depend as well upon the production mechanism; for example, the and from gluon splitting are expected to be often in the same jet frixione , producing a broader jet than does flavor creation. Measurement of jet shapes casts light on all these aspects of jet evolution and heavy flavor production.
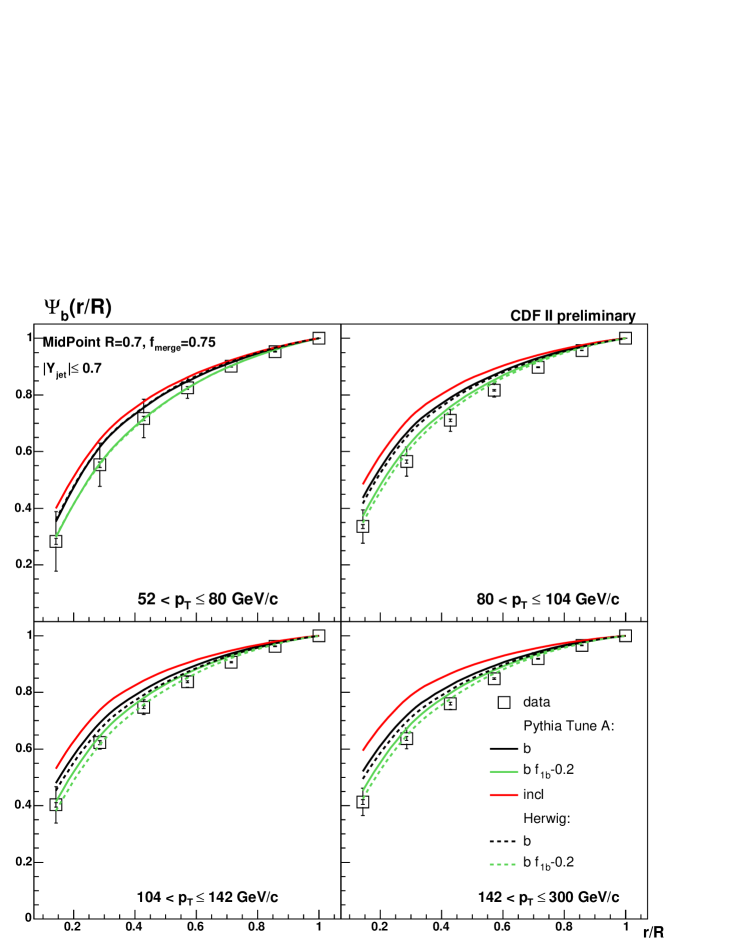
To address the question of whether the fraction of -jets originating from gluon splitting, and its evolution, is well described by contemporary models, we define the jet shape, a measure of the fraction of total jet transverse momentum , inside a given radius in the space of rapidity and azimuthal angle . This is , the fraction of total in cone carried by particles in subcone , averaged over an ensemble of jets, normalized to 1, and defined such that and particles outside the cone are excluded.
The -jet event selection begins with triggers based solely on calorimeter transverse energy . Trigger Level 1 requires one calorimetric trigger tower above a threshold between 5 and 10 GeV. Level 2 seeks clusters about the Level 1 towers among adjacent towers above 1 GeV and requires that at least one cluster exceed a threshold between 15 and 90 GeV. Level 3 applies the Run 1 cone algorithm jetclu and imposes greater than 20 to 100 GeV. The jet minimum requirement is set to ensure that only events for which the trigger is efficient are used. Offline the jets are reconstructed by the Midpoint Cone Algorithm midpoint . The selection of b-jets is then enhanced by requiring a secondary vertex. Because ’s tend to be found near the jet axis, the search for them uses a cone of radius in space. Tracks are ranked by reconstruction quality, including the contribution from the distance of closest approach to the primary vertex. The algorithm next attempts to reconstruct a secondary vertex, beginning with the highest quality track. If this succeeds, a cut is placed on the significance of the two-dimensional projection along the jet axis of the distance between the primary and secondary vertices. General event quality cuts follow, including a rejection of multiple interactions (there must be one and only one primary vertex with cm), a rejection of cosmics based on the significance of the missing , and a requirement of jet centrality: . The jet is corrected to the hadron level by matching hadron and calorimeter level jets in Monte Carlo, a correction that increases the by 20% to 10% with no change in jet shape.
The requirement of the secondary vertex tag biases the measured jet shapes by demanding clean, well-defined tracks. An -dependent correction for this is needed. There are additionally corrections for the presence of non- jets misidentified as -jets, corrections for detector effects (for example, the number of calorimeter towers scales with ), and a correction for the presence of a second quark in the jet. The data are fitted to two- and one- templates separately. The final function to be fitted is given by , where is the unfolding factor , is the measured jet shape for the tagged sample, is the measured inclusive jet shape, is the purity of ’s in the tagged jet sample, and and correct for biases to the jet shape arising from the secondary vertex requirement. The data are compared to predictions by PYTHIA, with Tune A pythia , and HERWIG v 6.506 herwig . The principle systematics are associated with the choice of Monte Carlo model, the effect of the calorimeter model, the jet energy calibration, and assumptions about the -quark content of the jets.
The results of the study result , for integrated luminosity 300 pb-1, are shown in Figure 1, for 4 bins in . In each bin, the data are compared to the PYTHIA prediction for inclusive jets as well as the PYTHIA and HERWIG predictions for single production and for single production with the default fraction diminished by 20%. One sees that the data are incompatible with the inclusive prediction: the jet shapes are evidently influenced by the presence of heavy quarks, and -jets are broader. One also sees that the data jets are broader than the PYTHIA and HERWIG defaults; the leading order models underestimate the fraction of ’s from gluon splitting and the fraction of jets with two ’s.
III Measurement of the Production Cross Section of the
The mechanism for producing heavy vector mesons in hadron collisions is not well understood. CDF Run I data on production cross sections for prompt and were one to two orders of magnitude above predictions by color singlet models. Subsequent theoretical efforts nrqcd with adjusted production matrix elements match the cross section but predict increasing transverse polarization with production that is not confirmed by the data abulencia . New approaches kt ; tower have been proposed. The is a good testing ground for studying charmonium hadroproduction as there are no significant charmonium states above it to produce feeddown. The goal of this study is a measurement of for GeV/c.
The data selection begins with muons reconstructed in four layers of the central tracking chamber and matched to three to four hit tracks in the muon detector. Events that pass the dimuon trigger, which requires two opposite sign tracks, each with significant , are required to have three hits in the silicon vertex detector SVX II. The mass and lifetime are fit with a lifetime function, and requirements are placed on the dimuon mass, GeV/c2, and rapidity .
CDF separates the signal from background, and the prompt from the -decay ’s, with an unbinned maximum likelihood fit in candidate mass and proper decay length . The mass separates the signal from the background. The signal is modeled with the Crystal Ball Function cbf , a Gaussian core with a low side tail. The mass background is modeled with a first order polynomial. The prompt signal is separated from the feeddown with a -fit. The prompt signal is given by a double Gaussian centered on zero. The long-lived signal is modeled by an exponential convoluted with a Gaussian. The lifetime background is modeled by a prompt double Gaussian plus symmetric, positive-, and negative- long-lived components. The likelihood function is given by , where the ’s are fractions of signal (, from the total number of candidates in the fit), prompt (), symmetric long-lived background (sym), positive- long-lived background (+), and negative- long-lived background(-). The ’s are probability density functions for signal mass , linear mass background , prompt signal double Gaussian proper time , an exponential convolved with a Gaussian for -decay signal , and lifetime backgrounds (, , and ).
The efficiency calculation is given by the product of six terms whose values range from 95.3% to 99.9%. The acceptance calculation is complicated by the fact that acceptance depends upon polarization per bin, yet CDF polarization data on the are too weak for direct application. The polarization, for which strong CDF data exist, are, however, expected to correlate highly with prompt polarization, so after confirming that the and polarization data are consistent, CDF applies the polarization values to the bins. Monte Carlo samples are generated with fixed polarizations at the extreme values of 0 and -1 and with flat distributions in , , and . These samples are simulated in the CDF detector and reconstructed. We compute the product of geometrical acceptance and trigger efficiency, , where for generated events, survive geometric and reconstruction requirements and survive the trigger. ranges from 0.0053 to 0.2548. We interpolate the data to intermediate polarization values predicted from the data. The principle systematic uncertainties on this measurement are associated with the luminosity, the reconstruction efficiency, the dimuon trigger efficiency, and the polarization. The variation of the prescale during the course of collecting integrated luminosity 1.1 fb-1 produces an effective integrated luminosity of 954 pb-1.
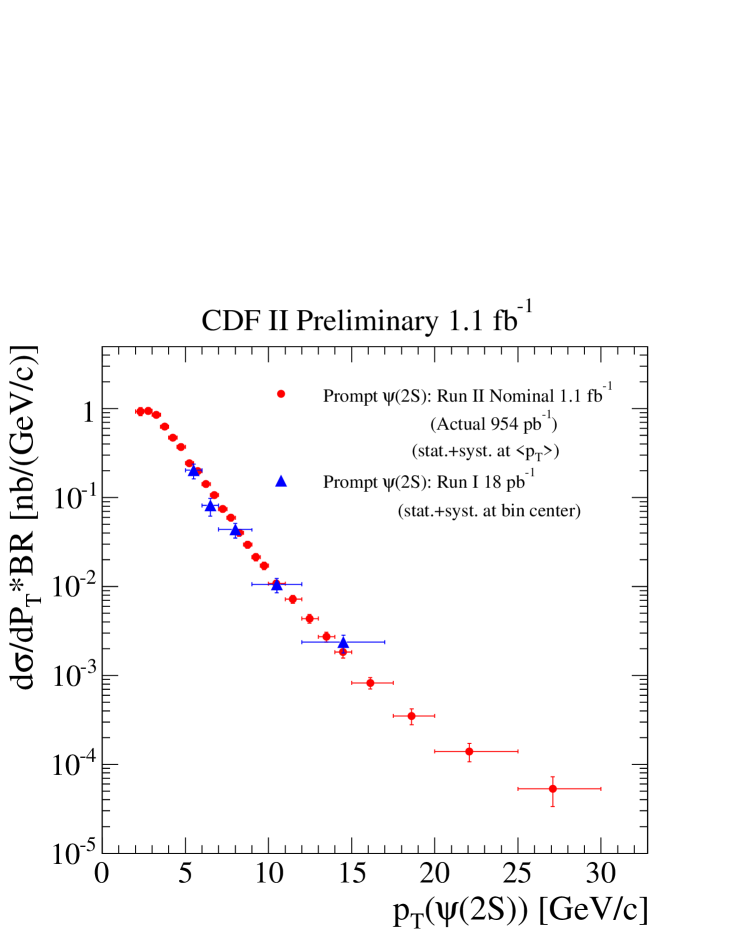
The resulting prompt differential cross section is shown in Figure 2. One sees that in all three cases, the Run I result is confirmed with an order of magnitude more statistics. The measured value of is nb. The ratio of the Run II to the Run I result, for identical ranges in , is . The theoretical prediction anikeev for this ratio, including the energy dependence of the parton distribution functions, is .
IV Study of Inclusive -jet Production
Measurements of quark production in hadronic collisions test perturbative QCD. The CDF Run I inclusive meson cross section measurement b motivated theoretical developments beyond next-to-leading order nlo . Continued comparisons, at higher and with increased statistics, may motivate further improvements.
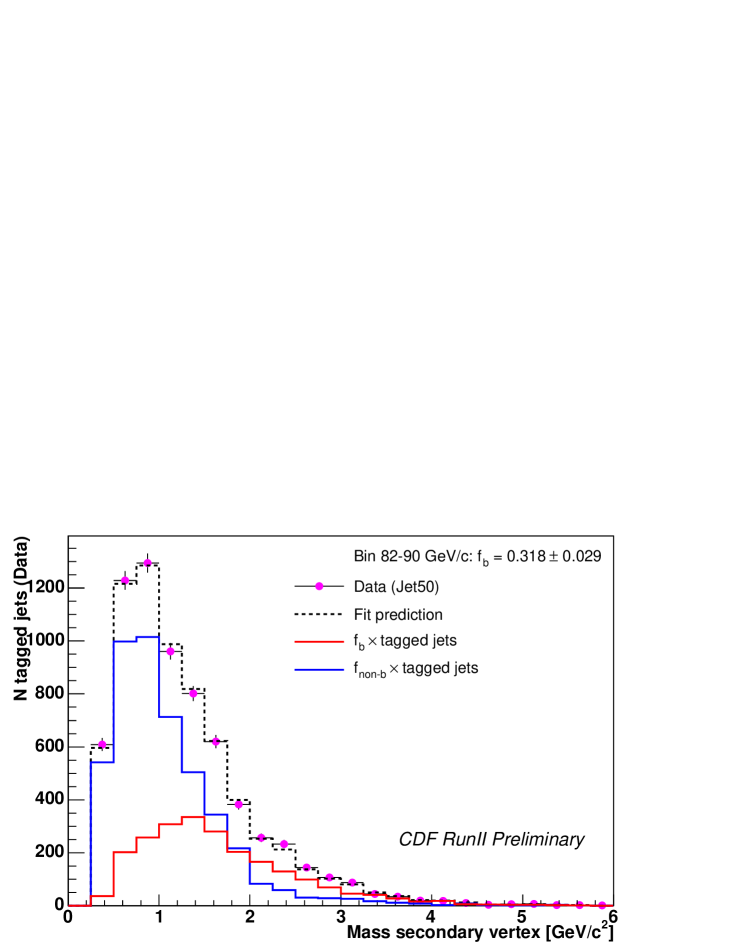
This study considers events whose primary vertex has cm, whose missing is not significant, and whose kinematical variables lie in the range GeV/c and , with jets reconstructed with the Midpoint Cone Algorithm and heavy flavor jets tagged via their secondary vertices. The jet energy corrections are based on minimum bias events which measure the deposited in the calorimeter, as a function of the number of primary vertices, and indicate a value of GeV/c per extra vertex. Monte Carlo events from PYTHIA 6.203, with Tune A and the CTEQ5L parton distribution function set, are used to correct the measured energy for effects of partially instrumented regions and calorimeter nonlinearities. Typical unfolding factors range from 1.6 to 2.1. The quark content of the jet is inferred from the shape of the invariant mass of all charged tracks attached to the secondary vertex, as shown in Figure 3. The measurement is compared to the theoretical prediction described in frixione2 .
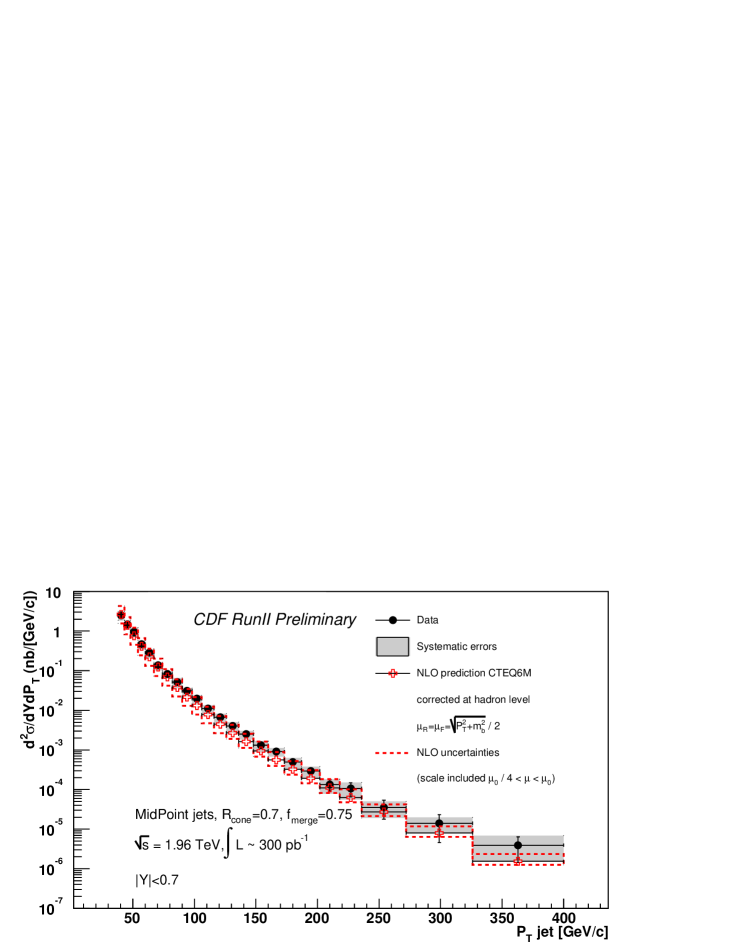
The measured differential cross section, , is shown in Figure 4 for integrated luminosity 300 pb-1. Here is the number of tagged jets in each bin, is the bin size, is the fraction of jets in the tagged sample (this ranges from 0.35 at low to 0.14 at high), is the -tagging efficiency, is the jet rapidity range, and is the luminosity. The measured cross section is consistent with the theoretical prediction throughout the full six orders of magnitude of range in . It exhibits a strong dependence on scale , however, which suggests that higher orders may make large contributions. The largest systematic uncertainties derive from the luminosity, the jet energy scale, the jet energy resolution, the unfolding process, the -tagging efficiency, and the fraction of -jets, and produce a total systematic uncertainty that ranges from at low to at high .
V Study of the Production of Dijets
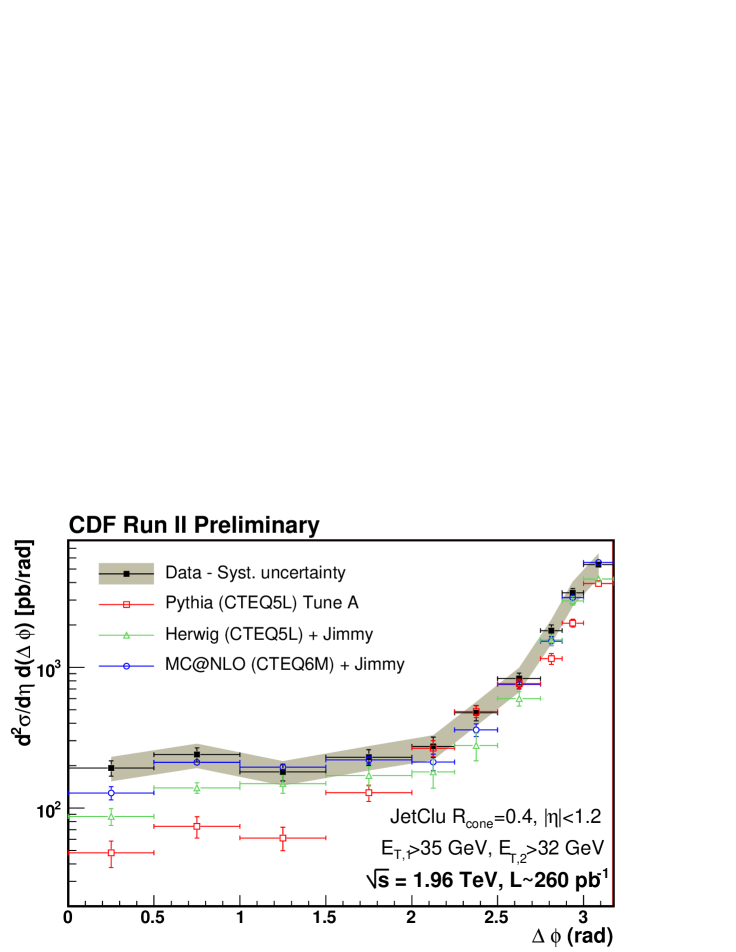
Momentum conservation requires that the azimuthal angle between a and produced at lowest order must be . Higher order QCD processes produce additional partons in the final state, modifying the range of allowed azimuthal angle difference, . Order diagrams are thought to contribute the same magnitude to the cross section as order diagrams. Measuring the cross section as a function of provides information on the contributions of the leading order and next-to-leading order terms.
The event selection requires two central calorimeter towers with significant in association with two tracks in the central tracking chamber with significant . The calorimeter towers are clustered, and the tracks are reconstructed with the Silicon Vertex Trigger svt . Events having two clusters with significant associated with two tracks having significant displaced vertices are retained. Jets are reconstructed with the Run I cone algorithm. One or more high-quality primary vertices are required. Corrections are applied to the jet energy scale as well as to the energies of -jets (whose fragmentation, for example, is harder than that of light quarks). The presence of two jets with significant , both -tagged and with displaced secondary vertices, is confirmed. The data are compared to predictions by PYTHIA, with Tune A; HERWIG; and MC@NLO mcnlo with the HERWIG parton shower and the underlying event generated by Jimmy 4.3 jimmy . The systematics are dominated by the jet energy scale and range from 20 to 30%.
For integrated luminosity 260 pb-1, all three Monte Carlos show similar agreement with data distibutions of production cross section versus leading jet and versus dijet invariant mass. The cross section as a function of , however, is significantly better modeled by MC@NLO, as shown in Figure 5. The peak at large angles reflects flavor creation, and the excess at small angles is due to higher order diagrams and multiple interactions. The measured total cross section for , GeV, and GeV is pb.
References
- (1) D. Acosta et al., Phys. Rev. D 71, 032001 (2005).
- (2) S. Frixione et al., hep-ph/9702287.
- (3) F. Abe et al., Phys. Rev. D 45, 1448 (1992).
- (4) G.C. Blazey et al., hep-ex/0005012; D. Acosta et al., Phys. Rev. D 74, 071103(R), 2006.
- (5) T. Sjöstrand et al., Comp. Phys. Comm. 135, 238 (2001); R. Field and R. Group, arXiv: hep-ph/0510198.
- (6) G. Corcella et al., JHEP 01, (2001) 010.
- (7) A. Abulencia et al., arXiv:0806.1699 [hep-ex], 2008.
- (8) G.T. Bodwin, E. Braaten, and G.P. Lepage, Phys. Rev. D 51, 1125 (1995); E. Braaten and S. Fleming, Phys. Rev. Lett. 74, 3 327 (1995).
- (9) A. Abulencia et al., Phys. Rev. Lett. 99, 132001 (2007).
- (10) S.P. Baranov, Phys. Rev. D 66, 114003 (2002).
- (11) V.A. Khoze et al., Eur. Phys. J. C 39, 163 (2005).
- (12) J. Gaiser, SLAC-0255 (1982).
- (13) K. Anikeev et al., hep-ph/0201071 (2001).
- (14) F. Abe et al., Phys. Rev. Lett. 75, 1451 (1995).
- (15) M. Cacciari and P. Nason, Phys. Rev. Lett. 89, 122003-1 (2002).
- (16) S. Frixione and M. Mangano, Nucl. Phys. B 483, 321 (1997).
- (17) A. Bardi et al., Nucl. Instr. and Meth. A 485, 178 (2002).
- (18) S. Frixione and B. Webber, JHEP 0206 (2002) 029.
- (19) J.M. Butterworth, J.R. Forshaw, M.H. Seymour, Z. Phys. C 72, 637 (1996).