Criticality Characteristics of Current Oil Price Dynamics
Abstract
Methodology that recently lead us to predict to an amazing accuracy the date (July 11, 2008) of reverse of the oil price up trend is briefly summarized and some further aspects of the related oil price dynamics elaborated. This methodology is based on the concept of discrete scale invariance whose finance-prediction-oriented variant involves such elements as log-periodic self-similarity, the universal preferred scaling factor , and allows a phenomenon of the ”super-bubble”. From this perspective the present (as of August 22, 2008) violent - but still log-periodically decelerating - decrease of the oil prices is associated with the decay of such a ”super- bubble” that has started developing about one year ago on top of the longer-term oil price increasing phase (normal bubble) whose ultimate termination is evaluated to occur in around mid 2010.
05.45.Pq, 52.35.Mw, 47.20.Ky
E-mail address: Stanislaw.Drozdz@ifj.edu.pl
Recent violent price changes and the related speculative bubbles on the world commodity market - such as the precious metals market or the oil market - provide further very valuable ground to test the basic components of what we globally term ”the prediction oriented variant of financial log-periodicity” [1]. The most relevant of these components include the self-similar log-periodicity [2] which may originate from the discrete scale invariance [3] and allows to make link to the critical phenomena [4], the postulated existence of the corresponding universal preferred scaling factor which is common to all the markets and all time scales [2, 5], and even more exotic effects like the ”super-bubbles” [5] - phenomena that seem exclusive to the financial markets dynamics.
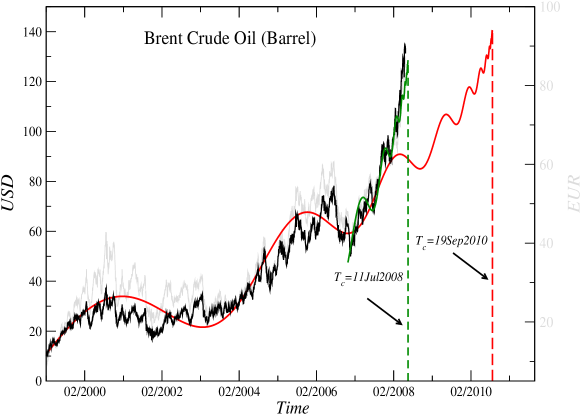
As far as the commodity market is concerned in a recent paper [6] (available also as ref. [7]) we have presented a prediction for the Spring 2008 reversal of the up trend on the precious metals market. Time satisfactorily verified this prediction. While ref. [6] was in press we started extending the same methodology to the oil market. The corresponding log-periodic interpretation of the oil price dynamics over the time period 2000-2010 was publicly disclosed as an insertion (note added) to ref. [7] on June 23, 2008 and unchanged is here shown in Fig. 1. In fact, already at an earlier stage of these investigations, on April 15, 2008, exactly the same illustration has been delivered to Wojciech Białek, SEB (Skandinaviska Enskilda Banken) TFI analyst (see his website [8]).
Since in the corresponding methodology it is the oscillation pattern that carries the most relevant information about the market dynamics, for transparency a simple representation of the log-periodicity in the form
| (1) |
is used, where . The continuous lines seen in Fig. 1 are then drawn according to the following equation:
| (2) |
where the first term represents a standard power-law that is characteristic of continuous scale-invariance with the critical exponent . The second term introduces a correction that is periodic in . In the financial context represents a distance to the critical time . Thus , where denotes the clock time labelling the original price time series.
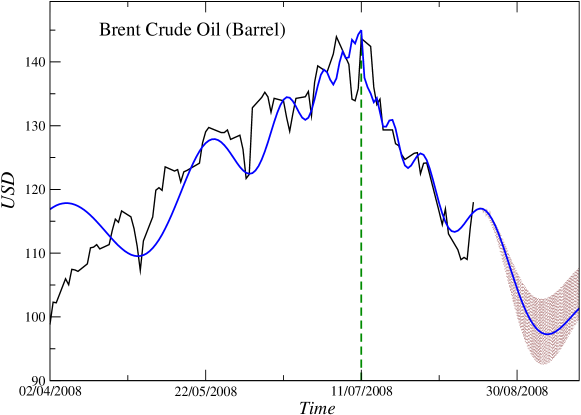
As is seen in this Figure the sharp increase of the oil price since Summer 2007 can be recognized to be clearly log-periodic with indicating July 11, 2008 as the end of this phase of increase in the oil market. We typically do not demand that much of accuracy but this time the agreement was perfect. It was exactly that day when the New York traded oil price approached maximum of 148 USD but closed already lower and sharply started dropping since. Magnifying the vicinity of this date and including the oil price changes up to present (August 22, 2008) results in a picture which is illustrated in Fig. 2. A new but consistent element seen here is that the present oil market declining phase is developing the decelerating log-periodic oscillations starting on July 11 and their sequence well corresponds to - a condition which makes it reliable. Accordingly, extrapolation of this oscillatory pattern points to the possibility of a further oil price decline in the coming weeks to a level even below 100 USD. Such a possibility has already been expressed in ref. [7]. After that however, from what we learn [9] from the stock markets in analogous phases of their dynamics, such a log-periodically decelerating phase is likely to dissolve and thus the market may start resuming the up trend.
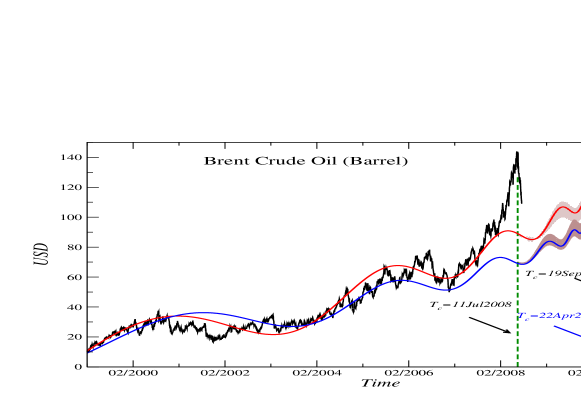
Such a scenario is also in accord with the longer time perspective to view the oil price dynamics. As it is also shown in Fig. 1, in order to grasp the corresponding development since about the year 2000 within the consistent log-periodic framework with the same preferred universal scaling factor the last months oil price accelerated elevation is to be considered as one of the consecutive increases in the sequence of long-term log-periodic pattern which gets boosted into a local bubble on top of a long-term bubble and therefore it is termed a ”super-bubble” [5]. History of the financial markets provides several examples of such effects [5]. When such a ”super-bubble” crashes the system returns to a normal bubble state that eventually ends at the time determined by the long-term patterns. In the present case of the oil market, as it has been indicated in Fig. 1, the time of un ultimate reverse of the present long-term up trend may correspond to the late Summer in 2010, thus several months after the stock market enters a serious recession. A more precise evaluation of the related should be possible after the oil market fully expresses the size and duration of the correction due to decay of the recent ”super-bubble” that has ended on July 11, 2008. The current degree of uncertainty regarding is indicated in Fig. 3.
Interpreting thus recent developments on the world oil market in terms of the financial log-periodicity provides further arguments in favor of this theoretical concept and, in particular, of such its elements like the existence of the universal preferred scaling factor and appearance of the ”super-bubbles”. The precision of the reported here real prediction exposes a predictive potential of the corresponding methodology.
We thank Wojciech Białek for a stimulating correspondence.
References
- [1] S. Drożdż, F. Grümmer, F. Ruf, J. Speth, in Practical Fruits of Econophysics: Proceedings of the Third (2004) Nikkei Econophysics Symposium, ed. H. Takayasu, Springer, Tokyo 2006, p. 93-98; available also as arXiv:physics/0503006
- [2] S. Drożdż, F. Ruf, J. Speth, M. Wójcik, Eur. Phys. J. B 10, 589 (1999)
- [3] D. Sornette, Phys. Rep. 297, 239 (1998)
- [4] D. Sornette, Why Stock Markets Crash: Critical Events in Complex Financial Systems, (Princeton University Press, Princeton, 2003)
- [5] S. Drożdż, F. Grümmer, F. Ruf, J. Speth Physica A 324, 174 (2003)
- [6] S. Drożdż, J. Kwapień, P. Oświȩcimka, J. Speth, Acta Phys. Polonica A 114, 539 (2008)
- [7] S. Drożdż, J. Kwapień, P. Oświȩcimka, J. Speth, arXiv:0802.4043v2
- [8] http://wojciechbialek.blox.pl/html/1310721,262146,20.html?8
- [9] M. Bartolozzi, S. Drożdż, D. B. Leinweber, J. Speth, A. W. Thomas, Int. J. Mod. Phys. C 16, 1347 (2005)