The Embedded Massive Star Forming Region RCW 38
Abstract
RCW 38 is a uniquely young (1 Myr), embedded () stellar cluster surrounding a pair of early O stars (O5.5) and is one of the few regions within 2 kpc other than Orion to contain over 1000 members. X-ray and deep near-infrared observations reveal a dense cluster with over 200 X-ray sources and 400 infrared sources embedded in a diffuse hot plasma within a 1 pc diameter. The central O star has evacuated its immediate surroundings of dust, creating a wind bubble 0.1 pc in radius that is confined by the surrounding molecular cloud, as traced by millimeter continuum and molecular line emission. The interface between the bubble and cloud is a region of warm dust and ionized gas, which shows evidence for ongoing star formation. Extended warm dust is found throughout a 2–3 pc region and coincides with extended X-ray plasma. This is evidence that the influence of the massive stars reaches beyond the confines of the O star bubble. RCW 38 appears similar in structure to RCW 49 and M 20 but is at an earlier evolutionary phase. RCW 38 appears to be a blister compact HII region lying just inside the edge of a giant molecular cloud.
Harvard–Smithsonian Center for Astrophysics, Cambridge MA 02138, USA
Harvard–Smithsonian Center for Astrophysics, Cambridge MA 02138, USA
Lincoln Laboratory, Massachusetts Institute of Technology, Lexington MA 02420, USA
1. Introduction
The evolution of high mass clustered star forming regions is complex and poorly understood. Only the nearby (400 pc), optically revealed, Orion Nebula Cluster (ONC) is well studied (see Muench et al. and O’Dell et al. in this Handbook). Yet, a wide variety of high mass embedded clusters is found within 2 kpc of the Sun. Within this limit, the young cluster RCW 38 (08h59m47.2s -47∘31′57′′ (J2000), l,b = ) is one of the few regions other than the ONC to contain over 1000 members (Lada & Lada 2003; Wolk et al. 2006). RCW 38 has an embedded and dense stellar population, comparable to other regions that have been studied recently with Spitzer (e.g., M 20 and RCW 49; Rho et al. 2004, Whitney et al. 2004, Churchwell et al. 2004). RCW 38 provides a unique opportunity to study the evolution of a rich cluster during the phase where its most massive members, a pair of O5.5 stars (DeRose et al. 2008) have just completed their ultracompact HII region (UCHII) phase and are now greatly influencing its natal environment and the evolution of its low mass members.
2. Overview
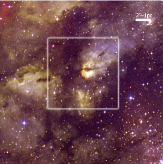
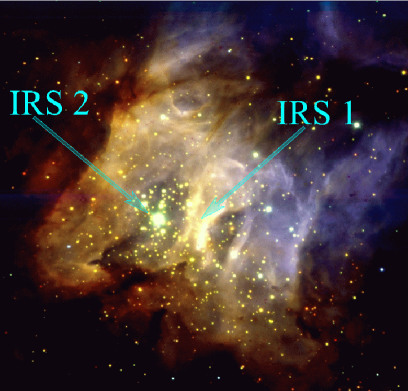
RCW 38 was catalogued in both the H survey by Rodgers, Campbell & Whiteoak (1960) and the earlier survey of southern HII regions (Gum 1955) as a moderately bright region of emission about 40′ on a side (Figure 1). Radio surveys during the 1960’s indicated that it was one of the brightest HII regions at radio wavelengths (e.g., Wilson et al. 1970). The radio brightness made it an early candidate supernova remnant until its spectrum was shown to be thermal. A complicating factor in the study of RCW 38 is that it is adjacent to the Vela Molecular Ridge (see the chapter by Pettersson). In fact, there is a faint ring shape structure – perhaps a supernova remnant (SNR) – in apparent contact with the star forming cloud (RX J0852.0-4622). However, this seems to be a chance superposition as the SNR is about a factor of two closer than RCW 38 based on absorption arguments (Aschenbach et al. 1999). The 5 GHz survey by Shaver & Goss (1969) shows RCW 38 as both a bright continuum source at multiple wavelengths (Shaver & Goss 1970) and broad in its extent of greater than 30′ in diameter. It was not until the early 1970’s that this region was clearly associated with massive young stars (Johnson 1973). The next year, with improving resolution and detectors, H90 observations indicated that the radio peak of the region had a ring–like shape about 2′ across (Huchtmeier 1974). Figure 1 shows an optical view of the RCW 38 region. Note the central region is opaque due to high extinction. This has confined the study of the central region mostly to infrared and radio wavelengths. Several infrared studies indicated a “ring–like” or “horseshoe” structure around IRS 2 (Figures 2,3), which is also seen in high resolution radio and millimeter wavelength studies (Vigil 2004; Wolk et al. 2006). These structures are shown in detail in Figure 3. There are two defining infrared sources in RCW 38 (Frogel & Persson 1974) – the brightest at 2 m is labeled IRS 2 and the brightest at 10 m is referred to as IRS 1.
3. IRS 1
Frogel & Persson (1974) studied RCW 38 at 10 m with moderate spatial resolution (14.5′′) and found that the warm dust emission follows a horse-shoe shape across a arcmin2 area; they labeled the brightest unresolved peak in its western side IRS 1. Epchtein & Turon (1979) mapped the central region of RCW 38, at 10 m, with about twice the resolution of Frogel & Persson and resolved IRS 1 into several discrete sources; they suggested that this may be a cluster of embedded stars, younger than those associated with IRS 2.
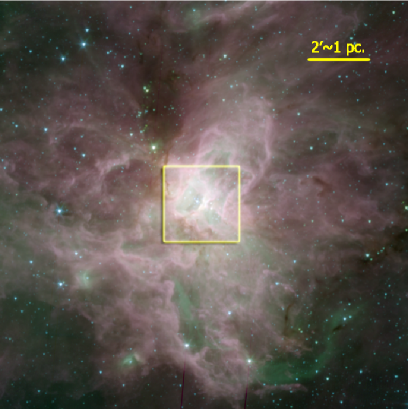
In MSX observations at 8.3 m the central region of RCW 38 exhibits a circular emission structure, perhaps slightly elongated about 2′ across, in agreement with the earlier mid-infrared studies. This is resolved by /IRAC observations at 3.6-8.0 m (Wolk PI) to show a roughly heart shaped region of polycyclic aromatic hydrocarbon (PAH) emission which includes numerous bubbles filled with 4.5 m diffuse emission (see Figure 2). The central region appears to lie within a large bubble about 0.4 pc across. The O5.5 binary IRS 2 appears to lie in the center of the bubble as seen in the mid- and near-infrared data (Sect. 4 and Figures 2 and 3). The inner face of the eastern part of the central bubble appears to be illuminated, giving the impression that we are not looking straight down the opening but rather offset by between 30 and 45 degrees.
Smith et al. (1999) made high resolution mid-infrared maps of the core region of RCW 38. They concentrated on the IRS 1 region that has the peak radio and 10 m emission. They found that IRS 1 is a dust ridge extending 0.1-0.2 parsec predominantly in the north–south direction less than 0.1 pc west of IRS 2. The dust ridge has a color temperature of about 175 K and has several condensations within it. They identify IRS 1 as the brightest peak among them, lying interior to all the other peaks about 12′′ west of IRS 2.
4. IRS 2
From its near-infrared (NIR) colors and assuming a distance of 1.5 kpc, Frogel & Persson (1974) suggested that the brightest 2 m source, IRS 2, is an early O-star (specifically O4) having about 12.8 magnitudes of visual extinction, or a group of later spectral type O stars. This is sufficient to account for the observed continuum emission at 5 GHz (Shaver & Goss 1970). Furniss, Jennings, & Moorwood (1975) combined broad-band 40-350 m measurements with the previous work of Frogel & Persson, deriving a total luminosity of 7 L⊙ and arguing that an O4 star would supply more than enough luminosity to account for all the infrared luminosity and emit enough Ly photons to yield twice the observed radio flux, unless significant absorption by dust is occurring. They suggest however that IRS 2 is an O5 star with little or no dust absorption of the continuum photons in the ionized region. The higher resolution imaging of Ligori et al. (1994) confirmed the presence of a cluster of at least 5 optically invisible young stellar objects embedded in nebular emission in the central 1.5′ near IRS 2.
Frogel & Persson (1974) produced detailed 1.25 – 20 m mapping of the region. At 10 m they confirm a ring-like structure with the bright 2 m source – IRS 2 – very near the center and a dominating 10 m source (IRS 1) about 10′′ to the west. A third 10 m source about 40′′ to the east of IRS 2 was also noted. Persson et al. (1976) revisited this region using narrow band photometry and found no evidence of silicates. Other narrow line infrared imaging such as Br- at 2.16 m also indicated an open center morphology centered on IRS 2 with enhanced emission toward IRS 1 (Mizutani et al. 1987).
Mid-infrared imaging and spectroscopy by Smith et al. (1999) provide further evidence that the ionizing source of the region is at least O5 or earlier. Through modeling of the ratio of emission lines at IRS1, the ionizing radiation field constrains the ionizing source to be between O4.5 and O5.5. Smith et al. find that the region surrounding IRS2 is depleted of dust, suggesting the region can be explained in terms of a wind-blown cavity, where winds from IRS2 have blown out the surrounding material.
DeRose et al. (2008) used adaptive optics imaging to directly show that IRS2 is a binary with equal mass members and a projected separation of 500 AU. The presence of two O stars of equal mass combined with the earlier data on luminosity and ionization imply that they have spectral types of O5.5.
5. Massive Stars
Muzzio (1979) and Muzzio & Celotti de Frecha (1979) identified OB stars throughout the southern sky using photometry and objective prism photography. They identified about 20 OB star candidates in the vicinity of RCW 38. All have absolute V magnitudes less than zero but are concentrated about 10–20′ southwest of IRS 2. Wolk et al. (2006) use the absolute K-band magnitudes of X–ray sources to determine the existence of 31 candidate OB stars over a 5 pc2 region centered on IRS 2. More than 20 of these are found to be in the central 1 pc. No unusual clustering to the southeast was noted. To make mass estimates they estimated the age of the cluster at 0.5 Myr and noted that if they assumed an age of 1 Myr, the number of OB stars would have more than doubled to a somewhat less reasonable value. However, the Wolk et al. sample was X-ray based and hence biased against finding soft OB stars behind more than 20 AV of extinction111Recent X-ray observations indicate that O stars are capable of producing very hard X-rays (e.g. Gagné et al. 2005). However, most B stars and about half of the observed O stars are still soft sources and hence observations in dusty regions are biased against detecting them.. The OB candidates remain to be confirmed.
6. Extinction
NIR imaging and photometry of the region by Storey & Bailey (1982) showed a number of highly reddened point sources and they deduced an AV of order 60 to the cluster. The 2MASS data show that the nebulosity associated with RCW 38 is extensive across a large area, with dust lanes and patches running throughout. Wolk et al. (2006) measure the extinction and hydrogen column to over a score of sources with good X-ray and NIR data and find AV ranging from 3 to 20 with strong evidence of NIR sources embedded in more than 30 magnitudes of visual extinction. Smith et al. (1999) find that the region around IRS 2 has a gas to dust ratio much lower than 100 to 1. Thus, this area is a true cavity and not just an extinction effect. Millimeter radio observations indicate that several hundred magnitudes of extinguishing material may lie behind the observed stars (see Section 11). Combining these results with the near–IR extinction observations suggests that RCW 38 is an embedded blister HII region lying just inside the front edge of a giant molecular cloud. Further, it appears that the HII region is compacted by the overlying material and beginning to break out in some locations.
7. The Embedded Stellar Cluster
Even in the remarkable /IRAC image (Figure 2) the scope and extent of the cluster is hard to ascertain. Only a few dozen sources are identifiable within the bright nebular emission. Outside the IR nebula cluster members are difficult to distinguish from background stars. We have found that 116 sources in the 2MASS catalog, corresponding to the region shown in Figure 3, have IR-excesses consistent with an optically thick disk at K–band. A number of the cluster members are directly exposed to IRS 2 in the cavity, and could be undergoing the same fate as the proplyds in the ONC (DeRose et al. 2008). Further, about 250 sources in the regions are Class I or Class II objects based on their IRAC colors. This group includes the 2MASS selected candidates. Most of these are clearly associated with RCW 38. However, at least 2 are associated with a background star forming region – BRAN 231A. Coincidences among the X-ray detected sources and NIR excess sources are found over 10′ from IRS 2 indicating that the cluster extends at least 5 pc.
The first hint of the extent of the low mass star population is provided by the spectacular NIR image of the heart of the region (Figure 3). Despite the small (2.5′ on a side) field of view, one can immediately ascertain several important features of the system from this image. First, the blue to red gradient indicates a steep dust extinction gradient increasing from northwest to southeast. Second, two regions are cleared of dust, one about 0.1 pc in diameter centered on IRS 2, and another of similar size, just west of IRS 1. Both of these cleared regions are visible in the optical plates indicating that extinction is not particularly high for these regions. The bright ridge separating the two cleared regions is the IRS 1 ridge which was mapped in detail by Smith et al. (1999). Third, there is a plethora of stars in this image. Over 480 stars are visible in this image and the vast majority of these are likely to be cluster members (Wolk et al. 2006, DeRose et al. 2008). The data are complete to the brown dwarf limit for extinctions less than an AV of 20 (Wolk et al. 2006). About 130 of the NIR sources have X–ray counterparts – there are fewer than a dozen X-ray sources without NIR counterparts in the central 2.5′. This leaves about 350 NIR detected cluster members not detected in X-rays – an incompleteness of over 70%. The X-ray counterparts demonstrate both membership in the cluster and masses of more than about 0.5 M⊙. Overall about 345 X-ray sources detected by in a 17′x 17′ field centered here are associated with RCW 38 (Wolk et al. 2006). Completeness arguments based on the cluster distance, obscuration, and X-ray sensitivity lead to a total estimated cluster size of between 1500 and 2400 stars. This makes RCW 38 the largest embedded cluster by membership within 2 kpc of the Sun, after the ONC.
8. Diffuse X-ray Emission
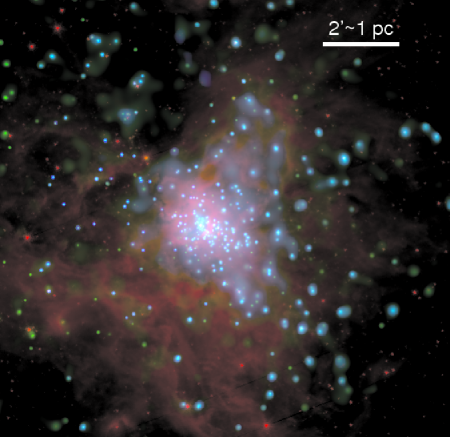
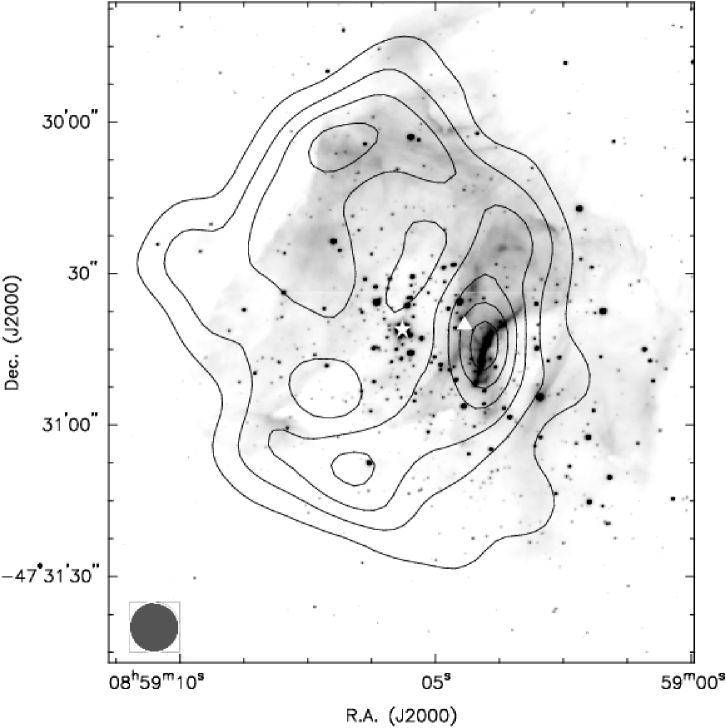
As shown in Figure 4, RCW 38 hosts very bright diffuse X-ray emission (Wolk et al. 2002). This X-ray emission differs from that of most other massive star forming regions because of its power-law spectrum indicative of synchrotron, not thermal, emission. Since the spectral signature is not that of stellar coronae this emission cannot be the sum of unresolved stars. Further, it implies the existence of a strong magnetic field. Synchrotron emission requires an electron population to be driven along a magnetic field. Indeed a significant magnetic field has been measured in the gas associated with RCW 38 (383 G; Bourke et al. 2001). Astrophysically, this is most common along the expanding shock front of a supernova remnant or during violent accretion onto a compact object with a large magnetic field. We noted earlier the existence of a possible supernova remnant in the field, it is offset from RCW 38 by about 6′ and there is known X-ray emission associated with this location. Further, the SNR is foreground to RCW 38 and the diffuse emission becomes more absorbed towards the southeast. This is the same pattern seen among the stars and nebulosity associated with RCW 38 – indicating that the diffuse X-ray emission is co–located with the stars and dust of RCW 38.
RCW 38 is the first and currently only known source of diffuse synchrotron X-ray emission from a very young star forming region (Feigelson et al. 2007). The morphology of the diffuse X-ray emission is striking. It is strongest in the central region near IRS 2 where radio and IR-nebular emission appears cleared. Further it is confined on the southeast along a ridge that also confines the mm continuum (cool dust) emission. There is also a distinctive kink where the diffuse X-ray emission is deflected around the dust ridge near IRS 1. It also appears that the plasma is breaking out of some form of confinement to the northwest where it traces around the diffuse NIR emission – akin to the way a stream moves around a stone. This break out to the northwest is visible as reflection nebulosity in Figure 1 and corresponding bubble-like structures in Figure 2.
9. The Distance to RCW 38
The first reasonable estimate for the distance was from Radhakrishnan et al. (1972). They estimate a kinematic distance of 1.5 kpc. Muzzio (1979) identified about 10 OB star candidates in the vicinity of RCW 38 and derived a distance of about 1.7 kpc by placing the stars on the main sequence of an HR diagram. Murphy (1985) examined the CO structures in the Vela ridge in addition to the photometric data and derived a distance of 1.6 kpc. Avedisova & Palous (1989) performed photometric measurements of 218 star forming regions and also achieve a result of 1.7 kpc. The X-ray luminosity function is consistent with the 1.7 kpc distance (Wolk et al. 2006). At this distance, 1 arcmin corresponds to 0.495 pc.
10. Radio Observations
Early low resolution radio observations of continuum emission and recombination lines indicate typical HII region conditions, i.e., an electron temperature of 8000 K and an emission measure of pc cm-6 (e.g., McGee & Newton 1981, Caswell & Haynes 1987). A relatively high electron density of cm-3 supports the view that the HII region is confined by the surrounding molecular cloud. Resolved radio studies reveal a clumpy ring-like structure around IRS 2 showing the general morphology seen in the infrared (Huchtmeier 1974; Vigil 2004). As in the mid-infrared, the brightest radio peak coincides with IRS 1 (Figure 5). High resolution observations indicate the ring is mostly optically thick at centimeter wavelengths, with no evidence for synchrotron emission (Vigil 2004). Line widths observed in recombination lines are typically 30 km s-1 or greater. Sensitive high resolution 18 cm (1.6 GHz) observations show weak emission extending to the NW-SE outside of the ring, suggesting that, like the X-ray emission, some diffuse radio emission has escaped the compact HII region. Figure 2 shows a bubble-like feature associated with this emission in the NW. The radio ring is not well centered on IRS 2, likely indicating that the surrounding gas is not homogeneous.
11. Molecular Gas and Dust Continuum
Detailed molecular line observations of RCW 38 are rare. Gillespie et al. (1979) mapped a large region (10 5 pc) in CO 1-0 with a 3.2′ beam. They found two clouds separated by a bridge of emission. Yamaguchi et al. (1999) also mapped CO 1-0 with similar resolution over a larger region, confirming the earlier result, and estimated a mass of M⊙ for the two clouds as a whole. The RCW 38 cluster is directly associated with the eastern cloud. Zinchenko et al. (1995) mapped the eastern cloud over a 5 arcmin2 region in CS 2-1 with 1′ resolution. Their maps show that CS, like the radio, follows a ring-like structure, but close comparison indicates that the CS is located exterior to the radio, tracing the dense molecular gas in which the compact HII region is embedded. The mass traced by CS is M⊙ (correcting for their incorrectly assumed distance of only 0.7 kpc) with a mean density of cm-3. A number of other high density tracers have been observed with 1′ or better resolution but maps are lacking.
Deep absorption is observed in the main lines of the lowest rotational levels of OH at 18 cm, and these have been used to measure the magnetic field strength of 383 G (Bourke et al. 2001). High resolution () observations of OH show that the absorption is seen against the radio ring, and is directly associated with the gas surrounding the HII region, sharing the same velocity as the recombination lines (T.Bourke, private communication). No maser emission is observed in OH. Water maser emission at 22 GHz is observed from a position near to IRS 1, and it is time variable (Kaufmann et al. 1977; Batchelor et al. 1980; Caswell et al. 1989). Water maser emission is a sure sign of active star formation, and high resolution observations are needed to precisely located this emission.
The dust continuum has been mapped at wavelengths near to 1 mm (Cheung et al. 1980; Vigil 2004). Low resolution observations revealed only one clump centered near IRS 1 (Cheung et al. 1980), with a peak density of cm-3, a total mass of M⊙, and a visual extinction of 800 mag. Higher resolution observations reveal the ring-structure seen at other wavelengths (Vigil 2004), with a central hole around IRS 2, but mostly peaking exterior to the radio ring. In particular, the position of peak intensity is west of the IRS 1 ridge and associated with the extincted region seen in Figure 3. The mass calculated by Vigil (2004) is an order of magnitude less than that of Cheung et al. (1980), from similar fluxes. As the morphology of the dust emission observed by Vigil suggests that it is associated with the radio ring, the extinction determined by Cheung et al. (1980) may be an overestimate.
12. Interpretation
The ring-like shape of the two dimensional radio and infrared continuum image suggests the possibility of a shell–like structure surrounding IRS2. The bulk of the emission seen in the cm images is concentrated in a ring which would be the thick walls of a three dimensional shell. The center cavity would contain only the emission from the cover of the shell perpendicular to the direction of observation (Figure 5).
We see two possible interpretations of the relationship among the observational data – one is wind driven (Smith et al. 1999), the other supernova driven (Wolk et al. 2002). The supernova scenario has, as its key piece of evidence, a symmetrical ring of emission in the radio continuum. A second line of evidence for a supernova in this region is the hot X-ray plasma with a power–law spectrum, which appears to be getting harder as it moves away from the cluster center. This is as one would expect with synchrotron emission being accelerated from a compact object near the cluster center. The total X-ray luminosity is about ergs sec-1. In these attributes it evokes the image of a shell supernova remnant such as SN 1006. Further, if one assumes equipartition, we derive a very reasonable magnetic field of about 4.9 G and a reservoir of ergs of accelerated electrons, giving a lifetime of about 20,000 years. But, the radio continuum of RCW 38 reported here does not show the brightening at the edges seen in SN 1006 (Reynolds & Gilmore 1986). The positive spectral index of the radio continuum also favors thermal emission. Further the X-ray emission seen in shell supernovae tends to follow the form of the radio emission (c.f. Allen et al. 2001). Here, the plasma seems confined by the continuum radio emission with the exception of the breakout to the northwest.
This confinement naturally lends itself to a wind driven scenario. Smith et al. (1999) note that the central region around IRS 2 is dominated by Ly emission and is dust free. This suggests that RCW 38 is a compact HII region expanding into and confined by a non–homogeneous molecular cloud. The wind from the massive O-star (IRS 2) can give rise to collisional shocks near to the star as described by Cantó et al. (2000). Such shocks centered near IRS 2 would fill the cavity with a limb darkened X-ray emission as seen. But the derived thermal spectrum for the plasma is much warmer than expected by these models (10 keV ( 100 MK) vs. 1 keV ( 10 MK)). This high temperature may have to do with confinement due to the surrounding molecular cloud. Heated plasma will tend to move outward and cool, but in the case of RCW 38 the molecular cocoon prevents meaningful cooling and causes a “greenhouse effect” on a parsec scale. Smith et al. (1999) derived a similar result using Ly data. Analysis of the smoothed X-ray data supports the hypothesis that the molecular material is trapping the plasma that appears to be partially heated by the trapped Ly photons. There appears to be a break out of the plasma from the ring of the molecular gas in the northwest corner while elsewhere the gas is confined much closer to the O star.
Further evidence for this interpretation is found in other regions of massive star formation. Several massive star forming regions have been seen to have much cooler diffuse X-ray emission. Townsley et al. (2003) report thermal spectra of below 1 keV for the Rosette Nebula and M17. Other massive star forming regions, including the Arches cluster (Yusef-Zadeh et al. 2002) and NGC 3603 (Moffat et al. 2002) have thermal spectra above 3 keV. While a commonality among these clusters is a massive O star (O6 or earlier) the key difference between the former group and the latter group seems to be the presence of absorbing (confining) material. All the clusters with high temperature plasma have cm-2 while the clusters with cooler plasma have less absorption.
The wind driven interpretation involves winds blowing from IRS 2 that are excavating the material in its near vicinity creating this expanding shell, seen as a radio continuum ring of emission. IRS 2 is near the center of the cavity and is likely the driving source. However, IRS 2 is displaced from the geometric center of the ring that is offset by about 18′′ to the northeast. As noted earlier, this appears due to our viewing angle at the system not being face on and the non-homogeneous surroundings. From inspection of the K–band image (Figure 5), an arc-like feature, reminiscent of a bow shock, coincident with the bright radio ridge, can be seen in the southwest of the ring. It suggests either a massive star forming region ′′ to the west, which is creating a bow shock by deflecting the winds from IRS 2 around its edge, a wind source from the southwest which could be counteracting the wind from IRS 2 causing a compression ridge to build up along the edge of the ridge – IRS 1, or a dense globule being ablated (Bertoldi & McKee 1997). Indeed, there are about a half dozen X-ray sources within this arc, and they all are found to have column densities in the range of 1.9 - 2.9 cm-2, equivalent to about 10-15 AV. The southwest source, be it a massive star driving a wind or simply a dense core, is preventing the expansion in the southwest direction, causing the shell to expand non-uniformly and mostly toward the northeast, thus explaining the offset of the center to the northeast.
From close inspection of the VLT K-band images, an arc-like feature outlines the bright radio ridge (Figure 5). This specific feature implies dense gas that is likely photo-evaporating and could suggest that this is a site of triggered star formation. Additional evidence of active star formation occurring just west of IRS 1 is a possible protostar found embedded in the hydrogen gas and molecular jets eminating from this region (DeRose et al. 2008), as well as the previously mentioned water masers.
The winds from IRS 2 appear to be confined by the surrounding molecular cloud. Assuming a typical O-star wind of 1000 km/s (Cantó et al. 2000) and an age for IRS 2 of about 500,000 years suggests that a freely expanding wind would have traveled about 500 pc since the star was formed. The inner width of the shell is close to a tenth of a parsec, much smaller than expected from a freely expanding wind. Also, in the smooth X-ray data, plasma is observed as far as 3.5 pc from IRS 2, far short of the 500 pc predicted for a freely expanding wind.
13. Summary
RCW 38 appears to be a blister compact HII region with winds originating from the central O-star IRS 2. These winds are excavating the mass in the immediate vicinity of IRS 2 creating a shell–like structure, detected as a radio continuum ring and also evident at infrared and millimeter wavelengths. A few hundred young low mass stars are found in the immediate vicinty of IRS 2, and may be directly exposed to its winds and ionizing radiation. The region as a whole is estimated to contain around 2000 young stars, with 30 OB star candidates. The region of the ring to the west of IRS 2, containing IRS 1, appears to be particularly active and is likely the site of ongoing (triggered) star formation. The IRS 1 ridge appears to be the interface between the IRS 2 wind and either a similar wind from a high mass star further to the west, or a dense clump of gas that is being ablated by IRS 2. Further observations are needed to test these scenarios. In many ways, RCW 38 appears to be a younger more embedded version of the ONC and deserves further study at higher angular resolution and across the spectrum.
Acknowledgments.
We acknowledge many useful comments from the referee Leisa Townsley. João Alves openly shared his unpublished data and ideas as part of our ongoing collaboration on this region. We thank Tom Megeath for fruitful discussions. We gratefully acknowledge the financial support from NASA contract NAS8-39073 (CXC). This work is based in part on observations made with the Spitzer Space Telescope, operated by the Jet Propulsion Laboratory, California Institute of Technology under a contract with NASA. Support for this work was provided by NASA.
References
- Allen et al. (2001) Allen, G. E., Petre, R., & Gotthelf, E. V. 2001, ApJ, 558, 739
- Aschenbach et al. (1999) Aschenbach, B., Iyudin, A. F., & Schönfelder, V. 1999, A&A, 350, 997
- Avedisova & Palous (1989) Avedisova, V. S., & Palous, J. 1989, Bull. Astron. Inst. Czechoslovakia, 40, 42
- Batchelor et al. (1980) Batchelor, R. A., Caswell, J. L., Haynes, R. F., Wellington, K. J., Goss, W. M., & Knowles, S. H. 1980, Australian Journal of Physics, 33, 139
- Bertoldi & McKee (1997) Bertoldi, F., & McKee, C. F. 1997, Rev. Mex. Astron. Astrofis. Conf. Series, 6, 195
- Bourke et al. (2001) Bourke, T. L., Myers, P. C., Robinson, G., & Hyland, A. R. 2001, ApJ, 554, 916
- Cantó et al. (2000) Cantó, J., Raga, A. C., & Rodríguez, L. F. 2000, ApJ, 536, 896
- Caswell & Haynes (1987) Caswell, J. L., & Haynes, R. F. 1987, Australian Journal of Physics, 40, 215
- Caswell et al. (1989) Caswell, J. L., Batchelor, R. A., Forster, J. R., & Wellington, K. J. 1989, Australian Journal of Physics, 42, 331
- Cheung et al. (1980) Cheung, L. H., Frogel, J. A., Hauser, M. G., & Gezari, D. Y. 1980, ApJ, 240, 74
- Churchwell et al. (2004) Churchwell, E., et al. 2004, ApJS, 154, 322
- DeRose etal. (2008) DeRose, K.L, Bourke, T. L., Gutermuth, R.A., Wolk, S. J., Megeath, S.T., Alves, J., Nürnberger, D. 2008 AJ, submitted
- Epchtein & Turon (1979) Epchtein, N., & Turon, P. 1979, A&A, 72, L4
- Feigelson et al. (2007) Feigelson, E., Townsley, L., Güdel, M., & Stassun, K. 2007, Protostars and Planets V, eds. B. Reipurth, D. Jewitt, & K. Keil, 313
- Frogel & Persson (1974) Frogel, J. A. & Persson, S. E. 1974, ApJ, 192, 351
- Furniss et al. (1975) Furniss, I., Jennings, R. E., & Moorwood, A. F. M. 1975, ApJ, 202, 400
- Gagné et al. (2005) Gagné, M., Oksala, M.E., Cohen, D.H., Tonnesen, S.K., ud-Doula, A. et al. 2005, ApJ, 628, 986
- Gillespie et al. (1979) Gillespie, A. R., White, G. J., & Watt, G. D. 1979, MNRAS, 186, 383
- Gum (1955) Gum, C. S. 1955, MmRAS, 67, 155
- Huchtmeier (1974) Huchtmeier, W. 1974, A&A, 32, 335
- Johnson (1973) Johnson, H. M. 1973, PASP, 85, 586
- Kaufmann et al. (1977) Kaufmann, P., Scalise, E., Jr., Schaal, R. E., Gammon, R. H., & Zisk, S. 1977, AJ, 82, 577
- Lada & Lada (2003) Lada, C. J. & Lada, E. A. 2003, ARA&A, 41, 57
- Ligori et al. (1994) Ligori S., Moneti A., Robberto M., Guarnieri M. D., Zinnecker H., 1994, Mem. Soc. Astron. Ital., 303, 815
- McGee & Newton (1981) McGee, R. X., & Newton, L. M. 1981, MNRAS, 196, 889
- Moffat et al. (2002) Moffat, A.F.J., Corcoran, M.F., Stevens, I.R., Skalkowski, G., Marchenko, S.V. et al. 2002, ApJ, 573, 191.
- Mizutani et al. (1987) Mizutani, K., Suto, H., Takami, H., Maihara, T., Sood, R. K., Thomas, J. A., Shibai, H., & Okuda, H. 1987, MNRAS, 228, 721
- Murphy (1985) Murphy, D. C. 1985, Ph.D. Thesis, Massachusetts Institute of Technology
- Muzzio (1979) Muzzio, J. C. 1979, AJ, 84, 639
- Muzzio & Celotti de Frecha (1979) Muzzio, J. C. & Celotti de Frecha, M. B. 1979, MNRAS, 189, 159
- Persson et al. (1976) Persson, S. E., Frogel, J. A., & Aaronson, M. 1976, ApJ, 208, 753
- Radhakrishnan et al. (1972) Radhakrishnan, V., Goss, W. M., Murray, J. D., & Brooks, J. W. 1972, ApJS, 24, 49
- Reynolds & Gilmore (1986) Reynolds, S. P., & Gilmore, D. M. 1986, AJ, 92, 1138
- Rho et al. (2004) Rho, J., Ramírez, S. V., Corcoran, M. F., Hamaguchi, K., & Lefloch, B. 2004, ApJ, 607, 904
- Rodgers et al. (1960) Rodgers, A. W., Campbell, C. T., & Whiteoak, J. B. 1960, MNRAS, 121, 103
- Shaver & Goss (1969) Shaver, P. A. & Goss, W. M. 1969, Proceedings Astron. Soc. Australia, 1, 280
- Shaver & Goss (1970) Shaver, P. A. & Goss, W. M. 1970, Australian Journal of Physics, Astrophys. Suppl., 14, 77
- Smith et al. (1999) Smith, C. H., Bourke, T.L., Wright, C.M., Spoon, H.W.W.S., Aitken, D.K., et al. 1999, MNRAS, 303, 367
- Storey & Bailey (1982) Storey, J. W. V. & Bailey, J. 1982, Proceedings Astron. Soc. Australia, 4, 429
- Townsley et al. (2003) Townsley, L. K., Feigelson, E. D., Montmerle, T., Broos, P. S., Chu, Y.-H., & Garmire, G. P. 2003, ApJ, 593, 874
- Vigil (2004) Vigil M., 2004, M.Sc. Thesis, Massachusetts Institute of Technology
- Whitney et al. (2004) Whitney, B. A., et al. 2004, ApJS, 154, 315
- Wilson et al. (1970) Wilson, T. L., Mezger, P. G., Gardner, F. F., & Milne, D. K. 1970, A&A, 6, 364
- Wolk et al. (2002) Wolk, S. J., Bourke, T. L., Smith, R. K., Spitzbart, B., & Alves, J. 2002, ApJ, 580, L161
- Wolk et al. (2006) Wolk, S. J., Spitzbart, B. D., Bourke, T. L., & Alves, J. 2006, AJ, 132, 1100
- Yamaguchi et al. (1999) Yamaguchi, R., Saito, H., Mizuno, N., Mine, Y., Mizuno, A., Ogawa, H., & Fukui, Y. 1999, PASJ, 51, 791
- Yusef-Zadeh et al. (2002) Yusef-Zadeh, F., Law, C., Wardle, M., Wang, Q. D., Fruscione, A., Lang, C. C., & Cotera, A. 2002, ApJ, 570, 665
- Zinchenko et al. (1995) Zinchenko, I., Mattila, K., & Toriseva, M. 1995, A&AS, 111, 95