The X-ray luminosity of solar-mass stars in the intermediate age open cluster NGC 752
Abstract
Aims. While observational evidence shows that most of the decline in a star’s X-ray activity occurs between the age of the Hyades ( yrs) and that of the Sun, very little is known about the evolution of stellar activity between these ages. To gain information on the typical level of coronal activity at a star’s intermediate age, we studied the X-ray emission from stars in the 1.9 Gyr old open cluster NGC 752.
Methods. We analysed a 140 ks Chandra observation of NGC 752 and a 50 ks XMM-Newton observation of the same cluster. We detected 262 X-ray sources in the Chandra data and 145 sources in the XMM-Newton observation. Around 90% of the catalogued cluster members within Chandra’s field-of-view are detected in the X-ray. The X-ray luminosity of all observed cluster members (28 stars) and of 11 cluster member candidates was derived.
Results. Our data indicate that, at an age of 1.9 Gyr, the typical X-ray luminosity of the cluster members with is erg s-1, so approximately a factor of 6 less intense than that observed in the younger Hyades. Given that is proportional to the square of a star’s rotational rate, the median of NGC 752 is consistent, for Gyr, to a decaying rate in rotational velocities with , steeper than the Skumanich relation () and significantly steeper than observed between the Pleiades and the Hyades (where ), suggesting that a change in the rotational regimes of the stellar interiors is taking place at Gyr.
Key Words.:
(Galaxy:) open clusters and associations: individual: NGC 752 – Stars: coronae – Stars: activity – Stars: rotation – X-rays: stars1 Introduction
Investigations of solar-type stars in the better-studied nearby open clusters have provided a basis for understanding the evolution of stellar activity and rotation velocity. The early Einstein and Rosat studies of open clusters revealed that the mean X-ray luminosity of G, K and early M stars decreases steadily with age from pre-main sequence stars (PMS) through the Pleiades ( yrs), the Hyades ( yrs) and the old disc population (Randich, 2000; Micela, 2002b).
In main-sequence stars, late-type stellar magnetic activity is regulated principally by rotation (Pallavicini et al., 1981; Baliunas et al., 1995) and its decay with stellar age is attributed to rotational spin-down. Magnetic braking models indicate that surface rotational velocities should decline as with , depending on whether the magnetic field geometry is radial or closer to a dipole configuration (Kawaler, 1988). Models considering possible differences in the pre-main sequence disc-locking time, solid-body versus differential rotation in the interior, and the onset of magnetic saturation give decay laws over the range for 15 Gyr old solar-mass stars (Krishnamurthi et al., 1997).
Although Skumanich (1972) found the decay in rotational velocities and the strength of the magnetic activity indicators Ca ii to be consistent with pure magnetic breaking () from the age of the Pleiades to that of the Sun, more recent evidence points to a decay rate of the stellar activity which is less steep between the Pleiades and the Hyades and drops significantly faster from the Hyades ages to that of the Sun or field stars (e.g. Simon et al., 1985 for the evolution of transition-region lines; Micela, 2002a and Preibisch & Feigelson, 2005 for the evolution of coronal emission). This may indicate a change, between 1 and 5 Gyr, in the rotational regime of stellar interiors.
Helioseismology has shown that in the Sun there is no difference between the angular rotation of the radiative core and that of the convective envelope, while models suggest that a significant radial gradient is present at earlier stages (MacGregor & Brenner, 1991, Barnes et al., 1999, Sills & Pinsonneault, 2000). Queloz et al. (1998) reported the surface rotational evolution between the Pleiades and the Hyades to be less steep than the Skumanich (1972) relation, and interpreted this as evidence of angular momentum transport from the core to the envelope. Determination of the evolution of coronal emission beyond the Hyades age can therefore be an effective probe of the evolution of stellar interiors in older stars.
Although most of the decline in X-ray activity occurs between the age of the Hyades and that of the Sun, the evolution of stellar activity in solar-type stars older than the Hyades is still poorly known. For stars older than the Hyades, the data on coronal emission level are based on field stars and the Sun. While the Sun’s age is well constrained at 4.5 Gyr, it is only one star and therefore cannot be assumed to be representative of the behavior of solar-type stars at its current age. The age of field stars are poorly constrained and they represent in general a mixture of stellar populations and chemical composition.
The best approach to explore the stellar activity of solar-type stars at an age intermediate between those of the Hyades and the Sun is the X-ray observation of an old open cluster, which naturally provides a sample of similar aged stars, at the same distance and with similar chemical abundances. This obvious approach is difficult for observational reasons: there are few old clusters in the solar neighbourhood, since many of them are dissipated in few billion years through dynamical evolution, and their intrinsically low X-ray luminosity requires extremely long exposures with current X-ray instrumentation. The only known, sufficiently nearby, intermediate age, open cluster is NGC 752. At a distance of 400 pc and with age between 1.7 and 2 Gyr, this is the only open cluster in which one can measure the X-ray luminosity of individual dG stars with exposure times below 200 ks – unfortunately, though, the cluster is rather dispersed.
We present here the results of the analysis of two X-ray observations of NGC 752: a 140 ks Chandra observation and a 50 ks XMM-Newton observation. The analysis focuses on solar-type stars, with mass . The paper is organised as follows. After a summary, below, of the properties of NGC 752, the observations and data analysis are described in Sect. 2. Results are presented in Sect. 3 and the implications are discussed in Sect. 4.
1.1 NGC 752
The most comprehensive study of the open cluster NGC 752 to date is the one by Daniel et al. (1994) (hereafter DLM94). These authors collected and systematised a number of existing proper-motion and radial-velocity studies of this cluster, supplemented them with their own measures of radial velocities, and combined them with existing photometric and spectroscopic data. Thanks to this effort, they claim to have obtained an effectively complete census of all probable and possible cluster members down to the observable limit of the unevolved main sequence which, in their case, corresponds to . The electronic version of their catalogue available from Vizier lists 255 stars of which 157 are classified as probable or possible members of NGC 752.
Combining the spectroscopic and photometric approaches, DLM94 establish the cluster metallicity to be [Fe/H] dex. They also derive a reddening value of , which corresponds to an absorbing column density of cm-2 or (Cox, 2000). From intermediate-band photometry and main-sequence fitting, DLM94 derive a distance modulus of mag which corresponds to a distance of pc (assuming ). Comparing the data with theoretical models, they estimate for this cluster an age of Gyr from classical isochrones and from isochrones with over-shooting, in good agreement with the results from isochrone fitting of Meynet et al. (1993) (1.8 Gyr) and of Dinescu et al. (1995) (2.0 Gyr).
Since the first proper-motion study by Ebbighausen (1939), it has been known that in NGC 752 the unevolved main sequence is deficient in stars relative to the turn-off. This is likely due to mass-segregation effects and the cluster relaxation, which leads to the evaporation of the less massive members.
NGC 752 was observed in the X-ray with Rosat by Belloni & Verbunt (1996). They catalogued 49 sources, seven of which were identified with cluster members.
2 Observations and data analysis
2.1 Chandra observation
The 135 ks observation of NGC 752 was performed by the Chandra ACIS camera on September 29 2003 starting at 21:11:59 UT. The Principal Investigator for the observation is T. Simon, who presented preliminary results in Christensen & Simon (2004). We retrieved the data from the public archive, with no re-processing done on the archival data.
We performed the source detection on the event list, using the Wavelet Transform detection algorithm developed at Palermo Astronomical Observatory (Pwdetect, available at http://oapa.astropa.unipa.it/progetti_ricerca/PWDetect); initially the energy range keV was selected and the threshold for source detection was taken as to ensure a maximum of 1–2 spurious sources per field. 169 sources were detected in this way. The analysis of these sources hardness ratio showed, however, that all the catalogued stars in the field had low hardness ratios, HR (where HR is the number of photons in the band keV over number in the band keV). Thus, to maximise the detection of stellar sources, Pwdetect was applied to the event list in the energy range keV. Using a detection threshold which ensures less than 1 spurious source per field leads to the detection of 188 sources, while lowering this threshold to 10 spurious sources per field, allows 262 sources to be identified in this energy range. This is a significant increase (well above the number expected if all the additional sources were spurious), thus we retain this list of 262 sources as our final list of sources in the NGC 752 field, with the caveat that 10 sources among them are likely spurious. Note that the existence of spurious sources in the list is not so much of a problem in this context, because cluster members or candidate members are identified by the existence of a visible or near-IR counterpart.
Table 6111on line. lists the coordinates for all 262 detected sources. We searched for 2MASS counterparts to the X-ray sources using the 2MASS Point Source Catalogue (PSC) and a search radius of 3 arcsec and found a counterpart for 43 sources. Searching within the Point Source Reject Table of the 2MASS Extended Mission leads to the further identification of 1 counterpart (source id 87). For the sources with a 2MASS counterpart, the magnitude in the , and bands is also given in Table 6.
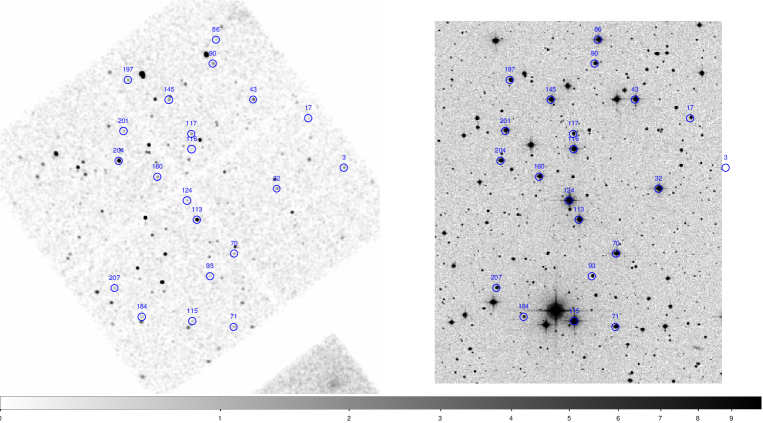
We also searched for visible counterparts within the catalogue of NGC 752 by DLM94 and found 26 counterparts (listed in Table 1); of these, 20 are likely members of the open cluster and 1 is a possible member; the other five are likely non-members (DLM94). All of the 26 sources with counterparts from DLM94 also have a 2MASS counterpart. Indeed, most of the sources with 2MASS counterparts are stars, while most of the sources without a counterpart are probably extra-galactic sources. Fig. 1 shows the Chandra image of NGC 752 towards the cluster centre (01:57:41 +37:47:06). The catalogued members of NGC 752 are spread over an area of approximately arcmin while the Chandra image covers a central area of arcmin.
Finally, we searched for visible counterparts to the X-ray sources in the Nomad catalogue (Zacharias et al., 2004) and found 65 matches (within a search radius of 3 arcsec). Of these 65 sources, 42 sources have also 2MASS counterparts. All the Nomad-matched sources without a 2MASS counterpart lack measurements and have , apart from one which has . The use of the Nomad catalogue, thus, does not allow any additional X-ray source with to be identified with respect to 2MASS; corresponds to a star in NGC 752 of less than (according to the isochrones of Girardi et al., 2002). We expect most of the objects with to be extragalactic and, in addition, if a few of them were members of NGC 752, their mass would be well below the target of this study, which are solar-mass stars with . Accordingly, we did not further consider the Nomad catalogue to identify potential members of NGC 752 among the Chandra sources.
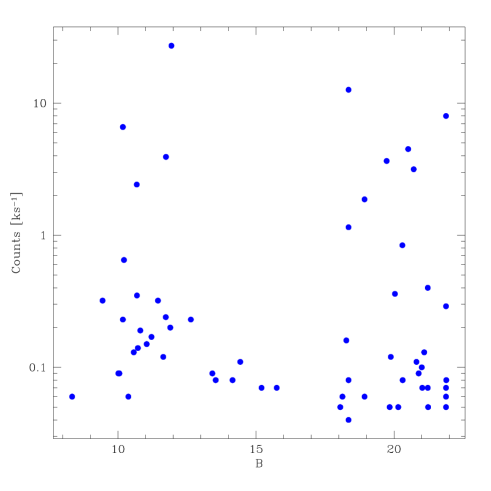
It is interesting, however, to look at the scatter plot of the X-ray counts versus magnitudes for the X-ray sources with a Nomad counterpart shown in Fig. 2. A lack of sources with is clearly noticeable and does not appear to be due to the sensitivity of the Chandra data, (as weaker sources are detected for other values of ). This indicates that the lack of X-ray sources with a counterpart with is intrinsic to the field, consistent with the observation that NGC 752 appears to be deficient in low mass stars.
We estimated the number of expected background sources in the observation using the relationship for X-ray sources in Brandt et al. (2001). As in Table 6, the faintest source has a typical count rate of 0.035 ks-1; assuming for extragalactic sources a power-law spectrum with spectral index and a total interstellar absorption column of cm-2 (Dickey & Lockman, 1990; Kalberla et al., 2005), this count rate corresponds222Using the pimms software at Heasarc to a flux of 2.2 erg cm-2 s-1 in the energy band keV. In this energy band and at this flux level, the expected number density of background sources determined on the basis of the relationship given in Brandt et al. (2001) is 2100-2610 per square degree. The area imaged by Chandra is 0.08 square degree, so that the expected number of serendipitous extra-galactic sources is between 170 and 210, consistent with the hypothesis that most of non-identified sources are extragalactic.
For the brightest sources, for which a spectral and timing analysis was carried out, source and background regions were defined in ds9, and light curves and spectra were extracted from the photon list in the energy range 0.3-7.5 keV using CIAO V. 3.3 threads, which were also used for the generation of the relative response matrices. The spectral analysis was performed using the Xspec package V11.2, after rebinning the spectra to a minimum of 5 source counts per (variable width) spectral bin.
| Id | Count rate | DLM94 Id | MC(a) | |
|---|---|---|---|---|
| ks-1 | arcsec | |||
| 3 | 0.32 0.09 | 654 | 0.49 | |
| 17 | 0.08 0.03 | 701 | 1.61 | |
| 32 | 0.23 0.04 | 745 | 0.32 | |
| 38 | 0.09 0.04 | 758 | 0.75 | |
| 43 | 0.35 0.06 | 772 | 0.50 | |
| 70 | 0.19 0.07 | 798 | 0.25 | |
| 71 | 0.12 0.05 | 799 | 0.67 | |
| 86 | 0.13 0.05 | 823 | 0.46 | |
| 90 | 0.2 0.06 | 824 | 0.25 | |
| 93 | 0.08 0.03 | 828 | 0.70 | |
| 113 | 6.6 0.24 | 849 | 0.03 | |
| 115 | 0.09 0.04 | 858 | 1.84 | |
| 116 | 0.06 0.03 | 857 | 0.26 | |
| 117 | 0.23 0.07 | 859 | 0.09 | |
| 124 | 0.09 0.03 | 867 | 0.46 | |
| 140 | 0.06 0.03 | 882 | 0.41 | |
| 145 | 0.14 0.05 | 888 | 0.03 | |
| 160 | 0.17 0.05 | 901 | 0.21 | |
| 176 | 2.42 0.14 | 911 | 0.23 | |
| 184 | 0.11 0.05 | 917 | 0.46 | |
| 197 | 0.24 0.07 | 935 | 0.89 | |
| 201 | 0.15 0.05 | 941 | 1.30 | |
| 204 | 3.92 0.21 | 950 | 0.12 | |
| 207 | 0.07 0.03 | 953 | 0.29 | |
| 211 | 0.65 0.08 | 958 | 0.08 | |
| 258 | 0.32 0.06 | 1033 | 0.29 |
(a) star’s membership class according to DLM94: probable member, possible member, and probable non-member.
(b) radial distance from counterpart
2.2 XMM-Newton observation
NGC 752 was observed for 49 ks by the XMM-Newton EPIC camera on February 5 2003 starting at 23:29:25 UT nominal pointing 01:57:38 +37:47:60, thus the XMM-Newton field-of-view (FOV) includes the Chandra FOV. The Principal Investigator for the observation is G. Tagliaferri. We retrieved the ODF data from the XMM-Newton data archive and processed them with SAS 7.1 to obtain tables of photons recorded with EPIC instruments (MOS1, 2 and PN) calibrated in energy and detection times. To improve the detection process for faint sources, we checked the global background light curve and we filtered out the first part of the observation where the background showed rapid variability. The filtered exposure times are 40 ks for MOS1 and MOS2, and 39 ks for PN.
For the source detection, we used the Pwxdetect code developed at Palermo Observatory and derived from the analogous Chandra Pwdetect code based on wavelet transform analysis. This allows the three EPIC exposures to be combined in order to gain deeper sensitivity with respect to the source detection based on single images. We detected 145 point sources in the energy band 0.5-2.0 keV. An extended source, very likely a galaxy cluster, is also visible in the EPIC data. This cluster ( 01:57:19 and +37:56:43) is not visible in the previous Rosat observations in this direction and it is at the edge of the Chandra FOV. The source shows a slightly elongated circular shape (with radius ) and a radially-decreasing profile of surface brightness.
The spectrum of this extended source is well described ( with 33 d.o.f.) by an isothermal optically-thin thermal plasma at K. The mean metallicity is . The red-shift is consistent with 0, but its upper limit is . The unabsorbed X-ray flux per unit area in the keV energy band is erg cm-2 arcmin-2. These results suggest that the extended source is a previously undetected cluster of galaxies. We note that the mean metallicity of this new cluster is relatively low with respect to the clusters with similar redshift presented in Snowden et al. (2008).
The final list of 145 point sources detected in the XMM-Newton observation is presented in Table 7333on line.. We cross-matched the source list from XMM-Newton with the one obtained from the Chandra data, using a matching radius of 5 arcsec, and found 66 matches. For these sources, the Id of their Chandra counterpart is given in Table 7. In the XMM-Newton source list there are 23 sources444The XMM-Newton sources with a counterpart in DLM94 within 5 arcsec are really 24, however, one of these, source 69, has also a Chandra counterpart, which is not matched to the DLM94 counterpart (this being more than 7 arcsec away). Since the Chandra PSF is sharper, we consider the Chandra X-ray source position more accurate and thus unlikely associated with the star in DLM94, from now on, hence, source 69 will not be considered among the probable members of NGC 752. with a counterpart from the catalogue of NGC 752 by DLM94 (matching radius 5 arcsec): 18 are likely cluster members, one is a possible member, and four are unlikely cluster members (Table 2). Of the 19 likely or possible members, 12 were also detected in the Chandra observations and the other seven are outside the Chandra FOV.
| IdXMM | Count rate | DLM94 Id | MC | IdChandra | |
| ks-1 | arcsec | ||||
| 15 | 0.810.13 | 654 | 0.45 | 3 | |
| 18 | 0.250.08 | 659 | 2.36 | - | |
| 19 | 0.660.14 | 682 | 2.32 | - | |
| 28 | 1.410.24 | 728 | 2.24 | - | |
| 34 | 0.400.08 | 745 | 1.95 | 32 | |
| 40 | 0.470.09 | 772 | 0.86 | 43 | |
| 42 | 4.850.33 | 783 | 1.26 | - | |
| 47 | 0.270.06 | 798 | 2.77 | 70 | |
| 57 | 0.600.11 | 824 | 3.45 | 90 | |
| 59 | 0.720.11 | 828 | 1.22 | 93 | |
| 64 | 8.820.30 | 849 | 0.81 | 113 | |
| 71 | 0.390.09 | 882 | 4.44 | 140 | |
| 75 | 1.480.23 | 890 | 1.41 | - | |
| 80 | 0.540.10 | 901 | 1.70 | 160 | |
| 86 | 4.080.22 | 911 | 0.34 | 176 | |
| 94 | 0.310.08 | 935 | 0.50 | 197 | |
| 96 | 0.480.10 | 941 | 1.76 | 201 | |
| 98 | 7.500.30 | 950 | 0.51 | 204 | |
| 99 | 0.130.05 | 953 | 0.69 | 207 | |
| 101 | 1.920.20 | 958 | 2.48 | 211 | |
| 111† | 0.800.14 | 988 | 4.40 | - | |
| 124 | 0.350.10 | 1023 | 0.25 | - | |
| 128 | 0.870.16 | 1033 | 2.11 | 258 |
†X-ray source could be spurious
We searched for 2MASS counterparts to the XMM-Newton sources using a search radius of 5 arcsec and found a counterpart for 38 sources. As for the Chandra data, all sources with a visible counterpart from DLM94 have also a 2MASS counterpart, so this leaves 15 XMM-Newton sources with a 2MASS counterpart and no counterpart in DLM94; of these, 3 were also detected by Chandra; of the other 12, 10 are outside the Chandra FOV, while two are within it (XMM-Newton sources 58 and 65). Source 65 was caught by XMM-Newton during the decay phase of a flare, which explains why it is not detected in the Chandra data. For source 58 there is no immediate explanation for this, since the light curve does not show evidence of a flare. No additional near-IR counterpart to the XMM-Newton sources was found within the Point Source Reject Table of the 2MASS Extended Mission.
As for Chandra we also searched for visible counterparts to the XMM-Newton sources in the Nomad catalogue (Zacharias et al., 2004) and found 64 matches (within a search radius of 5 arcsec). Of these 64, 38 also have a 2MASS counterpart. Of the 26 sources with only Nomad counterpart, 24 lack magnitudes and have magnitudes , suggesting that the great majority of them are background AGN. For the two sources with magnitude values, we checked their position in a , diagram with respect to the isochrones by Girardi et al. (2002) (see Sect. 3 for more details about the isochrones) and found that their colour was incompatible with membership.
For the point sources for which spectral and timing analysis was carried out, the spatial regions for the sources and related local background were defined as circles and annuli, respectively, with the SAS task region (to get the maximum signal to noise ratio), and allowing shrinking of source regions in the case of nearby sources. The related response matrices and effective areas were then calculated. For light curves, we used an IDL procedure to bin photons in a grid of time intervals with exposure times corrected for the Good Time Interval selection. Light curves, images, and spectra, were created by selecting events with pattern for the PN camera, pattern for the MOS cameras, and flag for both. The data were screened by applying a count-rate limit on the light curves (binned at 100 s) at high energies ( keV for MOS and keV for the PN camera), to eliminate the contamination by soft proton flares. The count-rate limit is 0.35 counts per second for the PN camera and 0.18 counts per second for the MOS cameras.
3 Results
3.1 Colour-magnitude diagrams
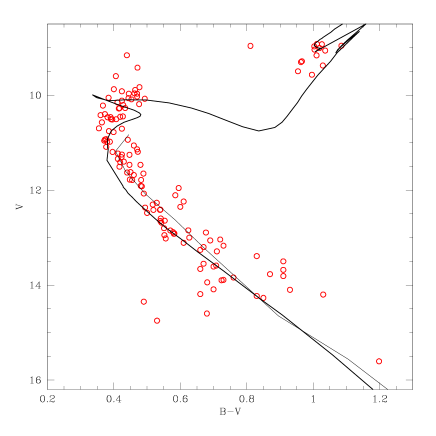
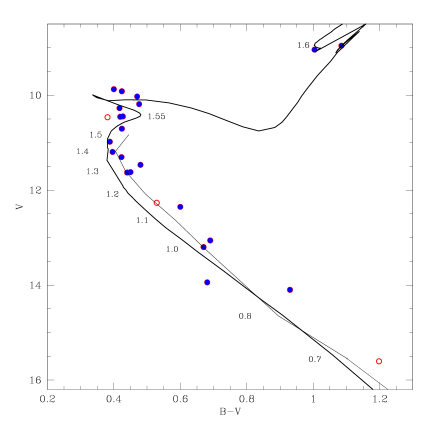
In the left panel of Fig. 3, the colour-magnitude diagram (CMD) for all probable and possible members of NGC 752 derived using the data from DLM94 is shown (157 stars). The right panel, shows the cluster probable and possible members within the Chandra FOV (24 stars), with the filled points indicating the stars with an X-ray counterpart. Since 21 Chandra sources have a counterpart which is a probable (20) or possible member (1), this implies that 88% of (likely) cluster members within the FOV are detected in the Chandra observation. In the XMM-Newton FOV there are 47 objects classified as probable members of NGC 752 by DLM94 and, of these, 19 are detected by XMM-Newton which makes for a 40% detection rate.
In the figures the isochrones by Girardi et al. (2002) and Siess et al. (2000) are also shown. These were computed for an age of 1.9 Gyr and assuming a metallicity of . In the diagrams, they were shifted to the distance and reddening value of NGC 752 (as given in Sect. 1.1). As can be seen from Fig. 3, there are only three X-ray undetected known members of the cluster, and these three stars have very different masses ( 1.5, 1.1, and 0.7 ). In particular we detect 5 out of the 6 known cluster members with a mass between 0.8 and 1.2 , that is, within the mass range of our interest.
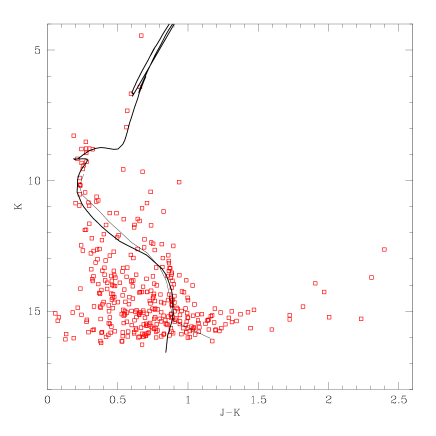
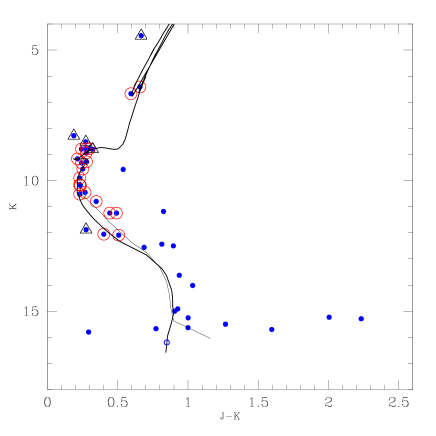
The left panel of Fig. 4 shows the near-IR CMD for all 2MASS sources in the Chandra FOV, while the right-panel shows the IR CMD for all the Chandra sources with a 2MASS counterpart, together with the isochrones from Girardi et al. (2002) and Siess et al. (2000) (as for the CMDs in the visible). The isochrones were shifted to the distance and reddening value of NGC 752 using the dereddening transformations (Cox, 2000) and , with (Rieke & Lebofsky, 1985). The IR CMD for the 19 X-ray sources with a 2MASS counterpart detected only by XMM-Newton is shown in Fig. 5.
From Fig. 4, one can see that 12 members of the cluster, with masses approximately between 1.2 and 1.5 , lie very close to the isochrones at the turnoff. Sources 115 and 124 at the top of the CMD are members of the cluster at the stage of core helium burning and, with , they are the most massive stars in our sample. Beside the known cluster members, there are three other stars very close to the isochrone turn-off, however, DLM94 classify them as likely non-members because of their proper motion. For brighter than which corresponds to , all the X-ray sources with a 2MASS counterpart have also a counterpart in DLM94, apart from two sources to the right of the isochrone: 182 and 185, which are at an angular separation of arcsec from each other. Source 185, a bright X-ray source, can be identified using Simbad with the bright star 915 in the study of NGC 752 of Platais (1991), which, according to this study, has a % probability of being part of the cluster (this star is omitted from DLM94). The proper motion values given in the Nomad catalogue for this star confirm this: with mas/yr and mas/yr, source 185 is unlikely to be a member of NGC 752, whose typical proper motion is mas/yr and mas/yr. No counterpart is found for the fainter source 182 in the studies of NGC 752, however, its counterpart in the Nomad catalogue has mas/yr and mas/yr, implying that also this star is very unlikely to be a member of the cluster.
Away from the Galactic plane, the 2MASS Point Source Catalogue (PSC) is complete down to mag, in the absence of confusion, which corresponds to for this cluster. Nevertheless, for that is , cross-matching with the 2MASS catalogue allowed only one extra X-ray source to be identified with respect to the studies by DLM94 and Platais (1991) (source 182), and, in particular, no potential new cluster member was identified with respect to DLM94. The sensitivity of the Chandra data does not appear to be the limiting factor in identifying new potential members with within 2MASS, since the X-ray detection rate of cluster members is around 90% for this mass range. This indicates that the list by DLM94 is a complete census of cluster members within the Chandra FOV, for , and confirms the cluster to be deficient in solar-mass stars with respect to the number of more massive members.
In the CMD of Fig. 4 (right panel), one can also see 11 objects fainter than , not too far displaced from the isochrones and thus with colours compatible with being members of the cluster (Ids 21, 24, 35, 44, 87, 107, 136, 151, 223, 245, and 246). To establish whether these sources could be possible members of the cluster we checked their proper motion in the Nomad catalogue. Only sources 21, 44, 107, 136, 223, and 246 have proper motion values compatible (within 4) with membership of NGC 752. There is no counterpart in Nomad for source 87 (within 3 arcsec).
In the CMD of Fig. 5, there are 9 objects not too far displaced from the isochrones (XMM-Newton sources ids: 2, 5, 11, 35, 58, 65, 95, 121, and 127), but only 2, 35, 58 and 127 have proper motion compatible with cluster membership.
3.2 Spectral and timing analysis for a few selected sources
Of the Chandra sources with a 2MASS counterpart 12 have enough source counts across the entire Chandra bandwidth for their spectra to be analysed (count rate 0.3 ). The results of the spectral and timing analysis for these 12 Chandra sources are presented in Table 3, with the possible or likely members of the cluster in the first half of the Table. We inspected the light curve of all these sources and performed a Kolmogorov-Smirnov test, which measures the maximum deviation of the integral photon arrival times from a constant source model. The results, in terms of constancy probability, are also given in the Table.
All the spectral fits were performed using an absorbed one-temperature plasma model. Initially, we performed the fits with as a free parameter. All 12 fits, however, resulted in an essentially unconstrained value for the absorbing column densities, so the fits were repeated fixing to its optically determined value of . The inability to tightly constrain the value of with these ACIS-I data is not unexpected, since the instrument’s energy band extends only to 0.2 keV at the low energies, and the values of here are rather low.
As shown in Table 3, all the four established cluster members have temperature around 0.5 0.7 keV; indeed, all the sources except 180 and 223 have a similar (relatively) low plasma temperature, consistent with being stellar sources. Source 223 has keV, however, this source underwent a strong flare during the observation: its count rate increased impulsively by more than a factor of 30 and then decreased exponentially over 18 ks. A spectral fit to the source data during the quiescent time yields keV, similar to the value of the other sources. The spectrum of source 180 is too hard for a normal star, thus this source is very likely a background AGN. Indeed its spectrum can be equally well fitted with an absorbed power law with a spectral index (null-hypothesis probability ). Its 2MASS colours are consistent with this source being in the background.
Source 185 underwent a flare at about 30 ks from the start of the observations; during the flare, the source’s count rate increased by a factor . The spectrum of this source integrated over the entire exposure is not well modeled by an absorbed one-temperature plasma model. We subdivided the spectral data for this source in two time intervals, one during the flare and one during the star’s quiescent activity. During the quiescent phase the spectrum is well fitted () by an absorbed two-temperature model with keV, keV, cm-3, cm-3, and ; the value of is also in this case not well constrained: cm-2. During the flare, the value of , , , and remain essentially unchanged, but increases to and to cm-3 (null-hypothesis probability of the fit ).
In Table 4 the results of the spectral analysis for XMM-Newton sources with a 2MASS counterpart and a count rate greater than 1.5 cts/ks are presented (these are also 12 sources). For each source, the fit was performed jointly to PN, MOS1, and MOS2 spectral data. As in the table, for the stellar sources for which both Chandra and XMM-Newton data are available, the best fit values of the plasma temperature and the emission measure are in good agreement between the two data sets.
The typical value of the plasma temperature for the possible or likely members of NGC 752 is 0.7 keV. This value is similar to the plasma temperatures derived for members of the (0.8 Gyr old) Hyades cluster and somewhat lower than the typical plasma temperature for the much younger Pleiades ( 0.08 Gyr). Stern et al. (1994) report the results of 2T temperature fits to the Rosat spectral data of 11 members of the Hyades. The mean value of the highest temperature is 1.0 keV (all values) or 0.8 keV if one excludes one outlier with keV. If one computes the emission-measure-weighted mean temperature for each star, the mean value for the 11 Hyades members is 0.6 keV. For the Pleiades, Gagne et al. (1995) performed 2T temperature fits to the spectral data of 16 members and provides a value for the mean plasma temperature for each star. The mean of these 16 values is 0.9 keV.
| Src Id | Note | ||||||||
| keV | % | ||||||||
| 3 | 0.49 0.16 | 0.30 (froz.) | 0.56 0.50 | 0.99 | 0.45 | 0.02 | 0.60 | 38 | Likely memb. (DLM94) |
| 43 | 0.76 0.07 | 0.30 (froz.) | 0.64 0.20 | 0.58 | 0.86 | 0.03 | 0.81 | 0.0 | Likely memb. (DLM94) |
| 113 | 0.71 0.02 | 0.24 0.05 | 10.72 3.26 | 1.43 | 0.01 | 0.48 | 11.65 | 0.6 | Likely memb. – SB2 (DLM94) |
| 204 | 0.64 0.02 | 0.61 0.27 | 3.61 2.88 | 1.30 | 0.07 | 0.30 | 7.37 | 3.0 | Likely memb. – SB2 (DLM94) |
| 223† | 1.94 0.27 | 0.30 (froz.) | 2.08 0.36 | 0.95 | 0.54 | 0.11 | 2.53 | 0.0 | Possible memb. (IR colours) |
| 151 | 0.75 0.06 | 0.07 0.03 | 5.28 2.45 | 0.82 | 0.76 | 0.14 | - | 0.2 | Unlikely memb. (Nomad prop mot.) |
| 176 | 0.63 0.03 | 0.71 0.48 | 1.62 1.98 | 1.17 | 0.21 | 0.16 | - | 4.0 | Unlikely Memb. (DLM94) |
| 180 | 3.73 0.38 | 0.30 (froz.) | 32.26 2.27 | 0.98 | 0.56 | 2.15 | - | 13 | Likely background AGN |
| 182 | 0.71 0.04 | 0.09 0.03 | 9.87 3.55 | 1.18 | 0.16 | 0.27 | - | 0.0 | Unlikely memb. (Nomad prop. mot.) |
| 185† | 0.73 0.02 | 0.06 0.01 | 107.27 10.71 | 1.72 | 0.00 | 3.03 | - | 0.0 | Not a member |
| 211 | 0.51 0.09 | 0.30 (froz.) | 1.33 0.60 | 1.13 | 0.32 | 0.06 | - | 0.07 | Unlikely Memb. (DLM94) |
| 258 | 0.30 0.05 | 0.30 (froz.) | 1.63 1.07 | 0.49 | 0.90 | 0.05 | - | 0.01 | Unlikely Memb. (DLM94) |
(a) the table is divided in two parts, with likely or possible members of the cluster in the first half
(b) probability of constancy from the Kolmogorov-Smirnov test for the sources’ light curves
(c) cm-3
(d) erg cm-2 s-1
(e) erg s-1(assuming pc)
source affected by % pileup
†flare
This source corresponds to source 915 in the study by Platais (1991), which is classified as non-member.
| Idxmm | Idchandra | Note | ||||||||
| keV | % | |||||||||
| 42 | - | 0.94 0.09 | 0.07 0.02 | 11.55 2.57 | 1.16 | 0.17 | 0.34 | 8.30 | 0.0 | Likely memb. (DLM94) |
| 64 | 113 | 0.67 0.01 | 0.45 0.08 | 6.13 1.93 | 1.12 | 0.16 | 0.42 | 10.06 | 0.0 | Likely memb. (DLM94) |
| 98 | 204 | 0.65 0.02 | 0.68 0.21 | 3.84 2.10 | 1.13 | 0.21 | 0.36 | 8.63 | 44 | Likely memb. (DLM94) |
| 127 | - | 0.71 0.06 | 0.30 (froz.) | 1.47 0.39 | 0.78 | 0.70 | 0.07 | 1.69 | 0.5 | Possible memb. (IR colours) |
| 5 | - | 0.76 0.06 | 0.09 0.03 | 8.15 2.57 | 0.91 | 0.69 | 0.23 | - | 3.0 | Unlikely memb. (Nomad prop. mot.) |
| 11 | - | 0.63 0.03 | 0.30 (froz.) | 4.77 0.50 | 1.48 | 0.03 | 0.24 | - | 7.0 | Likely background AGN‡ |
| 76 | 151 | 0.71 0.05 | 0.30 (froz.) | 1.68 0.30 | 1.14 | 0.21 | 0.09 | - | 0.1 | Unlikely memb. (Nomad prop. mot.) |
| 86 | 176 | 0.57 0.03 | 0.30 (froz.) | 4.94 0.41 | 1.76 | 0.01 | 0.23 | - | 0.0 | Unlikely Memb. (DLM94) |
| 87 | 180 | 2.24 0.09 | 0.30 (froz.) | 39.50 1.12 | 2.52 | 0.00 | 2.14 | - | 0.0 | Likely background AGN‡ |
| 89 | 185 | 0.67 0.01 | 0.11 0.01 | 66.71 4.46 | 1.20 | 0.02 | 1.91 | - | 0.0 | Not a member |
| 101 | 211 | 0.66 0.07 | 0.30 (froz.) | 1.94 0.35 | 1.18 | 0.20 | 0.10 | - | 44 | Unlikely Memb. (DLM94) |
| 121 | - | 0.99 0.10 | 0.30 (froz.) | 2.86 0.87 | 1.72 | 0.00 | 0.14 | - | 9.0 | Likely background AGN‡ |
‡A Better fit to this source’s spectrum is obtained with an absorbed power law model
3.3 X-ray luminosity
For all the members of NGC 752 which have an X-ray counterpart (21 sources detected by Chandra plus 7, outside Chandra FOV, detected by XMM-Newton) we provide an estimate of the source X-ray luminosity in Table 5. The estimates for a star’s mass and bolometric luminosity were obtained using the isochrones by Girardi et al. (2002) (age 1.9 Gyr, Z = 0.01). The count rate to flux conversion factor was obtained using the pimms software at Heasarc, and assuming for the emitting plasma a Raymond-Smith model with keV and ; the absorbing column density was set to cm-2, as derived from the cluster . The conversion factor is for Chandra ACIS-I and for the XMM-Newton EPIC PN and MOS detectors combined555The conversion factor for the count rate of the XMM-Newton sources is the weighted mean of the conversion factors given by pimms for MOS1, MOS2 and PN, with weights 1,1, and 3 respectively. This is because in the source detection algorithm for the XMM-Newton merged file events the efficiency of PN was taken to be 3 times that of the MOS detectors..
Using the above conversion factors one can compare the fluxes from Chandra and XMM-Newton sources. The correlation coefficient for the 66 commonly detected sources is 1.06 0.04, if one restricts the analysis to the 12 members of NGC 752 commonly detected (for which our choice of pimms input parameters is appropriate), the correlation coefficient is 0.99 0.06. As can be seen from Table 5, there is good agreement between the Chandra and XMM-Newton luminosity values for these 12 sources. Note also that for the sources in Table 5 for which a spectral analysis was possible, the X-ray luminosity given here compares well with the values derived from the spectral fits.
Among the cluster members, most of the sources (21) are concentrated at the main sequence turn-off in the CMD and have masses around 1.3 and 1.5 solar masses. Most of these sources have a similar X-ray luminosity, between 0.1 and erg s-1; the exceptions, with erg s-1, are the two binary systems (DLM94), 113 and 204, the fast rotators (DLM94) 28xmm and 111xmm (this last one is also a binary system), and 75xmm. The two cluster members at the stage of core helium burning (115 and 124) have the same X-ray luminosity. There are only six sources within the mass range of our interest () among the likely cluster members; of these, five sources have luminosity in the range 0.1-0.4 erg s-1; the other one, source 42xmm, is significantly brighter. This star does not show evidence of being a close binary nor a fast rotator; van den Berg & Verbunt (2001) classified it as F5F7 and report that no Ca ii H&K are visible in the low-resolution spectra. For source 93, the X-ray luminosity derived from the Chandra data is times lower than that derived from the XMM-Newton data, however, this source’s light curve shows evidence that the source was caught by XMM-Newton during the decay phase of a flare.
In Table 5 we also provide an estimate of the X-ray luminosity of 11 sources which have no counterpart among the cluster members listed in DLM94, but which have 2MASS colours and proper motion (in Nomad) compatible with cluster membership; in addition their X-ray spectrum or hardness ratio (HR) is consistent with the source being a star. These 11 cluster member candidates have all a lower mass than those from DLM94, with their position in the IR CMD consistent with masses .
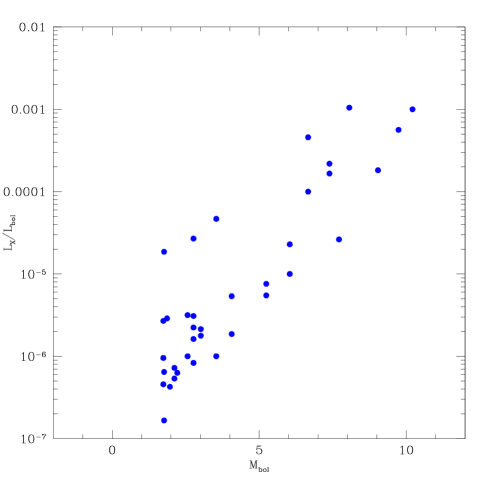
In Fig. 6 the value of from the table are plotted against a star’s bolometric magnitude, . This plot can be directly compared with the plot of vs for the Hyades in figure 15 of Stern et al. (1995). The comparison shows that for stars with bolometric magnitude (corresponding to ) the sensitivity of the Chandra observation in terms is such that we do not expect to lose a significant fraction of the cluster population within the Chandra FOV (possibly a couple of members), consistent with a Chandra detection rate of 88%. From the comparison of our Fig. 6 and Fig. 15 in Stern et al. (1995), the deficiency of low mass stars with respect to cluster members at the main-sequence turn-off in NGC 752 is again apparent. Comparison of the two figures shows also that this is not an effect of the sensitivity of the Chandra observation. This result and the fact that cross-matching with the 2MASS catalogue did not identify any new candidate members with beside those already listed in DLM94, confirms that (within the Chandra FOV where our sensitivity is higher) the sample by DLM94 is complete for and NGC 752 is intrinsically deficient in low mass stars.
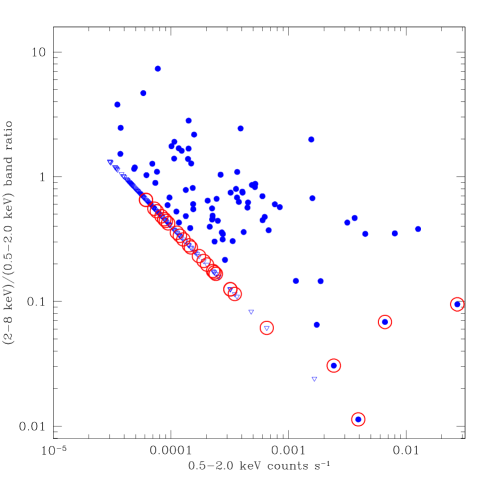
In Fig. 7, we show the scatter-plot of all the Chandra sources as a function of their HR. The HR values were obtained by cross-matching the 262 sources detected in the keV band with the sources detected in the keV band, with similar detection parameters (139 sources); upper limits are given for the sources which were not detected in the hard band. All the catalogued stars in the field have HR below 0.2 or an upper limit because they were not detected in the hard band at all.
| Idchandra | Idxmm | Rate | Mass | () | () | Notes(b) | ||
|---|---|---|---|---|---|---|---|---|
| erg s-1 | erg s-1 | |||||||
| 3 | 15 | 0.32 | 1.38 | 0.54 | 1.38 | 0.79 | -5.65 | |
| 17 | - | 0.08 | 1.11 | 0.13 | - | 0.27 | -5.73 | |
| 32 | 34 | 0.23 | 1.57 | 0.39 | 0.45 | 1.19 | -6.19 | SB1 |
| 43 | 40 | 0.35 | 1.57 | 0.59 | 0.53 | 1.20 | -6.02 | |
| 70 | 47 | 0.19 | 1.55 | 0.32 | 0.30 | 1.05 | -6.14 | SB2 |
| 71 | - | 0.12 | 1.38 | 0.20 | - | 0.79 | -6.08 | |
| 86 | - | 0.13 | 1.57 | 0.22 | - | 1.11 | -6.37 | |
| 90 | 57 | 0.2 | 1.32 | 0.34 | 0.68 | 0.69 | -5.75 | |
| 93 | 59† | 0.08 | 0.91 | 0.13 | 0.81 | -0.20 | -5.26 | SB1 |
| 113 | 64 | 6.6 | 1.57 | 11.10 | 9.95 | 1.19 | -4.73 | SB2 |
| 115 | - | 0.09 | 1.59 | 0.15 | - | 1.74 | -7.15 | SB1 |
| 116 | - | 0.06 | 1.57 | 0.10 | - | 1.19 | -6.78 | SB1, ROT |
| 117 | - | 0.23 | 1.11 | 0.39 | - | 0.27 | -5.27 | |
| 124 | - | 0.09 | 1.59 | 0.15 | - | 1.74 | -7.15 | |
| 145 | - | 0.14 | 1.55 | 0.24 | - | 1.05 | -6.27 | |
| 160 | 80 | 0.17 | 1.43 | 0.29 | 0.61 | 0.87 | -6.00 | ROT |
| 184 | - | 0.11 | 0.91 | 0.18 | - | -0.20 | -5.12 | |
| 197 | 94 | 0.24 | 1.32 | 0.40 | 0.35 | 0.69 | -5.67 | |
| 201 | 96 | 0.15 | 1.52 | 0.25 | 0.54 | 1.01 | -6.20 | ROT |
| 204 | 98 | 3.92 | 1.38 | 6.59 | 8.46 | 0.79 | -4.57 | SB2 |
| 207 | 99 | 0.07 | 1.20 | 0.12 | 0.15 | 0.48 | -6.00 | SB1 |
| 18 | 0.25 | 1.57 | 0.28 | 1.20 | -6.34 | |||
| 19 | 0.66 | 1.38 | 0.74 | 0.79 | -5.51 | |||
| 28 | 1.41 | 1.58 | 1.59 | 1.15 | -5.54 | ROT | ||
| 42 | 4.85 | 1.20 | 5.47 | 0.48 | -4.33 | |||
| 75 | 1.48 | 1.57 | 1.67 | 1.20 | -5.57 | |||
| 111 | 0.80 | 1.43 | 0.90 | 0.87 | -5.50 | SB1, ROT | ||
| 124 | 0.35 | 1.38 | 0.39 | 0.79 | -5.79 | SB1 | ||
| 21 | - | 0.08 | 0.35 | 0.13 | - | -1.72 | -3.74 | |
| 44 | - | 0.13 | 0.25 | 0.22 | - | -2.00 | -3.25 | |
| 87 | 56 | 0.15 | 0.20 | 0.25 | 0.70 | -2.19 | -3.00 | |
| 107 | - | 0.04 | 0.55 | 0.07 | - | -1.19 | -4.58 | |
| 136 | - | 0.16 | 0.79 | 0.27 | - | -0.52 | -4.64 | |
| 223† | - | 1.15 | 0.50 | 1.93 | - | -1.33 | -2.98 | |
| 246 | - | 0.07 | 0.79 | 0.12 | - | -0.52 | -5.00 | |
| 2 | 0.66 | 0.60 | 0.74 | -1.06 | -3.66 | |||
| 35 | 0.5 | 0.60 | 0.56 | -1.06 | -3.78 | |||
| - | 58 | 0.59 | 0.70 | - | 0.67 | -0.77 | -4.00 | |
| 127 | 2.7 | 0.70 | 3.05 | -0.77 | -3.34 |
(a) The first 28 sources are listed in DLM94 and classified as likely or possible members of NGC 752, the last 11 sources are not listed in DLM94 but have 2MASS colours and Nomad proper motion consistent with the star being a member of NGC 752
(b) Notes are from DLM94
- source was not detected
source was outside FOV
†flare
3.3.1 Comparison with the Rosat observation
As mentioned in Sect. 1.1, NGC 752 was observed in the X-ray with Rosat by Belloni & Verbunt (1996) who identified seven cluster members; of these, 3 have Chandra and XMM-Newton counterparts, one has only XMM-Newton counterpart (being outside the Chandra FOV) and the other three are outside the XMM-Newton FOV. Although source BV6 is identified with a member of NGC 752 by Belloni & Verbunt (1996), the corresponding source in Chandra (Id 131) does not match any of the sources in DLM94 nor in 2MASS within a search radius of 3 arcsec. The Chandra X-ray source is arcsec away from the member of NGC 752 with DLM94 Id 868 (and the corresponding 2MASS source), which explains why Belloni & Verbunt (1996) found the associations with a cluster member for the Rosat source. Given the accuracy of Chandra and 2MASS positions we discarded this X-ray source as possible counterpart of the cluster member. Sources BV11 and BV16 correspond to the Chandra sources 204 and 113 respectively and their Rosat luminosity is within 50% from the values given in Table 5. BV29 corresponds to 42xmm and its Rosat luminosity is about a factor of 3 higher than that derived here. BV30, BV45 and BV46 are outside XMM-Newton FOV, their colours corresponds to star masses of 1.0, 1.6, and 0.9 respectively. The X-ray luminosity of the two solar-mass stars BV30 and BV46 (erg s-1 and erg s-1) are significantly higher than the X-ray luminosity of any of the solar-mass stars in our sample and correspond to values of and respectively, that is a factor of 10 or higher than the values in our sample or in the Hyades (Stern et al., 1995), for this mass range, suggesting that these two sources were probably undergoing a flare during the Rosat observation.
4 Discussion and conclusions
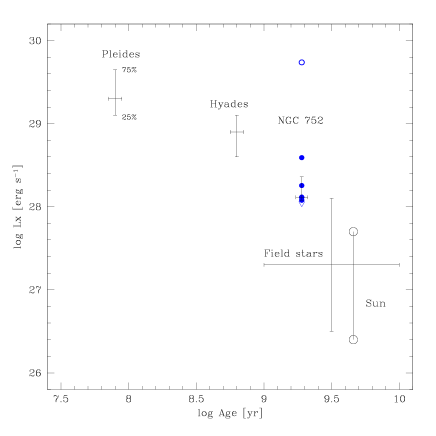
The aim of this paper is to determine the level of stellar activity of solar type stars at an intermediate age between that of the Hyades and those of field stars. In Fig. 8, we compare the luminosities of members of NGC 752 with masses in the range with the luminosity distributions of the Pleiades, the Hyades and the field stars. These three points are from Micela (2002a) and refer to stars within the same mass range (). As summarised in Table 5, in NGC 752 we detected in the X-ray 6 cluster members within this mass range (the points in the figure), 5 stars within the Chandra FOV and one outside (significantly brighter than the others) detected by XMM-Newton. For stars detected both by Chandra and XMM-Newton we used in the figure the Chandra derived flux estimate. Within the Chandra FOV there is one additional known member with solar mass: Id 790 in the work by DLM94 (easily identifiable in the CMD in Fig. 3). The upper limit on the X-ray luminosity of this star is also given in the figure.
In the figure, the crosses give the median value of the distributions (including upper limits) and the size of the vertical bars are determined by the 25% and 75% quantiles. In Sect. 3 we showed that we expect the optical sample by DLM94 to be complete within the Chandra FOV for , thus the sample of the 5 Chandra detected solar-mass cluster members plus the upper limit for the one undetected source is very likely to include all the cluster members with masses in the range, in this field. The median luminosity value for this sample is erg s-1; the quantiles bars also refer to this sample. Including the two candidate members with (Ids 136 and 246 – see Table 5) does not change the median value; including the one XMM-Newton detected (solar-mass) member outside the Chandra FOV does not change this value either, although it increases the size of the 75% quantile bar. The error on the distance of the cluster ( pc) is relatively small and does not impact significantly on the position of the median luminosity of NGC 752 in the plot; for the distance range of pc, the value of the median X-ray luminosity stays within the two quantile vertical bars.
The X-ray luminosities of the seven points in NGC 752 have a spread of more than one order of magnitude, confirming the large spread in luminosity of stars with the same age and similar mass already observed in the Pleiades, the Hyades (e.g. Stern et al., 1995; Micela et al., 1996) and in the sample by Ng & Bertelli (1998) studied by Micela (2002a). The observed spread in at a fixed age is associated to the spread in rotational periods (Pizzolato et al., 2003), which appears to depend on the coupling between the circumstellar disc and the star in the pre-main sequence phase; in some objects this coupling prevents a young star from spinning up during its PMS contraction, yielding a large spread in the initial angular momentum distribution (e.g. Bouvier, 1994; Choi & Herbst, 1996). The analysis of 500 pre-main sequence and recently arrived main-sequence stars by Herbst & Mundt (2005) supports this view.
The median X-ray luminosity of 1.3 erg s-1for solar-type stars in NGC 752 is in good agreement with the decaying trend of X-ray luminosity from the Hyades to the field stars. The value is about 6 times lower than the median value for the Hyades and 6.5 times higher than the median value from field stars, consistent with a steepening of the X-ray luminosity scaling law after the age of the Hyades.
In a study of nine solar-like G-stars with ages ranging from 70 Myr to 9 Gyr, Guedel et al. (1997) found with , for stars with ages beyond a few 100 Myr, in agreement with the earlier results by Maggio et al. (1987). The study of a sample of 11 late-type stars in the Chandra Deep Field-North by Feigelson et al. (2004) is also consistent with this scaling law, for Gyr, although an excellent fit to their data is found for . Pace & Pasquini (2004) find evidence for a very steep decay of the chromospheric activity between 0.5 and 2 Gyr, their sample at Gyr consisting of seven stars.
Comparison of the median X-ray luminosity of NGC 752 with that of the Hyades is fully consistent with a scaling law with . This scaling law is also consistent with the decay in X-ray luminosity from NGC 752 to the field stars, given the age uncertainties of the field stars. Since (e.g. Pallavicini et al., 1981; Pizzolato et al., 2003), this result implies for the scaling law of rotational velocities, for Gyr. This is significantly steeper than found by Skumanich (1972) and would require a nearly-dipolar magnetic configuration to be explained in terms of magnetic breaking (Kawaler, 1988). The effect of differential rotation in the stellar interior and the onset of magnetic saturation, however, may also play a role (Krishnamurthi et al., 1997) and it is possible that the coupling efficiency between outer and inner layers of stars weakens with age or that it is mass dependent (Barnes, 2003).
Comparison of rotational velocities in the Pleiades with those in older clusters such as M34 and the Hyades shows that, within the age interval of the Pleiades and Hyades, a star’s rotational rate typically decreases less steeply than predicted by a pure magnetic braking law, that is (Queloz et al., 1998). The decay of the median of stars with mass from the Pleiades to the Hyades reported by Micela (2002a) (the points shown in Fig. 8) and that reported by Preibisch & Feigelson (2005) for stars with for the same clusters, confirm this result ().
As discussed by Queloz et al. (1998), a value of could be an indication that angular momentum tapped in the radiative core of slow rotators on the zero age main sequence resurfaces into the convective envelope between the Pleiades and Hyades ages. We know from helioseismology that there is no gradient between the angular velocities of the core and the envelope in the Sun, thus our data suggest a change in rotation regimes of the stellar interior at 1 Gyr.
The shape of the temporal evolution of the X-ray luminosity of solar-mass stars also has an important consequence in the evolution of close-in exoplanets within 0.5 AU. As shown by Penz et al. (2008), the later the timing of the transition between the two scaling laws of , the smaller the fraction of gaseous planets which at 4.5 Gyr retain most of their initial mass. Our result indicates this transition to be at around 1 Gyr.
Acknowledgements.
We gratefully acknowledge our referee, Eric Feigelson, for his useful suggestions which have significantly improved the quality of the paper. We thank Marco Miceli for providing us the spectral analysis of the extended source in the XMM-Newton FOV, Guido de Marchi for useful discussions and Andrew Thean for his help with the English style. GM and IP acknowledge the financial contribution from contract ASI-INAF I/088/96/0. This research makes use of data products from the Two Micron All Sky Survey, which is a joint project of the University of Massachusetts and the Infrared Processing and Analysis Center/California Institute of Technology, funded by the National Aeronautics and Space Administration and the National Science Foundation.References
- Baliunas et al. (1995) Baliunas, S. L., Donahue, R. A., Soon, W. H., et al. 1995, ApJ, 438, 269
- Barnes et al. (1999) Barnes, G., Charbonneau, P., & MacGregor, K. B. 1999, ApJ, 511, 466
- Barnes (2003) Barnes, S. A. 2003, ApJ, 586, 464
- Belloni & Verbunt (1996) Belloni, T. & Verbunt, F. 1996, A&A, 305, 806
- Bouvier (1994) Bouvier, J. 1994, in Astronomical Society of the Pacific Conference Series, Vol. 64, Cool Stars, Stellar Systems, and the Sun, ed. J.-P. Caillault, 151
- Brandt et al. (2001) Brandt, W. N., Alexander, D. M., Hornschemeier, A. E., et al. 2001, AJ, 122, 2810
- Choi & Herbst (1996) Choi, P. I. & Herbst, W. 1996, AJ, 111, 283
- Christensen & Simon (2004) Christensen, C. & Simon, T. 2004, in Bulletin of the American Astronomical Society, Vol. 36, Bulletin of the American Astronomical Society, 1359
- Cox (2000) Cox, A. N., ed. 2000, Allen’s astrophysical quantities (Springer)
- Daniel et al. (1994) Daniel, S. A., Latham, D. W., Mathieu, R. D., et al. 1994, PASP, 106, 281
- Dickey & Lockman (1990) Dickey, J. M. & Lockman, F. J. 1990, ARA&A, 28, 215
- Dinescu et al. (1995) Dinescu, D. I., Demarque, P., Guenther, D. B., et al. 1995, AJ, 109, 2090
- Ebbighausen (1939) Ebbighausen, E. G. 1939, ApJ, 89, 431
- Feigelson et al. (2004) Feigelson, E. D., Hornschemeier, A. E., Micela, G., et al. 2004, ApJ, 611, 1107
- Gagne et al. (1995) Gagne, M., Caillault, J.-P., & Stauffer, J. R. 1995, ApJ, 450, 217
- Girardi et al. (2002) Girardi, L., Bertelli, G., Bressan, A., et al. 2002, A&A, 391, 195
- Guedel et al. (1997) Guedel, M., Guinan, E. F., & Skinner, S. L. 1997, ApJ, 483, 947
- Herbst & Mundt (2005) Herbst, W. & Mundt, R. 2005, ApJ, 633, 967
- Kalberla et al. (2005) Kalberla, P. M. W., Burton, W. B., Hartmann, D., et al. 2005, A&A, 440, 775
- Kawaler (1988) Kawaler, S. D. 1988, ApJ, 333, 236
- Krishnamurthi et al. (1997) Krishnamurthi, A., Pinsonneault, M. H., Barnes, S., & Sofia, S. 1997, ApJ, 480, 303
- MacGregor & Brenner (1991) MacGregor, K. B. & Brenner, M. 1991, ApJ, 376, 204
- Maggio et al. (1987) Maggio, A., Sciortino, S., Vaiana, G. S., et al. 1987, ApJ, 315, 687
- Meynet et al. (1993) Meynet, G., Mermilliod, J.-C., & Maeder, A. 1993, A&AS, 98, 477
- Micela (2002a) Micela, G. 2002a, in F. Favata and J. Drake eds., ASP Conf. Ser. 277: Stellar Coronae in the Chandra and XMM-Newton Era, 263
- Micela (2002b) Micela, G. 2002b, in Astronomical Society of the Pacific Conference Series, Vol. 269, The Evolving Sun and its Influence on Planetary Environments, ed. B. Montesinos, A. Gimenez, & E. F. Guinan, 107
- Micela et al. (1996) Micela, G., Sciortino, S., Kashyap, V., et al. 1996, ApJS, 102, 75
- Ng & Bertelli (1998) Ng, Y. K. & Bertelli, G. 1998, A&A, 329, 943
- Pace & Pasquini (2004) Pace, G. & Pasquini, L. 2004, A&A, 426, 1021
- Pallavicini et al. (1981) Pallavicini, R., Golub, L., Rosner, R., et al. 1981, ApJ, 248, 279
- Penz et al. (2008) Penz, T., Micela, G., & Lammer, H. 2008, A&A, 477, 309
- Pizzolato et al. (2003) Pizzolato, N., Maggio, A., Micela, G., et al. 2003, A&A, 397, 147
- Platais (1991) Platais, I. 1991, A&AS, 87, 69
- Preibisch & Feigelson (2005) Preibisch, T. & Feigelson, E. D. 2005, ApJS, 160, 390
- Queloz et al. (1998) Queloz, D., Allain, S., Mermilliod, J.-C., et al. 1998, A&A, 335, 183
- Randich (2000) Randich, S. 2000, in Astronomical Society of the Pacific Conference Series, Vol. 198, Stellar Clusters and Associations: Convection, Rotation, and Dynamos, ed. R. Pallavicini, G. Micela, & S. Sciortino, 401
- Rieke & Lebofsky (1985) Rieke, G. H. & Lebofsky, M. J. 1985, ApJ, 288, 618
- Siess et al. (2000) Siess, L., Dufour, E., & Forestini, M. 2000, A&A, 358, 593
- Sills & Pinsonneault (2000) Sills, A. & Pinsonneault, M. H. 2000, ApJ, 540, 489
- Simon et al. (1985) Simon, T., Herbig, G., & Boesgaard, A. M. 1985, ApJ, 293, 551
- Skumanich (1972) Skumanich, A. 1972, ApJ, 171, 565
- Snowden et al. (2008) Snowden, S. L., Mushotzky, R. F., Kuntz, K. D., & Davis, D. S. 2008, A&A, 478, 615
- Stern et al. (1995) Stern, R. A., Schmitt, J. H. M. M., & Kahabka, P. T. 1995, ApJ, 448, 683
- Stern et al. (1994) Stern, R. A., Schmitt, J. H. M. M., Pye, J. P., et al. 1994, ApJ, 427, 808
- van den Berg & Verbunt (2001) van den Berg, M. & Verbunt, F. 2001, A&A, 375, 387
- Zacharias et al. (2004) Zacharias, N., Monet, D. G., Levine, S. E., et al. 2004, in Bulletin of the American Astronomical Society, Vol. 36, Bulletin of the American Astronomical Society, 1418