CARMA Millimeter-Wave Aperture Synthesis Imaging of the HD 32297 Debris Disk
Abstract
We present the first detection and mapping of the HD 32297 debris disk at 1.3 mm with the Combined Array for Research in Millimeter-wave Astronomy (CARMA). With a sub-arcsecond beam, this detection represents the highest angular resolution (sub)mm debris disk observation made to date. Our model fits to the spectral energy distribution from the CARMA flux and new Spitzer MIPS photometry support the earlier suggestion that at least two, possibly three, distinct grain populations are traced by the current data. The observed millimeter map shows an asymmetry between the northeast and southwest disk lobes, suggesting large grains may be trapped in resonance with an unseen exoplanet. Alternatively, the observed morphology could result from the recent breakup of a massive planetesimal. A similar-scale asymmetry is also observed in scattered light but not in the mid-infrared. This contrast between asymmetry at short and long wavelengths and symmetry at intermediate wavelengths is in qualitative agreement with predictions of resonant debris disk models. With resolved observations in several bands spanning over three decades in wavelength, HD 32297 provides a unique testbed for theories of grain and planetary dynamics, and could potentially provide strong multi-wavelength evidence for an exoplanetary system.
Subject headings:
circumstellar matter planetary systems: formation planetary systems: protoplanetary disks stars: individual (HD 32297)1. Introduction
Debris disks provide the principal means of studying the formation and evolution of planetary systems on timescales of 10100 Myr. Evidence for exoplanets in these systems can be found by matching density variations in debris disks to theoretical models of the gravitational perturbations caused by planets (e.g., Reche et al. 2008). A modest sample of debris disks have now been imaged in the visible, and many show substructure such as clumps, warps, and offsets, consistent with dynamical perturbations by massive planets. However, a wide variety of other mechanisms can produce similar structures (Moro-Martin et al. 2007, and references therein). As different wavebands are sensitive to different grain sizes, which are in turn subject to different dynamical influences, multi-wavelength observations offer the most promising path towards definitively classifying the physical mechanisms at work in these systems. At present, only a few debris disks have resolved observations spanning more than a decade in wavelength. A particularly critical, though technologically challenging, deficit of observations lies at (sub)millimeter wavelengths, which trace large grains primarily affected by gravitational forces. To date, bolometer arrays have resolved 8 debris disks in the (sub)mm (e.g., Holland et al. 1998, Greaves et al. 1998). However, such low-resolution () single-dish measurements are limited to the largest, nearest disks. Higher resolution interferometric observations are needed to access the larger debris disk population already imaged at shorter wavelengths. Some pioneering work has been done in this area; OVRO and PdBI have detected and resolved two debris disks (Vega: Koerner et al. 2001, Wilner et al. 2002; HD 107146: Carpenter et al. 2005). Recently, Corder et al. (2008) mapped HD 107146 with the Combined Array for Research in Millimeter-wave Astronomy (CARMA) at 1.3 mm, providing the highest fidelity interferometric debris disk map to date. Here, we report the near-simultaneous CARMA detection of HD 32297, the third debris disk mapped with a (sub)mm interferometer. With a sub-arcsecond beam, this detection is the highest angular resolution (sub)mm debris disk observation made to date.
HD 32297 is a 30 Myr A-star at pc (Perryman et al., 1997), first discovered to host a resolved debris disk with HST/NICMOS near-infrared (NIR) imaging (Schneider et al., 2005). The discovery image showed an edge-on debris disk extending to 400 AU (3.3′′), with an inner-disk brightness asymmetry inward of 60 AU (). Kalas (2005) subsequently imaged HD 32297 in the optical, revealing an asymmetric, extended outer disk (1700 AU, 15′′) likely interacting with the interstellar medium. Later, Redfield (2007) detected circumstellar gas in this system, reporting the strongest Na I absorption measured toward any known debris disk. Most recently, Fitzgerald et al. (2007), hereafter F07, and Moerchen et al. (2007) resolved HD 32297 in mid-infrared (MIR), thermal emission. Detailed analysis of the spectral energy distribution (SED) by F07 showed that multiple grain populations may be present in the disk. The lack of long wavelength data needed to characterize the large grain properties of HD 32297 motivated the CARMA observations presented here.
2. Observations and Data Reduction
We observed HD 32297 with CARMA, located 7200 ft above sea level outside Big Pine, California and consisting of six 10.4-m and nine 6.1-m antennas, previously comprising the OVRO and BIMA arrays. We used CARMA’s D configuration (baselines: 11148 m) on 2008 March 06 and the more extended C configuration (baselines: 26370 m) on 2007 October 26 and 2007 November 08. We tuned the receivers to a central frequency of 227 GHz. The total continuum bandwidth is 1.5 GHz, contained in three 500 MHz bands. Our total observation time was 19 hours in good weather with rms path errors of m and zenith opacities of . Throughout our observations, we used optical offset guiding to maximize pointing accuracy (Corder, Carpenter & Wright 2008, in prep).
We calibrated the data using the MIRIAD software package. We performed passband calibration with 15 minutes integrations on a bright quasar (3C 84, 3C 111) observed at the start of each track. We derived time-dependent phase solutions from 3 minutes integrations on J0530+135, observed following each 15 minutes integration on source. In addition, we used 1 minutes integrations on a secondary calibrator, 3C 120 (observed every cycle), to test the astrometric accuracy of the interferometer and the integrity of our phase solutions. Finally, we flux-calibrated the data using a 5 minutes integration on a planet (Uranus, Mars) observed once per track. The systematic uncertainty in CARMA’s absolute flux scale is 20% (W. Kwon, private communication).
The 1.3 mm map of HD 32297 combining all observations is shown in Figure 1. For this map, we adopted natural weighting to provide optimal sensitivity and processed the visibility data as a mosaic to accomodate the heterogeneous array. We deconvolved the dirty map using the Steer CLEAN algorithm for mosaics (Steer et al., 1984), set to bring the rms in the cleaned region of the residual map to that measured in an off-source region. To emphasize possible resolved structure, we restored the map with a circular beam with radius equal to that of the semimajor axis of the naturally weighted beam ().
In addition to the new CARMA data presented here, we also extracted Spitzer MIPS photometry from director’s discretionary time program 225 (PI: G. Schneider). Using the MOPEX package, we manually calibrated the 24 m data to remove the strong background gradient and “jailbars” evident in the pipeline processed image. The 70 m data did not suffer severe artifacts; in this case, we simply mosaicked the data. The 160 m data are contaminated by a spectral leak, which occurs for bright sources and is typically corrected using observations of a calibration star. However, no such calibration observation was made in this program; we, therefore, include the 160 m data in this analysis only as an upper-limit. The MIPS fluxes as derived from aperture photometry are (23.68 m) = 0.21 0.01 Jy, (71.42 m) = 0.85 0.06 Jy, (155.9 m) 0.46 0.06 Jy. In the SED modeling (§4), we adopt calibration uncertainties listed in the MIPS data handbook and apply a color correction appropriate to the modeled grain temepratures.
3. Results
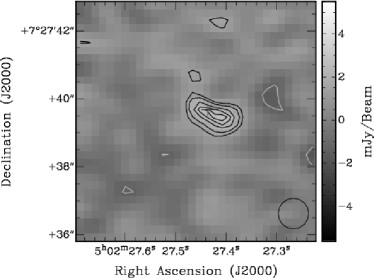
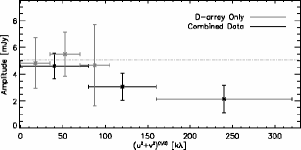
Figure 1 shows a 1.3 mm continuum source detected at the 7 level. The observed peak in the map is mJy beam-1. The probability of detecting an unrelated background source within 1′′ of the HD 32297 stellar position is 1%, based on recent source counts at 850 m (e.g., Scott et al. 2002). Thus, we conclude that the detected emission is associated with the HD 32297 debris disk. The map morphology suggests the source may be resolved (see below). However, in the D-array data set alone the visibility amplitudes are constant with baseline length (Figure 2), suggesting the source is unresolved. We therefore, adopt an integrated flux measured using the D-array data set only: mJy.
The source centroid in Figure 1 appears offset from the Hipparcos stellar position (located at phase center). To quantify this result, we fit a point source model to the visibility data; the measured offset is (, ). This offset is significantly larger than that observed for test calibrator, 3C 120, observed each source cycle (, , ). In addition to systematic astrometric uncertainties, we estimate a statistical positional error for HD 32297 of , in agreement with the formal errors derived from fitting the visibilities. Combining the systematic and statistical errors, the total rms positional uncertainty for HD 32297 is . Thus, the peak continuum emission is offset from the stellar position at the 4 level.
As previously noted, the Figure 1 map suggests the source is marginally resolved. To quantify this effect, in Figure 2, we show the visibility amplitudes for the combined data set as a function of projected baseline length from phase center. The data are binned by baseline length in three circularly symmetric annular bins, with widths chosen to provide approximately the same number of visibilities per bin. The errors in amplitude represent the standard deviation in the mean of the visibilities in each bin. Figure 2 shows that the source amplitudes decline with baseline length, with a deviation from a point-source model of approximately 2. Thus, the source appears to be indeed resolved, though additional data are needed to confirm this result. In particular, we note that uncorrected atmospheric phase errors at mm wavelengths can artificially enlarge targets. Still, the observed morphology agrees with that observed at other wavelengths. Fitting an elliptical Gaussian to the visibilities yields a FWHM of with a position angle of , consistent to within 1 of the orientation observed in the NIR and MIR (P.A., Schneider et al. 2005, F07, Moerchen et al. 2007).
We observe no CO line emission in our data. The 3 limit is 22 mJy beam-1 (1.5 K, ) in a 42 km s-1 channel. Adopting the same assumptions as Dent et al. (2005), the corresponding gas mass limit is .
4. Discussion
F07 attempted to model the observed SED and -band image of HD 32297 with a single ring of grains of characteristic size, but found that a second population of grains was needed to adequately fit the observed SED for m. Indeed, the contrast between the observed mm and -band morphologies (see below and Figure 4) suggests that the grains responsible for the emission at each wavelength constitute separate populations. To test whether the population of mm-emitting grains is consistent with the second, larger grain population proposed by F07 to fit the SED at 25 m 60 m, we revisit the F07 model, adopting their data and fitting method, and incorporating the Qa-band flux of Moerchen et al. (2007) and the new MIPS and CARMA fluxes. The free parameters in the single population model of F07 are the disk inclination (), position angle (PA), radii of the inner and outer edges (, ), surface density power-law index (), vertical optical depth to absorption at the inner edge (), stellar flux factor (), and effective grain size (). To fit the long-wavelength SED (m), we augment this model with a population of larger grains of effective size and total emitting area , located in a narrow ring at the small-grain inner-disk edge, . These grains contribute flux, , according to:
| (3) | |||||
| (4) | |||||
| (5) |
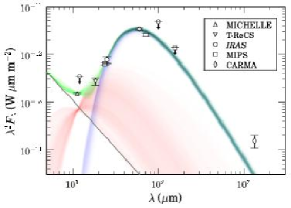
Following F07, we ran three Monte Carlo Markov chains with samples, and simulataneously fit both the large and small grain populations. The results of this procedure are listed in Table 1, and the corresponding range of allowed dust emission is plotted in Figure 3 (red: small grains, blue: large grains, grey: photosphere, green: composite). While the two-population model provides a satisfactory fit to the mid- and far-infrared data, the mm flux is underestimated at the 4 level, suggesting that the second grain population proposed by F07 is not responsible for the majority of the mm flux. Nevertheless, the new MIPS data lend further evidence to the F07 suggestion that two populations are needed to fit the observed SED for m. Therefore, the fit suggests at least three distinct populations are traced by the current observations. However, from the two-population model, only the 1.3 mm flux appears to trace the putative third population. Since this population is described by both a mass/emitting area and a size/temperature, we lack sufficient data to fully characterize it via modeling. We note, though, that this population likely traces % of the total dust mass. Assuming a characteristic stellocentric distance of 50 AU (§3), (F07), and an effective grain size of 1.3-mm, the implied mm grain temperature is 30 K, suggesting a dust mass of (adopting an opacity of 1.7 cm2 g-1). This estimated mass is among the highest observed for debris disks detected in the (sub)mm and is two orders of magnitude larger than that implied for the “large-grain” population in the SED fit: (using the fitted parameters in Table 1 and assuming spherical grains with a density of 1 g cm-3). Future far-infrared / sub-mm observations are needed to confirm the three populations proposed here and better constrain their properties.
| Parameter | Best-fit | Description |
|---|---|---|
| (deg) | disk inclination | |
| PA (deg) | disk position angle | |
| (AU) | inner edge | |
| (AU) | 1200 | outer edge |
| vertical optical depth at | ||
| -1.63 | surf density power-law index | |
| , stellar flux factor | ||
| small grain effective size | ||
| large grain emitting area | ||
| large grain effective size |
Note. — Confidence intervals are 95% for marginal posterior distributions. Adopted priors are as in F07, except for , which is constrained to be in the domain [-4,0] due to the inconsistency of rising surface density with the scattered-light image and CARMA map; the large grain effective size was constrained by a log-uniform prior from 1 nm to 100 mm and a requirement that .
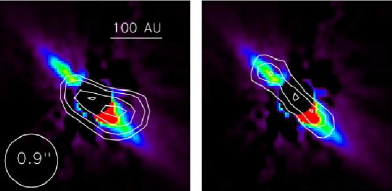
To address the observed mm morphology, in Figure 4, we qualitatively compare the CARMA mm map (contours, left panel) to the MIR image of F07 (contours, right panel) and the NIR scattered-light image of Schneider et al. (2005) (color, both panels). The images at all three wavelengths are consistent with an edge-on disk. However, while both the NIR and CARMA data exhibit a brightness asymmetry between the northeast and southwest lobes inward of 0.5′′, the F07 MIR image is consistent with azimuthal symmetry. We note that Moerchen et al. (2007) found evidence for asymmetry in their Qa-band data, though their data were not PSF subtracted, and the asymmetry was in the opposite sense as observed in the NIR / CARMA data (NE lobe brighter than SW).
Recently, Grigorieva et al. (2007) used predictions from their numerical model of collisional avalanches to suggest that the observed scattered-light asymmetry in HD 32297 results from the breakup of a large planetesimal. However, while a massive collision can explain the observed NIR and mm morphology, it is not clear why the MIR image would not show a similar asymmetry. An alternative hypothesis is that the structure results from a planetary-induced resonance. In this case, the dust is either trapped in resonance as it drifts inward due to Poynting-Robertson drag, or it remains locked in resonance after being generated by parent planetesimals in resonance themselves (e.g., Krivov et al. 2007, and references therein). Interestingly, a recent study of the latter mechanism by Wyatt (2006) directly predicts a contrast between asymmetry at short and long wavelengths and symmetry at intermediate wavelengths, as observed in HD 32297. In this model, (sub)mm emission is dominated by large grains, which have the same clumpy resonant distribution as the parent planetesimals. Small grains, traced at short wavelengths, exhibit a similar asymmetry, as they are preferentially born in the high density, resonant structures before being rapidly expelled from the system. Lastly, moderately-sized grains sampled at intermediate wavelengths remain bound to the star, but have fallen out of resonance due to radiation pressure and are subsequently scattered into an axisymmetric morphology.
This proposed scenario of Wyatt (2006) conveniently explains the qualitative picture for HD 32297 depicted in Figure 4, yet we caution that this suggestion is highly speculative, and future rigorous modeling of this system is needed to draw firm conclusions from the available data. One potential problem with this hypothesis is that the SED model predicts that the small (-band-emitting) grains have sizes 1 m (Table 1), similar to that expected to produce the NIR scattered-light image (see discussion in F07). However, the interpretation of Figure 4 in terms of the Wyatt (2006) models requires that the NIR-scattering and MIR-emitting grains have different sizes. This ambiguity could potentially be resolved through simultaneous modeling of scattering and emission, incorporating the optical image presented in Kalas (2005). Most importantly, and independent of speculation, HD 32297 is currently one of only a few debris disks with resolved observations in four wavelength regimes (optical, NIR, MIR, mm). Taken together, these observations can provide a unique testbed for theories of grain and planetary dynamics.
References
- Carpenter et al. (2005) Carpenter, J. M., et al. 2005, AJ, 129, 1049
- Corder et al. (2008) Corder, S. A., et al. 2008, ApJ, submitted
- Dent et al. (2005) Dent, W. R. F., et al. 2005, MNRAS, 359, 663
- Fitzgerald et al. (2007) Fitzgerald, M. P., et al. 2007, ApJ, 670, 557
- Greaves et al. (1998) Greaves, J. S., et al. 1998, ApJ, 5 06, L133
- Grigorieva et al. (2007) Grigorieva, A., et al. 2007, A&A, 461, 537
- Holland et al. (1998) Holland, W. S., et al. 1998, Nature, 392, 788
- Kalas (2005) Kalas, P. 2005, ApJ, 635, L169
- Krivov et al. (2007) Krivov, A. V. et al. 2007, A&A, 462, 199
- Koerner et al. (2001) Koerner, D. W., et al. 2001, ApJ, 560, L181
- Moerchen et al. (2007) Moerchen, M. M., et al. 2007, ApJ, 666, L109
- Moór et al. (2006) Moór, A., et al. 2006, ApJ, 644, 525
- Moro-Martin et al. (2007) Moro-Martin, A., et al. 2007, ArXiv Astrophysics e-prints, arXiv:astro-ph/0703383
- Perryman et al. (1997) Perryman, M. A. C., et al. 1997, A&A, 323, L49
- Reche et al. (2008) Reche, R., et al. 2008, A&A, 480, 551
- Redfield (2007) Redfield, S. 2007, ApJ, 656, L97
- Schneider et al. (2005) Schneider, G., et al. 2005, ApJ, 629, L117
- Scott et al. (2002) Scott, S. E., et al. 2002, MNRAS, 331, 817
- Steer et al. (1984) Steer, D. G., et al. 1984, A&A, 137, 159
- Wilner et al. (2002) Wilner, D. J., et al. 2002, ApJ, 569, L115
- Wyatt (2006) Wyatt, M. C. 2006, ApJ, 639, 1153