11email: defrere@astro.ulg.ac.be 22institutetext: LAOG–UMR 5571, CNRS and Université Joseph Fourier, BP 53, F-38041 Grenoble, France 33institutetext: LESIA, Observatoire de Paris-Meudon, CNRS, 5 place Jules Janssen, F-92195 Meudon, France 44institutetext: NASA Goddard Space Flight Center, 8800, Greenbelt Road, Greenbelt, MD 20771, USA 55institutetext: Science Payloads and Advanced Concepts Office, ESA/ESTEC, postbus 299, NL-2200 AG Noordwijk, The Netherlands
Nulling interferometry: performance comparison between space and ground-based sites for exozodiacal disc detection
Abstract
Context. Characterising the circumstellar dust around nearby main sequence stars is a necessary step in understanding the planetary formation process and is crucial for future life-finding space missions such as ESA’s Darwin or NASA’s Terrestrial Planet Finder (TPF). Besides paving the technological way to Darwin/TPF, the space-based infrared interferometers Pegase and FKSI (Fourier-Kelvin Stellar Interferometer) will be valuable scientific precursors.
Aims. We investigate the performance of Pegase and FKSI for exozodiacal disc detection and compare the results with ground-based nulling interferometers.
Methods. We used the GENIEsim software (Absil et al. 2006) which was designed and validated to study the performance of ground-based nulling interferometers. The software has been adapted to simulate the performance of space-based nulling interferometers by disabling all atmospheric effects and by thoroughly implementing the perturbations induced by payload vibrations in the ambient space environment.
Results. Despite using relatively small telescopes ( 0.5 m), Pegase and FKSI are very efficient for exozodiacal disc detection. They are capable of detecting exozodiacal discs respectively 5 and 1 time as dense as the solar zodiacal cloud and they outperform any ground-based instrument. Unlike Pegase, FKSI can achieve this sensitivity for most targets of the Darwin/TPF catalogue thanks to an appropriate combination of baseline length and observing wavelength. The sensitivity of Pegase could, however, be significantly boosted by considering a shorter interferometric baseline length.
Conclusions. Besides their main scientific goal (characterising hot giant extrasolar planets), the space-based nulling interferometers Pegase and FKSI will be very efficient in assessing within a few minutes the level of circumstellar dust in the habitable zone around nearby main sequence stars down to the density of the solar zodiacal cloud. These space-based interferometers would be complementary to Antarctica-based instruments in terms of sky coverage and would be ideal instruments for preparing future life-finding space missions.
Key Words.:
Instrumentation: high angular resolution – techniques: interferometric – circumstellar matter1 Introduction

Nulling interferometry is the core technique of future life-finding space missions such as ESA’s Darwin (Fridlund et al. 2006) and NASA’s Terrestrial Planet Finder Interferometer (TPF-I, Beichman et al. 2006a). Observing in the mid-infrared (6-20 m), these missions would enable the spectroscopic characterisation of the atmosphere of habitable extrasolar planets orbiting nearby main sequence stars. This ability to study habitable distant planets strongly depends on the density of exozodiacal dust in the inner part of circumstellar discs, where the planets are supposed to be located. In particular, the detection of habitable terrestrial planets would be seriously hampered for stars presenting warm (300 K) exozodiacal dust more than 10 to 100 times as dense as our solar zodiacal disc, depending on stellar type, stellar distance and telescope diameter (Beichman et al. 2006b; Defrère et al. 2008). Assessing the level of circumstellar dust around nearby main sequence stars is therefore a necessary pre-requisite for preparing the observing programme of Darwin/TPF by reducing the risk of wasting time on sources for which exozodiacal light prevents Earth-like planet detection. In addition, the existence of planets is intrinsically linked to circumstellar discs and observing them provides an efficient way to study the formation, evolution and dynamics of planetary systems. At young ages, essentially all stars are surrounded by protoplanetary discs in which the planetary systems are believed to form (Meyer et al. 2008). In particular, the detection of gaps in these protoplanetary discs is very important for understanding the early dynamics of planets, including migration and orbital interaction. At older ages, photometric surveys primarily with IRAS, ISO, and Spitzer have revealed the presence of micron-sized grains around a large number of main sequence stars (see e.g., Trilling et al. 2008; Hillenbrand et al. 2008). This is interpreted as the sign of planetary activity, as the production of grains is believed (by analogy with the zodiacal cloud in our solar system) to be sustained by asteroid collisions and outgassing of comets in the first tens of astronomical units (AU). However, the presence of warm dust can generally not be unequivocally determined because the typical accuracy on both near-infrared photometric measurements and photospheric flux estimations is a few percent at best, limiting the sensitivity to typically 1000 times the density of our solar zodiacal cloud (Beichman et al. 2006c). Photometric measurements are therefore generally not sufficient to probe the innermost regions of the discs and interferometry is required to separate the starlight from the disc emission. Good examples are given by the detection of hot dust (1500 K) around Vega and Cet with near-infrared interferometry at the CHARA array (Absil et al. 2006b; Di Folco et al. 2007). Nulling interferometry is a quite new technique even though it was initially proposed in 1978 (Bracewell 1978). Several scientific observations using this technique have recently been carried out with the Bracewell Infrared Nulling Cryostat (BLINC, Hinz et al. 2000) instrument at the Multi-Mirror Telescope (MMT, Mont Hopkins, Arizona), with the Keck Interferometer Nuller (KIN, Hawaii, Serabyn et al. 2006; Barry et al. 2008; Serabyn 2008), and are foreseen to begin in 2010 at the Large Binocular Telescope (Mount Graham, Arizona,Hinz et al. 2008). In Europe, ESA has initiated the study of a ground-based demonstrator for Darwin, the Ground-based European Nulling Interferometer Experiment (GENIE, Gondoin et al. 2004). GENIE is a nulling interferometer conceived as a focal instrument for the VLTI which has been studied by ESA at the phase A level. Another European project is ALADDIN (Antarctic L-band Astrophysics Discovery Demonstrator for Interferometric Nulling, Coudé du Foresto et al. 2006), a nulling interferometer project for Dome C, on the high Antarctic plateau. The performance of GENIE has been studied in detail (Absil et al. 2006a,Wallner et al. 2006) and recently compared to that of ALADDIN (Absil et al. 2007). Using 1-m collectors, ALADDIN would have an improved sensitivity with respect to GENIE working on 8-m telescopes, provided that it is placed above the turbulence boundary layer (about 30 m at Dome C). Circumstellar discs 30 times as dense as our local zodiacal cloud could be detected by ALADDIN around typical Darwin/TPF targets in an integration time of few hours.
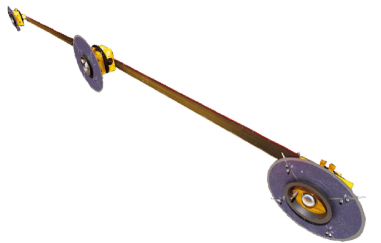
The low atmospheric turbulence on the high Antarctic plateau is a significant advantage with respect to other astronomical sites and one of the main reasons for the very good sensitivity of ALADDIN. However, as for any other ground-based site, the atmosphere effects (turbulence and thermal background) are still major limitations to the performance and active compensation by real-time control systems are mandatory. Observing from space would provide an efficient solution to improve the sensitivity by getting rid of the harmful effect of the atmosphere. Two infrared nulling interferometers could achieve the detection of circumstellar dust discs from space (see Fig. 1): Pegase, a two-telescope interferometer based on three free-flying spacecraft (Le Duigou et al. 2006) and the Fourier-Kelvin Stellar interferometer (FKSI), a structurally-connected interferometer also composed of two telescopes (Danchi et al. 2006). These two missions have been initially designed to study hot extrasolar giant planets at high angular resolution in the near- to mid-infrared regime (respectively 1.5-6.0 m and 3.0-8.0 m). Besides their main scientific goal, they could also be particularly well suited for the detection of warm circumstellar dust in the habitable zone around nearby main sequence stars. The objective would be to provide a statistically significant survey of the amount of exozodiacal light in the habitable zone around the Darwin/TPF targets, and its prevalence as a function of other stellar characteristics (age, spectral type, metallicity, presence of a cold debris disc, etc). Following our performance studies of ground-based instruments such as GENIE at Cerro Paranal (Absil et al. 2006a, hereafter Paper I) or ALADDIN on the high Antarctic plateau (Absil et al. 2007, hereafter Paper II), the present study addresses the performance of space-based nulling instruments for exozodiacal disc detection. We have limited our comparison to instruments working at similar wavelengths (ranging from 2 to 8 m), and purposely discarded ground-based instruments working in the N-band such as the KIN and the LBTI. The ultimate performance of these two mid-infrared instruments essentially depends on the spatial and temporal fluctuations of the sky and instrumental thermal backgrounds, which are very difficult to model with a sufficient accuracy for our comparative study.
2 PEGASE and FKSI overview
Pegase and FKSI are space-based Bracewell interferometers, conceived as scientific and technological precursors to Darwin/TPF. They present similar architectures, the main difference being that the two telescopes of Pegase are free-flying while those of FKSI are arranged on a single boom. Pegase was initially proposed in the framework of the 2004 call for ideas by the French space agency (CNES) for its formation flying demonstrator mission. CNES performed a Phase 0 study in 2005 and concluded that the mission is feasible within an 8 to 9 years development plan (Le Duigou et al. 2006). However, the mission was not selected for budgetary reasons. On the US side, FKSI has been initially studied by the Goddard Space Flight Center in preparation for submission as a Discovery-class mission. Several concepts have been considered and the mission was studied to the phase A level based on the two-telescope design described here.
2.1 Scientific objectives
The main scientific goal of Pegase and FKSI is to perform the spectroscopy of hot extrasolar giant planets (EGP). With a minimum baseline length of 40 m, Pegase could directly survey most hot Jupiter-like planets (M 0.2 MJup) within 150 pc with a good signal-to-noise ratio (SNR) as well as several favourable hot Uranus-type planets (0.04 MJup M 0.2 MJup) with a final SNR ranging between 1 and 6 (Absil 2006). In particular, Pegase will be able to perform spectroscopy on about 15% of the extrasolar planets known so far within 25 pc, including several planets outside the hot regime (further than 0.1 AU from the host star, Defrère et al. 2007). The working method of FKSI is slightly different from that of Pegase. Due to its relatively short baseline length (12.5 m), FKSI uses a two-color method (based on the ratio of measurements at two wavelengths) to account for the fact that the planetary signal is likely to fall partly within the central dark fringe (Danchi et al. 2003). Using this method, an earlier version of FKSI was estimated to be able to detect at least 25 EGPs, obtain low resolution spectra of their atmosphere and make precise determination of their orbital parameters (Barry et al. 2006). This previous version of FKSI presented an 8-m boom, assumed 15 nm rms residual OPD error and considered a sample of 140 known extrasolar planets. With the current version of FKSI, as discussed in this paper (12.5-m boom length and 2-nm rms residual OPD errors), and considering a much larger available sample of known extrasolar planets (250), this value should be of the order of 75-100. Work is in progress to determine how many known extrasolar planets can be detected with FKSI, as well as the possibility of detecting super-Earths.
The detection and characterisation of circumstellar discs are also in the core programmes of these two missions but the performance has not yet been carefully assessed. Pegase and FKSI are expected to be able to provide an accurate estimate of the dust density from the very neighbourhood of the star up to several AUs. They will also help providing maps of the mineralogical composition, with a combination of spectral and spatial information on the discs. Combined with sub-mm observations from the ground providing the gas distribution with a comparable spatial resolution, it will then become possible to study the dust-gas interactions in young systems. Additional programmes on brown dwarfs and active galactic nuclei are also foreseen, but only the primary objective (the study of hot EGPs) drives the design of the instruments.
2.2 The PEGASE instrumental concept
|
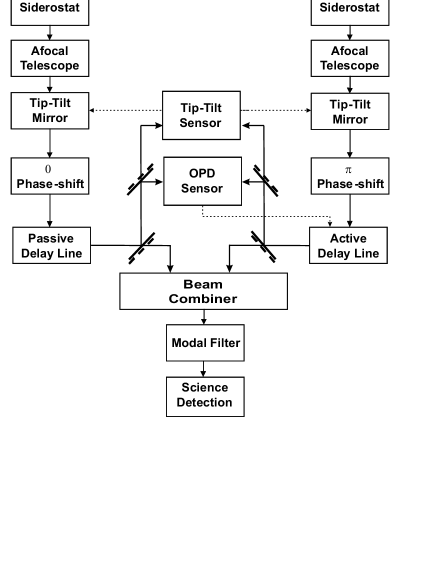
Following the phase 0 study, the baseline configuration of Pegase consists in a two-aperture near-infrared (1.5-6 m) interferometer formed of three free flying spacecraft planned to orbit at the Lagrange point L2, where the spacecraft and the focal plane assembly can be passively cooled down to respectively 90 K and 55 K. In its nominal configuration, Pegase consists in two 40 cm siderostats and a beam combiner flying in linear formation. Visibility measurements and recombination in nulling mode (Bracewell interferometer) are both possible with a spectral resolution of about 60. The interferometric baseline length ranges between 40 m and 500 m giving an angular resolution in the range of 0.5-30 mas. Shorter baseline lengths are not allowed due to the free-flying collision avoidance distance of 20 m. The fine-tuning of the optical path difference (OPD) is performed by a dedicated control loop based on a fringe sensing unit (FSU) using the observed central target in the 0.8-1.5 m range and an optical delay line (ODL). Intensity control is performed by a fine pointing loop using a field relative angle sensor (FRAS) operating in the 0.6-0.8 m range and fast steering mirrors based on piezoelectric devices. The instrumental parameters of Pegase are summarized in Table 1. The optical system architecture is represented by the block diagram in Fig. 2 with the following elements on the optical path:
-
•
Two afocal telescopes with an optical magnification which will result from a trade-off between the dynamics of the tip-tilt errors, the available stroke of the fast steering mirrors, the actuation noise, the mechanical constraints and the polarization limitations. A magnification of the order of 20 is considered in the present design.
-
•
Two fast steering mirrors to correct the tip-tilt errors. They are placed as close as possible to the afocal telescopes in order to minimize the optical path where the tip-tilt errors are not corrected, and hence reduce differential polarisation effects.
-
•
The achromatic phase-shift is achieved geometrically, by means of opposite periscopes producing field reversal by reflections (Serabyn 1999).
-
•
Two optical delay lines placed after the active mirrors to operate in a tip/tilt corrected optical space.
-
•
Dichroic beam splitters which separate the signal between the science wave band and the tip-tilt/OPD sensing wave bands.
-
•
A Modified Mach Zehnder (MMZ, Serabyn & Colavita 2001) to perform beam combination. A second MMZ might be necessary to cover the full wavelength range, depending on the coatings.
-
•
Small off axis parabolas to focus the four outputs of the MMZ into single mode fibres. A fluoride glass fibre can cover the spectral range 1.5-3 m. A chalcogenide fibre is required for the spectral range 3-6 m.
-
•
A detection assembly controlled at a temperature of 55 K and connected to the fibres.
2.3 The FKSI instrumental concept
Resulting from several dedicated studies in the past few years, the FKSI design nowadays consists in two 0.5-m telescopes on a 12.5-m boom. The wavelength band used for science ranges from 3 to 8 m, which gives an angular resolution between about 25 and 66 mas. The instrument is foreseen to be launched to L2 where it will be passively cooled down to 65 K. The field of regard is somewhat smaller than the one of Pegase with possible angles of 20˚ around the anti-solar direction (vs 30˚ for Pegase). This value depends on the size of the sunshields considered in the present design and could eventually be increased. The optical arrangement is similar to that of Pegase and follows the description given in Section 2.2, with some differences explained hereafter (see also Fig. 2). OPD stabilization is performed by a FSU using the observed central target in the 0.8-2.5 m range and feeding an ODL. Unlike Pegase, tip/tilt control is performed in the same wavelength range as the OPD control. After separation from the science signal with dichroic beam splitters, 80% of the light in the 0.8-2.5 m range feeds the FSU and 20% the tip/tilt sensor. One hollow-glass fibre is used as modal filter in the 3.0-8.0 m wavelength range at each of the two destructive outputs of a symmetric Mach Zehnder beam combiner (Barry et al. 2006). The fibres outputs are focused on the science detector, cooled down to a temperature of 35 K. Note that photonic crystal fibres are also considered and are a promising solution for single mode propagation on a wider spectral band. The instrumental parameters of FKSI are listed in Table 1.
3 Nulling performance in space
In order to assess the performance of Pegase and FKSI for exozodiacal disc detection, the GENIE simulation software (GENIEsim, see Paper I) has been used. GENIEsim has originally been designed to simulate the GENIE instrument at the VLTI interferometer and has been extensively validated by cross-checking with performance estimates done by industrial partners during the GENIE phase A study. GENIEsim performs end-to-end simulations of ground-based nulling interferometers, including the simulation of astronomical sources (star, circumstellar disc, planets, background emission), atmospheric turbulence (piston, longitudinal dispersion, wavefront errors, scintillation), as well as a realistic implementation of closed-loop compensation of atmospheric effects by means of fringe tracking and wavefront correction systems. The output of the simulator basically consists in time series of photo-electrons recorded by the detector at the constructive and destructive outputs of the nulling combiner. To enable the simulation of a space-based nulling interferometer, few modifications were necessary due to the versatility of GENIEsim. Beside disabling all atmospheric effects, the main modification was to introduce the random sequences of OPD and tip/tilt generated by the vibrations of the telescopes in the ambient space environment. This is discussed in the following section.
| GENIE-UT | ALADDIN | Pegase | FKSI | Goal | |
| Piston | 6.2 nm @ 13 kHz | 10 nm @ 2 kHz | 1.7 nm @ 60 Hz | 2 nm @ 65 Hz | 4nm |
| Inter-band disp. | 4.4 nm @ 300 Hz | 7.0 nm @ 0 kHz | 0 nm @ 0 kHz | 0 nm @ 0 kHz | 4nm |
| Intra-band disp. | 1.0 nm @ 300 Hz | 7.4 nm @ 0 Hz | 0 nm @ 0 kHz | 0 nm @ 0 kHz | 4nm |
| Tip-tilt | 11 mas @ 1 kHz | 7 mas @ 1 kHz | 15 mas @ 85 Hz | 20 mas @ 60 Hz | (see intensity) |
| Intensity mismatch | 4% @ 1 kHz | 1.2% @ 0 Hz | 0.02% @ 0 kHz | 0.04% @ 0 Hz | 1% |
| Total null | 6.2 10-4 | 2.2 10-4 | 1.0 10-3 | 3.0 10-5 | |
| Instrumental null | 1.5 10-4 | 1.3 10-4 | 1.0 10-5 | 7.0 10-6 | 10-5 |
| RMS null | 2.0 10-6 | 3.5 10-6 | 1.1 10-7 | 6.9 10-8 | 10-5 |
3.1 Vibrations in space environment
Spacecraft vibrations are critical in nulling interferometry because they induce fluctuations in the differential optical paths and pointing errors, which both give rise to stochastic stellar leakage in the destructive output. These vibrations are caused by disturbance forces which can be either internal (due to on-board systems) or external (caused by the ambient space environment). Internal disturbance forces arise mainly from the thrusters, the Optical Delay Line (ODL), the steering mirrors, the reaction wheels and the boom in the case of structurally connected telescopes. The external disturbance forces are mainly caused by particulate impacts, solar radiation pressure and charging effects but all these effects are not expected to be dominant at the L2 point. A recent comparative study concludes that the ambient space environment causes OPD errors no larger than the disturbances induced by on-board equipment for Darwin and its precursor missions (Sterken 2005).
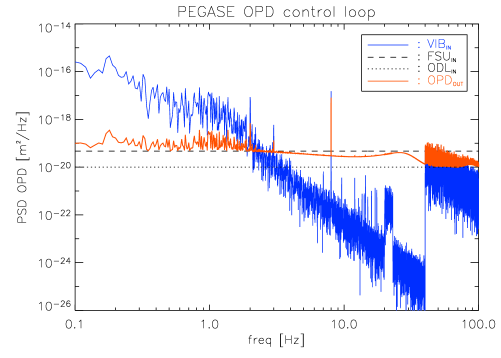
In the case of Pegase, an R&D study carried out by EADS-Astrium in collaboration with CNES (Villien et al. 2007) has identified the two main sources of perturbations: torque noise and micro-vibrations, both at the reaction wheel level. The torque noise corresponds to the perturbations around the wheel rotation axis. It is due to the wheel electronics noise, the wheel controller loop, the friction torque and the motor defect. Micro-vibrations are due to the wheel mechanical defects such as rotor imbalance and ball bearing imperfections. They correspond to harmonic perturbations, function of the wheel velocity and generate both torques and forces disturbances. In the present architecture, the observation is considered to be divided into a succession of 100-s phases of science and control: pulse control phases of 100 s interrupt the science observation during which the constellation is free flying (so that there is no thruster noise during this phase). The Power Spectral Densities (PSD) defined by Astrium and CNES during the R&D study for OPD and tip/tilt have been implemented in GENIEsim. The PSD of the OPD in m2/Hz is represented in Fig. 3 by the solid curve labelled “VIBIN” and defines the vibrational level at the input of the FSU (about 0.18 m rms). This PSD corresponds to a wheel rotation frequency of 1 Hz, with flexible modes at 20 Hz (due to the sunshield) and 40 Hz (due to the platform structure). Increasing the rotation frequency of the wheel could reduce the torque noise but at the expense of micro-vibrations. The shape of the tip/tilt PSD is similar to that of OPD with a value of about rms at the input of the tip/tilt sensor.
For FKSI, the reaction wheels are also expected to be the main contributor to the vibrational level (Hyde et al. 2004). Another contribution comes from boom deflections induced by thermal changes and producing low frequency OPD. The worst case occurs at the boom resonant frequency which results in a sine wave with an amplitude of 2.4 nm at 5 Hz for the OPD perturbation and a sine wave of 0.2 mas at 5 Hz for the tip/tilt perturbation (Tupper Hyde, private communication). Assuming that FKSI will use the same wheels as Pegase, we can in good approximation use the PSD defined for Pegase, to which we add the resonant boom contribution at 5 Hz.
3.2 Control loop performance
As indicated in the previous section, the level of OPD and tip/tilt would be of the order of 0.18 m and rms without appropriate correction techniques. This is prohibitive for exozodiacal disc detection and fine control loops are therefore mandatory to stabilise the OPD and the tip-tilt to acceptable values. In GENIEsim, control loops are simulated through their transfer function in the frequency domain. A simultaneous optimisation is performed on the loop repetition frequency and the controller parameters (a simple PID111PID stands for “Proportional, Integral and Differential” which is a basic controller device for closed-loop control) in order to minimise the residual errors, which are computed by integrating the corrected PSD on the frequency domain. The PSDs of the OPD perturbation before and after fringe tracking are shown in Fig. 3 in the case of Pegase. At the input of the loop, the OPD perturbations come from the wheels (VIBIN), the FSU measurement noise (FSUIN) and the intrinsic ODL noise (ODLIN). The PSD of the FSU noise is computed by considering a standard ABCD algorithm to estimate the phase of the fringe and assuming a read-out noise of 15 electrons rms per pixel. For the ODL, a white PSD of 1 nm rms over a 100 Hz bandpass has been assumed, as suggested by industrial studies (Van Den Tool 2006). The output OPD PSD indicates the total residue after correction by the FSU, limited at low frequencies (below 2 Hz) by the non-perfect control of the input perturbations, by the noise of the FSU between 2 and 30 Hz and by the ODL noise beyond 30 Hz. The tip/tilt control loop is treated in a similar way, assuming a noise of 10 mas/ per tip-tilt mirror. The same assumptions have been considered for FKSI.
The optimised control loop performances are displayed in Table 2 for the GENIE instrument working on the 8-m Unit Telescopes (UT) at the VLTI (results taken from Paper I), the ALADDIN instrument working on 1-m telescopes at Dome C (results taken from Paper II), and the space-based instruments as presented in this paper. The observations are carried out for a Sun-like G2V star located at 20 pc on a 100 sec observation sequence using either the 47-m UT2-UT3 baseline at the VLTI (waveband: 3.5-4.1 m), a baseline length of 20 m for ALADDIN (waveband: 3.1-4.1 m), a 40-m baseline length for Pegase (waveband: 1.5-6.0 m) and the 12.5-m baseline for FKSI (waveband: 3.0-8.0 m). As in the case of ALADDIN, dispersion and intensity errors are expected to be very low in space and the corresponding control loops have been disabled in GENIEsim for simulating Pegase and FKSI. This is indicated by a 0 Hz control loop frequency in Table 2. Fringe tracking can be carried out at much lower frequencies than for ground-based instruments (about 60 Hz instead of 2 kHz) and the residual OPD errors are much lower with a typical stability of about 2 nm rms. Pointing errors can also be controlled at lower frequencies ( 100 Hz instead of 1 kHz), but the residual tip/tilt is somewhat larger. Globally, the instrumental nulling performance is better by at least a factor 10 with respect to GENIE and ALADDIN because OPD errors remain the dominant perturbations. Taking into account geometric stellar leakage, the overall nulling performance of Pegase is only about due to the combined effect of the larger baseline length and the extension of the wavelength range towards shorter wavelengths. Relaxing the collision avoidance requirements of 20 m or flying in triangular formation would enable shorter interferometric baseline lengths and would therefore improve the overall nulling performance of Pegase (the geometric null is proportional to the baseline length to the square). Another way to improve the overall nulling performance while keeping the linear configuration is to discard the short wavelengths. This is discussed in more details in Section 4. With its 12.5-m baseline length and a wavelength range of [3-8] m, the total null of FKSI is about 3.0 10-5. Note that the results presented for GENIE and ALADDIN assume the “best case scenario”, which takes into account pupil averaging, a physical phenomenon reducing the power spectral density of piston and dispersion at high frequencies (see paper I for more details).
4 Simulated performance
4.1 Coupling efficiency
The coupling efficiency represents the fraction of incoming light from a point-like source which is transmitted into an optical fibre. It depends on the core radius of the fibre, its numerical aperture, the wavelength, the diameter of the telescope and its focal length (Ruilier & Cassaing 2001). In order to have an efficient correction of wave-front defects, the core radius of the fibres is chosen so as to ensure single-mode propagation over the whole wavelength range. The focal length can then be optimised to give the maximum coupling efficiency at a chosen wavelength and more importantly, to provide a roughly uniformly high coupling efficiency across the whole wavelength band. This is generally achieved by optimising the coupling efficiency in the middle of the wavelength range. However, for fibres covering a wide wavelength range, this procedure can lead to a significant degradation of the coupling efficiency at long wavelengths (where the instruments are most sensitive, see Section 4.2). For instance, the coupling efficiency of FKSI would be below 50% in the [7-8] m band. For Pegase, the use of two fibres partly solves this issue but the coupling efficiency can be further improved. Optimising the coupling efficiency at wavelengths of 4.5 m for Pegase and 6 m for FKSI is particularly convenient to maximize the coupling efficiency at long wavelengths while keeping a high level at short wavelengths (see Fig. 4). In both cases, the coupling efficiency remains around its maximum (about 80%) over almost the whole wavelength band of each fibre and decreases to a minimum of about 70% at the longest wavelengths. With these assumptions, we obtained optimised focal lengths of 1.1 m and 1.4 m respectively for Pegase and FKSI. Note that in the case of Pegase, we will discard in the following study the wavelength range corresponding to the first fibre (1.5-3.0 m), which is not well suited for exozodiacal disc detection.
4.2 Signal-to-noise ratio analysis
In this section, we present the different sources of noise simulated by GENIEsim and the level at which they contribute to the final SNR in the case of a Sun-like star located at 20 pc. Each source of noise is given on output of GENIEsim in photo-electrons detected per spectral channel. Considering an integration time of 30 min, the detailed noise budget in the highest-SNR spectral channel is given in Table 3 for Pegase and FKSI (first column). The listed sources of signal and noise are briefly discussed hereafter.

| Pegase | FKSI | |||||
| Wavelength [m] | 5.96 | [5.7-6.0] | [3.0-6.0] | 7.83 | [6.3-8.0] | [3.0-8.0] |
| Bandwidth [m] | 0.08 | 0.3 | 3.0 | 0.34 | 1.7 | 5.0 |
| Stellar signal [e-] | 1.5 | 6.6 | 1.8 | 5.0 | 3.5 | 3.0 |
| Raw instr. leakage [e-] | 8.3 | 3.6 | 1.2 | 2.7 | 1.9 | 2.1 |
| Total stellar leakage [e-] | 2.2 | 1.0 | 6.1 | 6.6 | 5.4 | 1.1 |
| 20-zodi signal [e-] | 1.0 | 4.1 | 4.9 | 2.7 | 1.4 | 2.9 |
| Background signal [e-] | 2.8 | 7.3 | 9.7 | 1.8 | 2.5 | 2.5 |
| Calibrated geom. leakage [e-] | 4.3 | 1.9 | 1.2 | 8.0 | 7.0 | 1.8 |
| Calibrated instr. leakage [e-] | 7.2 | 2.3 | 4.4 | 1.3 | 1.9 | |
| Instability noise [e-] | 1.0 | 4.3 | 1.8 | 1.4 | 1.2 | 1.9 |
| Shot noise [e-] | 4.7 | 1.0 | 7.8 | 2.6 | 7.3 | 3.4 |
| Detector noise [e-] | 1.8 | 3.6 | 1.1 | 1.8 | 4.0 | 8.0 |
| Background noise [e-] | 2.7 | 4.6 | 1.4 | 3.0 | 6.3 | 1.8 |
| Zodis for SNR=5 (calibrated) | 10 | 7.8 | 34 | 2.2 | 1.3 | 9.2 |
-
•
The stellar signal represents the total number of photo-electrons detected in both constructive and destructive outputs.
-
•
The raw instrumental leakage accounts for the stellar photons collected at the destructive output due to the influence of instrumental imperfections such as co-phasing errors, wavefront errors or mismatches in the intensities of the beams.
-
•
The 20-zodi signal is the amount of photo-electrons at the destructive output that come from the circumstellar disc, assumed to be face-on and to follow the same model as in the solar system (Kelsall et al. 1998), except for a global density factor of 20.
-
•
The background signal takes into account the instrumental brightness and the emission of the local zodiacal cloud. In the absence of atmosphere, the latter becomes the main background contributor and overwhelms the instrumental brightness by a factor 1000 at 3.5 m or 250 at 5.5 m respectively for Pegase and FKSI.
-
•
The geometric stellar leakage accounts for the imperfect rejection of the stellar photons due to the finite size of the star. Thanks to the analytical expression of the rejection rate (see Paper I), it can be calibrated. Here, we assume a typical precision () of 1% on stellar angular diameters so that a calibration accuracy of 2% is reached on geometric stellar leakage.
-
•
The raw instrumental leakage can be decomposed into its mean value and its variability, referred to as “instability noise” (Lay 2004; Chazelas et al. 2006). The mean value can be estimated by observing a calibrator star, provided that the interferometer behaves in the same way during both science observation and calibration. This calibration process is obviously limited by its own geometrical stellar leakage, instability noise, shot noise, detector noise and background noise. Therefore, calibrating the mean instrumental leakage is not necessarily useful for the improvement of the sensitivity. The absence of calibration is indicated by a dash sign in Table 3.
-
•
Shot noise is due to the statistical arrival process of the photons from all sources. It is mainly dominated by stellar leakage and by the emission of the solar zodiacal cloud.
-
•
Detector noise is computed assuming a read-out noise of 15 electrons rms and a typical read-out frequency of 0.01 Hz.
-
•
The background noise stands for the residual background signal in the calibration process. Two off-axis fibres located close to the “science” fibre in the focal plane are used to measure the background emission in real time. Using this technique, the background noise is reduced to the sum of the shot noise contribution from the background itself and of the stellar light coupled into the “background” fibres. Considering fibres located at 40″from the axis and telescopes with a central obscuration of 14%, the residual stellar light in the background fibres does not exceed about 10-5 of the total stellar flux. More details about this technique can be found in Absil (2006).
The single channel SNR can be improved by adding the signals from different spectral channels, taking into account the possible correlation of the noises between the wavelength bins. In this study, we assume that systematic noises such as geometrical leakage, instrumental leakage and instability noise are perfectly correlated between the wavelength bins so that the noise contributions have to be added linearly. On the other hand, random noises such as shot noise, detector noise and background noise are considered uncorrelated between the spectral channels and are thus added quadratically. Combining spectral channels is efficient to a limited extent and wide band observations give generally poor results. This is illustrated in Table 3 which details the noise budget in the optimum wavelength range (second column) and in the whole wavelength range (third column).
For both Pegase and FKSI, the highest-SNR wavelength bin corresponds to the longest wavelength of the science waveband with an achievable sensitivity of respectively 10 and 2.2 zodis for a Sun-like star located at 20 pc. This sensitivity is slightly improved by combining the spectral channels in the [5.7-6.0] m and [6.3-8.0] m bands respectively for Pegase and FKSI. Wider wavelength ranges would degrade the sensitivity as illustrated by the whole band sensitivity (respectively 34 and 9.2 zodis). This is because the part of the SNR that is due to systematic noises is not improved by combining spectral channels and both Pegase and FKSI are largely dominated by geometric stellar leakage at short wavelengths. As a side effect, the calibration of instrumental leakage, which is very efficient for ground-based instruments (see Papers I and II), would impair the performance of Pegase for observations performed in the whole wavelength range. In the optimum wavelength range of Pegase, calibrating the instrumental leakage has only a slight influence on the final sensitivity and the geometric stellar leakage remains the dominant noise contributor, indicating that Pegase would present a better sensitivity with a shorter-baseline configuration (for instance with the three spacecraft flying in triangular formation). For FKSI, geometric stellar leakage is less problematic due to the shorter baseline length but remains one of the main noise contributors. In the optimum wavelength range, the sensitivity of FKSI is also dominated by shot noise in this particular case (a Sun-like star located at 20 pc). In the next section, we will see however that geometric stellar leakage is generally dominant for brighter targets.
4.3 Estimated sensitivity
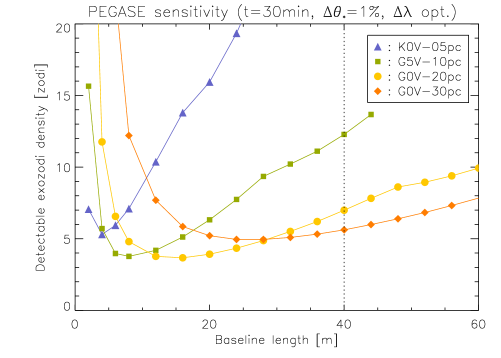
Following the method used for the GENIE and ALADDIN studies (see Papers I and II), the performances of Pegase and FKSI are presented for 4 hypothetic targets representative of the Darwin/TPF catalogue (Kaltenegger et al. 2007): a K0V star located at 5 pc, a G5V located at 10 pc, a G0V located at 20 pc and a G0V located at 30 pc. The results of the simulations are presented in Table 4, taking into account the calibration procedures (i.e., background subtraction, geometric leakage calibration and instrumental leakage calibration) when necessary. The detection threshold is set at a global SNR of 5 in the optimised wavelength range. Unless specified otherwise, the integration time has been fixed to 30 min and the accuracy on the stellar angular diameters to 1%.
FKSI is the most sensitive instrument and can detect circumstellar discs with a density down to the level of the solar zodiacal cloud. For the four representative targets of the Darwin/TPF catalogue, FKSI can detect discs of 2.6, 1.0, 0.9 and 1.8 zodis compared to 40, 12, 7.0 and 5.5 zodis for Pegase (see Table 4). For both instruments, geometric stellar leakage is the dominant noise in all cases, except for the G0V star located at 30 pc for which FKSI is dominated by the shot and background noises. This explains why the sensitivity decreases for the closest targets, which have a larger angular stellar diameter and therefore produce more geometric stellar leakage for a given baseline length. This also explains why the optimum wavelength range is wider for the distant targets, for which combining the spectral channels is more efficient due to the higher relative contribution of shot noise to the final SNR. Note also that, for the same reason, the optimum wavelength range for a given star is always wider for FKSI than for Pegase.
The main difference between FKSI and Pegase is related to the geometric stellar leakage which is much larger in the case of Pegase due to its 40-m baseline length. Considering the same baseline length for both instruments, the sensitivity of FKSI would however remain better than that of Pegase due to the longer observing wavelength and the lower thermal background. Indeed, observing at longer wavelengths improves the geometric stellar rejection which is proportional to the squared wavelength. For instance, with a hypothetic baseline length of 12.5 m, Pegase could detect circumstellar discs of 10, 4.2, 3.8 and 7.7 zodis compared to 2.6, 1.0, 0.9 and 1.8 zodis for FKSI (see Table 4). The feasibility of such a flight configuration is however beyond the scope of this paper and will not be addressed.
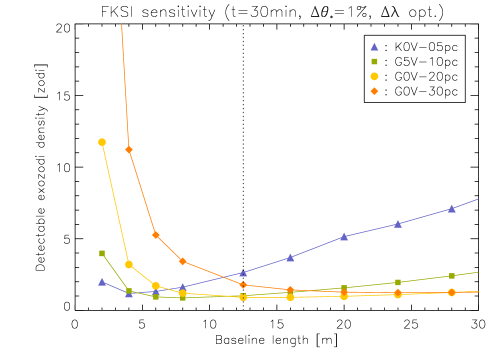
The estimated sensitivity is represented as a function of baseline length in Fig. 5 for Pegase and in Fig. 6 for FKSI, where the wavelength range is optimised separately for each baseline length. As already suggested, the sensitivity at long baseline lengths is dominated by geometric stellar leakage, especially for the closest targets which have a larger stellar angular diameter. By reducing the baseline length, the starlight rejection improves and the sensitivity curves decrease towards a minimum, indicating the optimum baseline length. It is interesting to note that the 12.5-m interferometric baseline of FKSI is a good compromise for most stars in the Darwin/TPF catalogue. The decrease in performance towards longer baselines lengths is stronger for Pegase than for FKSI since it observes at shorter wavelengths. At short baseline lengths, background noise becomes dominant due to the decrease of the exozodiacal disc transmission and the sensitivity curves rise again. The slight inflection in the sensitivity curves of Fig. 5 (e.g., at a baseline length of 15 m for the K0V star) indicates the baseline lengths at which the instrumental leakage calibration becomes useless and would not improve the sensitivity. The difference in sensitivity between Pegase and FKSI decreases with the target distance since the optimum baseline length of Pegase is getting closer to 40 m.
| Pegase - 12.5 m | Pegase - 40 m | FKSI | |||||||||||||||||||||||||||||
|---|---|---|---|---|---|---|---|---|---|---|---|---|---|---|---|---|---|---|---|---|---|---|---|---|---|---|---|---|---|---|---|
|
|
|
|
||||||||||||||||||||||||||||
|
|
|
|
5 Discussion
5.1 Comparison with ground-based sites
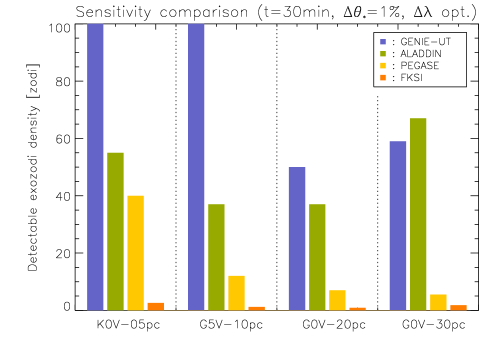
In order to provide a fair comparison between ground- and space-based nulling interferometers, we use the performance estimations of GENIE and ALADDIN obtained with GENIEsim for the 4 representative targets of the Darwin/TPF catalogue (from Papers I and II). The detectable exozodiacal dust densities for GENIE on the unit telescopes (UT - 8 m diameter), ALADDIN, Pegase and FKSI are represented in Fig. 7, considering an integration time of 30 min and an uncertainty on the stellar angular diameters of 1%. For all target stars, the space-based nulling interferometers are the most sensitive instruments. Pegase (resp. FKSI) outperforms ALADDIN by a factor ranging from about 1.5 (resp. 20) for the K0V star located at 5 pc to a factor of about 10 (resp. 30) for the G0V star located at 30 pc. This better sensitivity of space-based instruments is mainly due to the lower thermal background and geometric stellar leakage, which are the dominant noises for GENIE and ALADDIN. While the absence of atmosphere in space and the cooler optics explain the lower thermal background, the longer observing wavelength improves the geometric stellar rejection, which is proportional to the squared wavelength.
As discussed in the previous sections, Pegase and FKSI are generally limited by geometric stellar leakage. Reducing the baseline length to improve the sensitivity is not possible either due to the free-flying constraints for Pegase or due to the fixed boom on FKSI. Besides reducing the interferometric baseline length, another way to minimize the geometric stellar leakage is to improve the knowledge on stellar angular diameters. Considering the four targets representative of the Darwin/TPF catalogue, Table 5 gives the sensitivity to exozodiacal discs of Pegase and FKSI for different uncertainties on the stellar angular diameter. The results of GENIE on the unit telescopes (UT - 8 m diameter) and ALADDIN are also presented for comparison. Unlike the other instruments, FKSI is relatively insensitive to the uncertainty on the stellar angular diameter, with a sensitivity below 4 zodis even for a knowledge of the stellar angular diameter of 1.5%.
| Star | 0.25% | 0.5% | 1% | 1.5% | Instrument |
| 110 | 230 | 450 | 680 | GENIE - UT | |
| K0V - 05pc | 20 | 33 | 55 | 79 | ALADDIN |
| 12 | 21 | 40 | 60 | PEGASE | |
| 0.9 | 1.4 | 2.6 | 3.9 | FKSI | |
| 30 | 59 | 120 | 180 | GENIE - UT | |
| G5V - 10pc | 15 | 24 | 37 | 51 | ALADDIN |
| 4.7 | 8.3 | 12 | 17 | PEGASE | |
| 0.5 | 0.7 | 1.0 | 1.4 | FKSI | |
| 21 | 29 | 50 | 73 | GENIE - UT | |
| G0V - 20pc | 19 | 25 | 37 | 48 | ALADDIN |
| 2.8 | 4.2 | 7.0 | 9.5 | PEGASE | |
| 0.7 | 0.8 | 0.9 | 1.1 | FKSI | |
| 36 | 46 | 59 | 71 | GENIE - UT | |
| G0V - 30pc | 62 | 63 | 67 | 72 | ALADDIN |
| 3.1 | 3.9 | 5.5 | 7.3 | PEGASE | |
| 1.7 | 1.7 | 1.8 | 1.9 | FKSI |
5.2 Influence of integration time
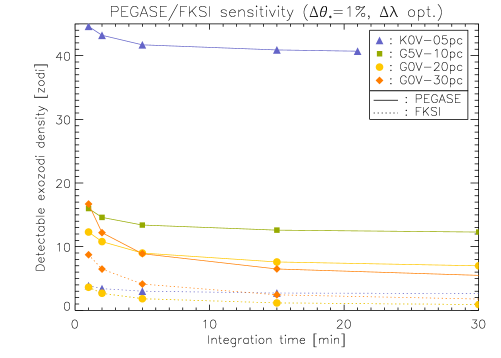
Increasing the integration time has different influences on the individual noise sources. For instance, shot noise, detector noise and instability noise (to the first order) have the classical t1/2 dependance and their relative impact on the final SNR decreases for longer integration times. On the other hand, the imperfect calibration of geometric and instrumental stellar leakage is proportional to time, so that increasing the integration time has no influence on the associated SNR. Since geometric stellar leakage is generally dominant, increasing the integration time does not improve significantly the sensitivity to exozodiacal discs. The sensitivity as a function of the integration time is represented in Fig. 8, using the optimum wavelength range. With a 40-m baseline length, Pegase is dominated by geometric stellar leakage for the four targets and reducing the integration time to five minutes has almost no influence. For FKSI, geometric stellar leakage is not dominant for the G0V star located at 30 pc and increasing the integration time improves slightly the sensitivity (1.4-zodi disc detectable in 60 minutes instead of 1.8-zodi disc in 30 min). For the other three targets, geometric stellar leakage is dominant and integration times longer than 30 minutes have no significative influence on the sensitivity. Like Pegase, an integration time of five minutes is already sufficient to reach the maximum sensitivity for most targets. For comparison, ALADDIN could reach a sensitivity of 30 zodis after about 8 hours of integration time for G0V stars located between 20 and 30 pc (see Paper II). Due to the low thermal background, Pegase and FKSI achieve their maximum sensitivity much faster than ground-based nulling instruments.
5.3 Influence of telescope diameter
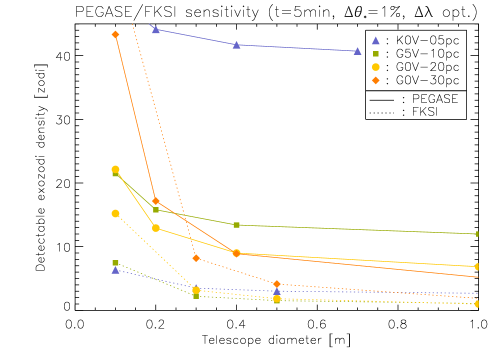
Similarly to integration time, increasing the telescope diameter has different influences on the individual noise sources. Since the geometric nulling ratio does not depend on the aperture size, the component of the SNR which is due to geometric stellar leakage is not improved by increasing the telescope diameter. Since the geometric stellar leakage is generally dominant for an integration time of 30 min, different pupil sizes have therefore little influence on the final sensitivity. In order to clearly show the impact of different pupil sizes, we consider in this section an integration time of 5 min which is generally sufficient to reach the maximum sensitivity (see previous section). Considering an uncertainty on the stellar angular diameter of 1% and 5 min of integration time, the sensitivities of Pegase (solid lines) and FKSI (dashed lines) for different pupil diameters are presented in Fig. 9. As expected, the sensitivity varies more significantly for the faintest targets, which are more dominated by shot noise. For Pegase, the sensitivity is already close to the maximum with the 40-cm diameter apertures and increasing the telescope diameter has only a slight impact for the faintest target (G0V star located at 30 pc). For FKSI, the sensitivity remains practically unchanged for telescopes with a diameter larger than 30 cm, except for the G0V star located at 30 pc. In practice, the final choice of the pupil diameter will result from a trade-off between integration time, feasibility and performance.
5.4 Sky coverage
In the context of Darwin/TPF preparatory activities, another relevant issue is the sky coverage, i.e., the part of the celestial sphere accessible by each instrument. A representative way to assess the sky coverage is to determine how many stars of the Darwin/TPF all sky target catalogue (Kaltenegger et al. 2007) can be observed by each instrument. This value depends on the combination of two parameters: the location of the instrument and its pointing direction ability. For the ground-based instruments, we assume that the zenith distance can not be larger than 60˚. For space-based instruments, the pointing direction covers the part of the sky with an ecliptic latitude between 30˚ for Pegase and 20˚ for FKSI (after 1 year of observation).
Considering the 1354 single target stars of the Darwin/TPF catalogue (106 F, 251 G, 497 K and 500 M stars), the results are presented in Fig. 10 for GENIE (dark frame), ALADDIN (light frame) and Pegase (shaded area). The sky coverage of FKSI is not represented for the sake of clarity but is similar to that of Pegase with an extension in declination of 40˚ instead of 60˚. The stars enclosed in a specified frame are observable by the corresponding instrument in a 1-year observation window. Counting the stars in each frame, GENIE can observed 1069 targets (90 F, 191 G, 405 K, 383 M stars), ALADDIN 514 (52 F, 98 G, 204 K, 160 M stars), Pegase 677 (53 F, 125 G, 244 K and 255 M stars) and FKSI 443 (28 F, 74 G, 164 K and 177 M stars). These values correspond to about 80%, 40%, 50% and 30% of the targets, respectively for GENIE, ALADDIN, Pegase and FKSI. Note that ALADDIN and the space-based instruments cover complementary regions of the sky and are able to survey most of the targets with a declination lower than 50˚.
6 Conclusions
Nulling interferometry is a promising technique to assess the level of circumstellar dust in the habitable zone around nearby main sequence stars. From the ground, instruments like GENIE (VLTI nuller, using two 8-m telescopes) and ALADDIN (Antarctic nuller, using two dedicated 1-m telescopes) could achieve the detection of exozodiacal discs with a density of several tens of zodis. The high Antarctic plateau is a particularly well suited site in that context, so that ALADDIN is expected to achieve the best sensitivity (down to 30 zodis in few hours of integration time). Observing from space provides the solution to go beyond this sensitivity by getting rid of the high thermal background constraining ground-based observations. In this paper, we have investigated the performance of two space-based nulling interferometers which have been intensively studied during the past few years (namely Pegase and FKSI). Even though they have been initially designed for the characterisation of hot extrasolar giant planets, Pegase and FKSI would be very efficient to probe the inner region of circumstellar discs where terrestrial habitable planets are supposed to be located. Within a few minutes, Pegase (resp. FKSI) could detect exozodiacal discs around nearby main sequence stars down to a density level of 5 (resp. 1) times our solar zodiacal cloud and thereby outperform any ground-based instrument. FKSI can achieve this sensitivity for most targets of the Darwin/TPF catalogue while Pegase becomes less sensitive for the closest targets with detectable density levels of about 40 times the solar zodiacal cloud. This outstanding and uniform sensitivity of FKSI over the Darwin/TPF catalogue is a direct consequence of the short baseline length (12.5 m) used in combination with an appropriate observing wavelength of about 8 m, which is ideal for exozodiacal disc detection. Another advantage of FKSI is to be relatively insensitive to the uncertainty on stellar angular diameters, which is a crucial parameter driving the performance of other nulling interferometers. In terms of sky coverage, we show that these space-based instruments are able to survey about 50% of the Darwin/TPF target stars. The sky coverage reaches 80% if they are used in combination with ALADDIN, which provides a complementary sky coverage. Beyond the technical demonstration of nulling interferometry in space, the present study indicates that Pegase and FKSI would be ideal instruments to prepare future life-finding space missions such as Darwin/TPF.

Acknowledgements.
The authors are grateful to Lisa Kaltenegger (Harvard-Smithsonian Center for Astrophysics) for providing the updated Darwin catalogue, Jean Surdej (IAGL), Arnaud Magette (IAGL), Pierre Riaud (Paris observatory), Tupper Hyde (NASA/GSFC), Pierre-Yves Guidotti (CNES) and Julien Morand (EADS-Astrium) for their support and contribution. The authors also thank Richard Barry for a careful reading of the manuscript. The first author acknowledges the support of the Belgian National Science Foundation (“FRIA”). O.A. acknowledges the financial support from the European Commission’s Sixth Framework Program as a Marie Curie Intra-European Fellow (EIF).References
- Absil (2006) Absil, O. 2006, PhD thesis, Liège University, Liège, Belgium
- Absil et al. (2007) Absil, O., Coudé Du Foresto, V., Barillot, M., & Swain, M. R. 2007, A&A, 475, 1185 (Paper II)
- Absil et al. (2006a) Absil, O., den Hartog, R., Gondoin, P., et al. 2006a, A&A, 448, 787 (Paper I)
- Absil et al. (2006b) Absil, O., di Folco, E., Mérand, A., et al. 2006b, A&A, 452, 237
- Barry et al. (2006) Barry, R. K., Danchi, W. C., Deming, L. D., et al. 2006, in Proc. of the SPIE, Vol. 6265
- Barry et al. (2008) Barry, R. K., Danchi, W. C., Traub, W. A., et al. 2008, ApJ, 677, 1253
- Beichman et al. (2006a) Beichman, C., Lawson, P., Lay, O., et al. 2006a, in Proc. SPIE, Vol. 6268
- Beichman et al. (2006b) Beichman, C. A., Bryden, G., Stapelfeldt, K. R., et al. 2006b, ApJ, 652, 1674
- Beichman et al. (2006c) Beichman, C. A., Tanner, A., Bryden, G., et al. 2006c, ApJ, 639, 1166
- Bracewell (1978) Bracewell, R. N. 1978, Nature, 274, 780
- Chazelas et al. (2006) Chazelas, B., Brachet, F., Bordé, P., et al. 2006, Appl. Opt., 45, 984
- Coudé du Foresto et al. (2006) Coudé du Foresto, V., Absil, O., Swain, M., Vakili, F., & Barillot, M. 2006, in Proc. SPIE, Vol. 6268
- Danchi et al. (2006) Danchi, W. C., Barry, R. K., Deming, D., et al. 2006, in Proc. SPIE, Vol. 6268
- Danchi et al. (2003) Danchi, W. C., Deming, D., Kuchner, M. J., & Seager, S. 2003, ApJ, 597, L57
- Defrère et al. (2007) Defrère, D., Absil, O., Hanot, C., & Fridlund, M. 2007, in Proc. SPIE, Vol. 6693, 53–+
- Defrère et al. (2008) Defrère, D., Lay, O., den Hartog, R., & Absil, O. 2008, in Proc. SPIE, Vol. 7013, in press
- Di Folco et al. (2007) Di Folco, E., Absil, O., Augereau, J.-C., et al. 2007, A&A, 475, 243
- Fridlund et al. (2006) Fridlund, C. V. M., d’Arcio, L., den Hartog, R., & Karlsson, A. 2006, in Proc. SPIE, Vol. 6268
- Gondoin et al. (2004) Gondoin, P. A., Absil, O., den Hartog, R. H., et al. 2004, in Proc. SPIE, ed. W. A. Traub, Vol. 5491, 775–+
- Hillenbrand et al. (2008) Hillenbrand, L. A., Carpenter, J. M., Kim, J. S., et al. 2008, ApJ, 677, 630
- Hinz et al. (2000) Hinz, P. M., Angel, J. R. P., Woolf, N. J., Hoffmann, W. F., & McCarthy, D. W. 2000, in Proc. SPIE, ed. P. J. Lena & A. Quirrenbach, Vol. 4006, 349–353
- Hinz et al. (2008) Hinz, P. M., Angel, J. R. P., Woolf, N. J., Hoffmann, W. F., & McCarthy, D. W. 2008, in Proc. SPIE, ed. P. J. Lena & A. Quirrenbach, Vol. 7013, in press
- Hyde et al. (2004) Hyde, T. T., Liu, K.-C., Blaurock, C., et al. 2004, in Proc. SPIE, ed. S. C. Craig & M. J. Cullum, Vol. 5497, 553–564
- Kaltenegger et al. (2007) Kaltenegger, L., Eiroa, C., & Fridlund, M. 2007, A&A, submitted
- Kelsall et al. (1998) Kelsall, T., Weiland, J. L., Franz, B. A., et al. 1998, ApJ, 508, 44
- Lay (2004) Lay, O. P. 2004, Appl. Opt., 43, 6100
- Le Duigou et al. (2006) Le Duigou, J. M., Ollivier, M., Léger, A., et al. 2006, in Proc. SPIE, Vol. 6265
- Meyer et al. (2008) Meyer, M. R., Carpenter, J. M., Mamajek, E. E., et al. 2008, ApJ, 673, L181
- Ruilier & Cassaing (2001) Ruilier, C. & Cassaing, F. 2001, Journal of the Optical Society of America A, 18, 143
- Serabyn (1999) Serabyn, E. 1999, Appl. Opt., 38, 4213
- Serabyn (2008) Serabyn, E. 2008, in Proc. SPIE, Vol. 7013
- Serabyn et al. (2006) Serabyn, E., Booth, A., Colavita, M. M., et al. 2006, in Proc. SPIE, Vol. 6268
- Serabyn & Colavita (2001) Serabyn, E. & Colavita, M. M. 2001, Appl. Opt., 40, 1668
- Sterken (2005) Sterken, V. 2005, Master’s thesis, Delft University of Technology
- Trilling et al. (2008) Trilling, D. E., Bryden, G., Beichman, C. A., et al. 2008, ApJ, 674, 1086
- Van Den Tool (2006) Van Den Tool, T. 2006, in Proc. ICSO 2006 conference (Noordwijk)
- Villien et al. (2007) Villien, A., Morand, J., Delpech, M., & Guidotti, P. 2007, in 17th IFAC Symposium on Automatic Control in Aerospace
- Wallner et al. (2006) Wallner, O., Flatscher, R., & Ergenzinger, K. 2006, Appl. Opt., 45, 4404