Formation of a Quasar Host Galaxy through a Wet Merger
1.4 Billion
Years after the Big Bang
Abstract
We present high-resolution Very Large Array imaging of the molecular gas in the host galaxy of the high redshift quasar BRI 1335–0417 (). Our CO(=21) observations have a linear resolution of 0.15′′ (1.0 kpc) and resolve the molecular gas emission both spatially and in velocity. The molecular gas in BRI 1335–0417 is extended on scales of 5 kpc, and shows a complex structure. At least three distinct components encompassing about two thirds of the total molecular mass of 9.21010 are identified in velocity space, which are embedded in a structure that harbors about one third of the total molecular mass in the system. The brightest CO(=21) line emission region has a peak brightness temperature of 619 K within 1 kpc diameter, which is comparable to the kinetic gas temperature as predicted from the CO line excitation. This is also comparable to the gas temperatures found in the central regions of nearby ultra-luminous infrared galaxies, which are however much more compact than 1 kpc. The spatial and velocity structure of the molecular reservoir in BRI 1335–0417 is inconsistent with a simple gravitationally bound disk, but resembles a merging system. Our observations are consistent with a major, gas-rich (‘wet’) merger that both feeds an accreting supermassive black hole (causing the bright quasar activity), and fuels a massive starburst that builds up the stellar bulge in this galaxy. Our study of this 4 quasar host galaxy may thus be the most direct observational evidence that ‘wet’ mergers at high redshift are related to AGN activity.
Subject headings:
galaxies: active — galaxies: starburst — galaxies: formation — galaxies: high-redshift — cosmology: observations — radio lines: galaxies1. Introduction
Great progress has been made in recent years both observationally and theoretically to further our understanding of galaxy formation and evolution from the early epochs of galaxy formation to the present-day universe. One basic prediction of cosmological simulations is that during the early epoch of hierarchical galaxy formation, some of the most massive galaxies are already formed in major merger events (e.g., Springel et al. 2005). These mergers are believed to commonly trigger both AGN and starburst activity in such early systems, which is regulated via AGN feedback (e.g., Hopkins et al. 2005). Such feedback may be responsible for the present-day “–” relation between black hole mass and bulge velocity dispersion (Ferrarese & Merritt 2000; Gebhardt et al. 2000).
Studies of molecular gas (the requisite material to fuel star formation) in young galaxies are an essential ingredient to understand their physical properties in more detail. Molecular gas (typically CO) has been detected in 50 galaxies at 1 to date, revealing large molecular reservoirs of 1010 in most cases (see Solomon & Vanden Bout 2005 for a review). However, these studies rely almost exclusively on the integrated properties of the line emission, as the molecular reservoirs in these distant galaxies are difficult to resolve. To date, only the =4.69 and =6.42 quasars BR 1202–0725 and SDSS J1148+5251, two of the most distant gas-rich galaxies could be resolved in molecular gas emission without the aid of gravitational magnification (Omont et al. 1996; Carilli et al. 2002; Walter et al. 2004).
In this letter, we report on high angular resolution (0.15′′; 1.0 kpc) Very Large Array (VLA)111The Very Large Array is a facility of the National Radio Astronomy Observatory, operated by Associated Universities, Inc., under a cooperative agreement with the National Science Foundation. observations of molecular gas in the host galaxy of BRI 1335–0417, a dust-rich, optically identified quasar at a redshift of 4.41, corresponding to only 1.4 Gyr after the Big Bang. Optical imaging with the Hubble Space Telescope reveals a single point source without any evidence for gravitational lensing (Storrie-Lombardi et al. 1996). We use a concordance, flat CDM cosmology throughout, with =71 km s-1 Mpc-1, =0.27, and =0.73 (Spergel et al. 2007).
2. Observations
We observed the CO(=21) transition (GHz) towards BRI 1335–0417 using the VLA in B configuration on 2005 April 11, 13, and 22, and in C configuration on 2005 September 16. The total on-sky integration time amounts to 29 hr. At , the line is redshifted to 42.6338 GHz (7.03 mm). Observations were performed in fast-switching mode (e.g., Carilli & Holdaway 1999) using the nearby source 13515-01513 for secondary amplitude and phase calibration. Observations were carried out under very good weather conditions with 25 antennas. The phase stability in all runs was excellent (typically 15∘ for the longest baselines). The phase coherence was checked by imaging the calibrator source 13569+02144 with the same calibration cycle as that used for the target source. For primary flux calibration, 3C 286 was observed during each run. Given the restrictions of the VLA correlator, two 25 MHz intermediate frequencies (IFs) with seven 3.125 MHz channels each were observed simultaneously centered at the CO(=21) line frequency, leading to an effective bandwidth of 43.75 MHz (corresponding to 308 km s-1 at 42.6 GHz). This encompasses a major fraction of the CO line width as measured in the CO(=54) transition (42060 km s-1 FWHM, Guilloteau et al. 1997), but does not cover the line wings and the continuum. Earlier observations set a 2 limit of 240Jy on the continuum emission (Carilli et al. 1999), in agreement with an expected flux of 34 Jy as derived from the continuum spectral energy distribution of this source.
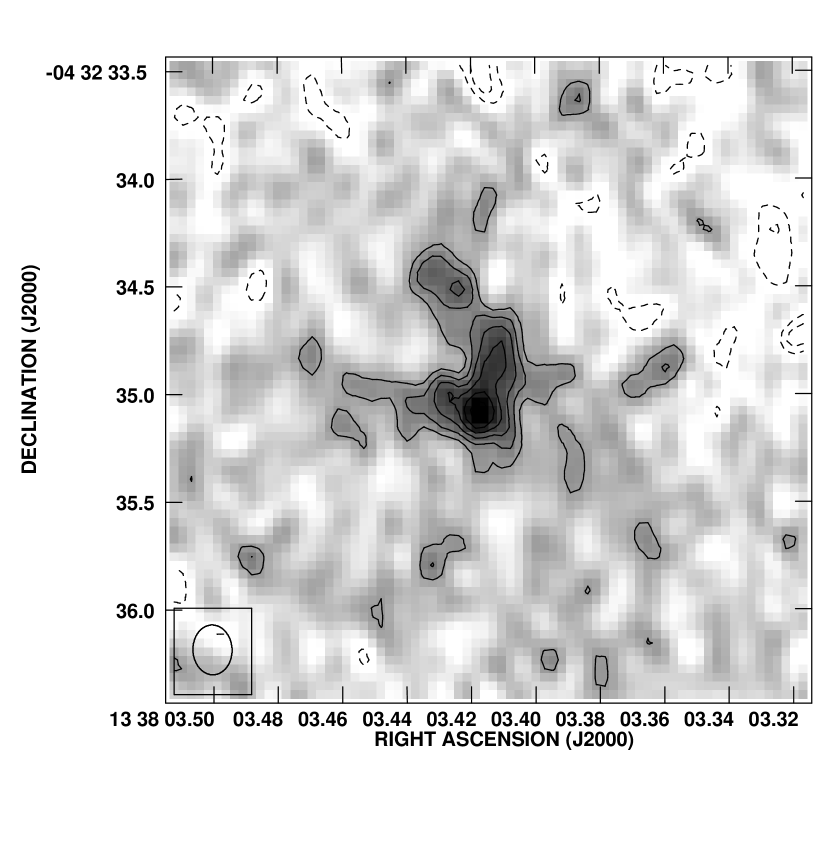
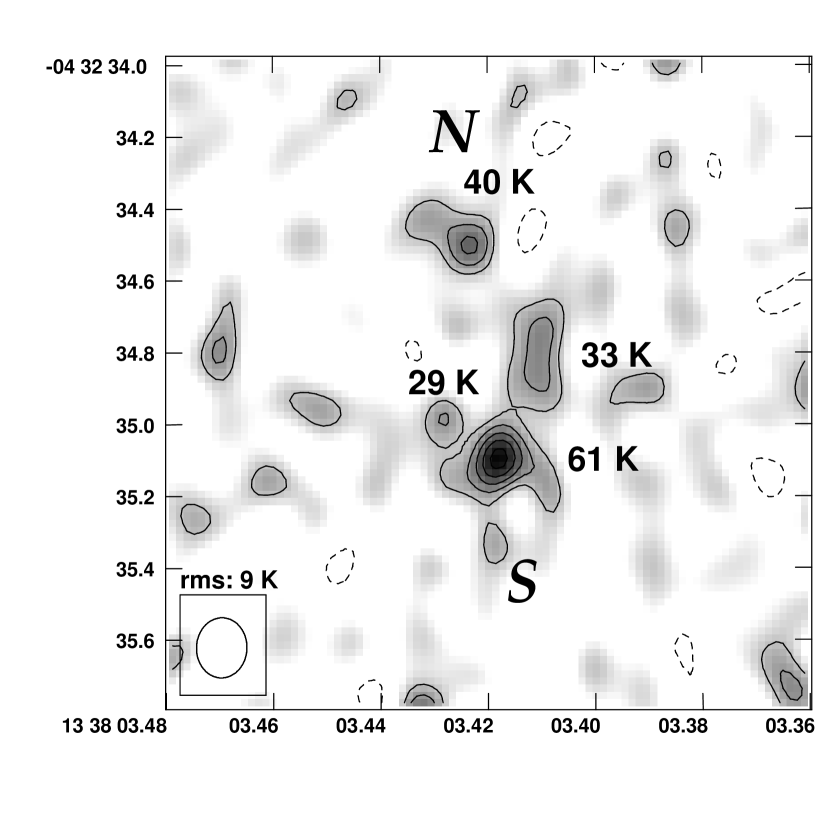
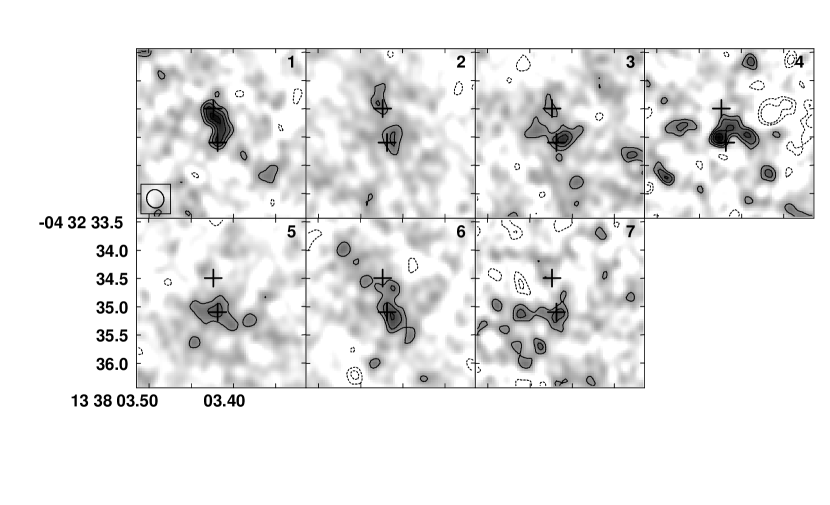
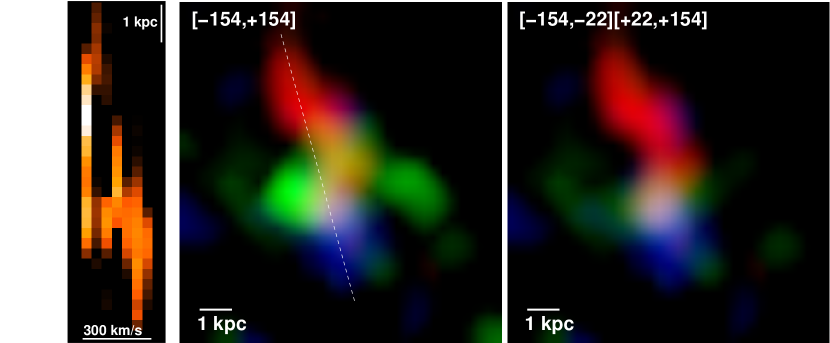
For data reduction and analysis, the AIPS package was used. Two data sets were created for the final analysis. The first dataset includes both the B- and C-array data, and is imaged using natural weighting. A velocity-integrated CO(=21) map of this dataset is shown in Fig. 1. The synthesized clean beam has a size of 0.23 ′′0.18 ′′ (1.61.2 kpc). The final rms over the full bandwidth of 43.75 MHz (308 km s-1) is 50 Jy beam-1. To boost the resolution, the second dataset includes B array data only, and are imaged using robust 0 (i.e., intermediate between natural and uniform) weighting (Fig. 2), achieving a resolution of 0.16 ′′0.14 ′′ (1.10.95 kpc). This results in an rms of 58 Jy beam-1 per channel. In Fig. 3, seven velocity channel maps (6.25 MHz, or 44 km s-1 each) of the CO(=21) line based on the combined BC-array data are shown. A Gaussian taper falling to 30% level at a baseline length of 800 k (longest baseline in the B array data: 1.6M) was applied to the UV data, resulting in a resolution of 0.32 ′′0.30 ′′ (2.22.0 kpc), and an rms of 150 Jy beam-1 per channel. These channel maps are combined into a three color overlay in Fig. 4.
3. Results
3.1. Morphology of the Molecular Gas Reservoir
In Figure 1, the integrated CO(=21) emission over the full measured bandpass (308 km s-1) is shown at a linear resolution of 1.4 kpc (0.2′′). The emission is clearly spatially resolved over many beams, and extended out to a scale of 5 kpc (0.7′′, deconvolved for the beam size). Two distinct peaks of the emission are identified, both of which are extended, and embedded in a continuous, morphologically complex molecular structure. The northern component has a peak flux density of 216 50 Jy beam-1, and the southern component has a peak flux density of 388 50 Jy beam-1 (peaks labeled ‘N’ and ‘S’ in Fig. 2). In Figure 2, a zoomed-in version of this map at 1.0 kpc (0.15′′) linear resolution is shown. At this resolution, some of the more diffuse structure is resolved out. Clearly, the southern component breaks up into multiple line emission regions. Most notably, a resolved subcomponent extends from the main southern peak (‘S’) toward the northern peak (‘N’). In the higher resolution map, the northern component has a peak flux density of 246 58 Jy beam-1, and the southern component has a peak flux density of 375 58 Jy beam-1. The connecting component has a peak flux density of 202 58 Jy beam-1. These three peaks alone encompass a molecular gas mass222As CO emission in currently known quasar host galaxies appears to be thermalized typically up to =43 (Riechers et al. 2006; Weiß et al. 2007), constant is assumed between CO(=21) and CO(=10). The CO is more widespread than in nearby ultra-luminous infrared galaxies (ULIRGs), but shows similar physical properties. We thus adopt a low ULIRG CO luminosity to H2 mass conversion factor of =0.8 (K km s-1 pc2)-1 (Downes & Solomon 1998) rather than =4–5 (K km s-1 pc2)-1 as in nearby spiral galaxies (e.g., Scoville & Sanders 1987; Solomon & Barrett 1991). Such low are also found for submm galaxies (Tacconi et al. 2008). of , corresponding to about two thirds of the mass of derived from the integrated emission seen in the naturally weighted dataset (=0.430.02 Jy km s-1, in agreement with previous results by Carilli et al. 2002). Accounting for the flux in the linewings that is not covered by our observations, the full reservoir has an estimated mass of .
At =4.4074, the brightest peaks of the northern and southern components in the highest resolution map corresponds to beam-averaged, rest-frame brightness temperatures of =61 9 K and 40 9 K (see Figure 2). Averaging over the area of the full CO(=21) reservoir gives =10.0 0.5 K, which implies that part of the diffuse molecular structure may be rather cold. Note that the minimum excitation temperature of CO(=21) is =16.6 K, which however is only 1.8 K above the cosmic microwave background (CMB) temperature at =4.41.
3.2. Dynamical Structure of the CO Distribution
In Figure 3, the CO(=21) emission is shown in seven 44 km s-1 wide velocity channels, smoothed to a linear resolution of 2 kpc. The emission is clearly dynamically resolved and is moving, to first order, from north to south between the red and blue velocity channels (i.e., with increasing channel number). In addition, the center channel (#4) shows a bright, compact peak, which corresponds to a narrow velocity component. This peak is weighted down in the integrated line maps, and corresponds to the third small 3 peak of the southern component in Figure 2 (labeled with its of 29 9 K). Figure 4 shows a composite color map of the velocity channel maps and a position-velocity () diagram (left panel). The middle panel includes all velocity channels, while the central channel (covering the range from -22 km s-1 to +22 km s-1) is excluded from the right panel. The emission is clearly moving from redshifted to blueshifted emission in the right panel. However, the emission in the (green) central channels does not follow the north-south extension, but also show an east-west extension, indicating an additional, distinct velocity component in the system. The overall peak of the emission where all components overlap (seen as a ‘white spot’ in the figure) corresponds to the southern peak in the integrated line map. The velocity structure thus is more complex than that of a simple, inclined, rotating disk (as also seen in the slice). The central, compact, narrow velocity component is likely associated with the optical quasar. However, the relative astrometry of the radio and optical observations (Storrie-Lombardi et al. 1996) is unfortunately not accurate enough at present to substantiate this conclusion.
4. Discussion
We present maps of the molecular gas distribution in a quasar host galaxy at =4.4 at 1.0 kpc spatial resolution. The VLA data show that the molecular gas reservoir in this galaxy is not only distributed over a scale of 5 kpc, but also structured in velocity space. This is the first time that the molecular gas in a quasar host galaxy at such a high redshift (or, indeed, at any redshift greater than 0) has ever been resolved both spatially and dynamically over multiple beams (except for the lensed system PSS J2322+1944 at =4.12; Riechers et al. 2008). The emission in BRI 1335–0417 is resolved into at least three distinct components harboring at least 1–2 1010 of molecular gas each, and at least another 2 1010 is found in the more diffuse molecular medium in between these concentrations. Each of the subcomponents hosts a few times the molecular gas mass of nearby ULIRGs such as Arp 220 (Downes & Solomon 1998). The brightest peak corresponds to a 1 kpc diameter region with a gas surface density of =2.3 1010 kpc-2, which is by a factor of a few higher than in in the central regions of typical ULIRGs (e.g., Wilson et al. 2008). The total molecular gas mass and distribution are reminiscent of those in the =4.69 and =6.42 quasars BR 1202–0725 and SDSS J1148+5251 (Omont et al. 1996; Carilli et al. 2002; Riechers et al. 2006; Walter et al. 2004), albeit concentrated on almost an order of magnitude smaller scales than in BR 1202–0725. The brightest peak of the CO(=21) emission traces a region of 1 kpc diameter where the gas has an average temperature of at least 61 K (depending on optical depth and beam dilution), which is at the high end of but comparable to temperatures in the central regions of nearby ULIRGs (e.g., Downes & Solomon 1998). However, in ULIRGs, regions with molecular gas temperatures of 30–60 K are much more compact than 1 kpc. The CO excitation ladder in BRI 1335–0417 is not constrained well at present. However, the excitation so far is consistent with being similar to the =4.69 quasar host galaxy of BR 1202–0725, for which models of collisional excitation predict a kinetic gas temperature of =60 K and a median gas density of cm-3 (Riechers et al. 2006). If indeed , this would indicate that the brightest CO peak is close to being resolved. Also, it appears that the gas temperature and density are on the high end of but comparable to ULIRGs, while the total gas mass is by about an order of magnitude higher.
Based on the FIR luminosity and SED shape of the source (=3.11013 ; Benford et al. 1999), a star formation rate (SFR) of 4650 yr-1 and a total dust mass of 2109 can be derived.333Assuming SFR=1.510( yr-1/) (Kennicutt 1998). This does not account for possible heating of the dust by the AGN. However, if the dust in this source has an extension and non-uniform distribution similar to that of the molecular gas, local heating (rather than heating of a central source) is likely to be responsible for most of the dust emission. This is consistent with the finding that the (rest-frame) 4.0 cm radio continuum emission in this source dominantly originates from extended, kpc-scale regions and shows a peak of only few times 105 K (Momjian et al. 2007). Such are typical for relativistic electrons from supernova remnants and the interstellar medium in nuclear starbursts, but by at least 2 orders of magnitude lower than found in AGN-powered environments. This finding is also reflected in the fact that BRI 1335–0417 follows the radio-FIR correlation for star-forming galaxies (Carilli et al. 1999). The FIR-derived SFR is by about an order of magnitude higher than in local ULIRGs; however, the ratio of SFR and total gas mass is consistent with the scaling relation for ULIRGs (Solomon et al. 1997) and other high- galaxies (Solomon & Vanden Bout 2005; Riechers et al. 2006). Moreover, in the centers of nearby ULIRGs, correlates with the SFR (Wilson et al. 2008), which suggests that an increased availability of fuel for star formation at a certain density leads to an increased SFR. Given its high on kpc scales, this also motivates the high derived SFR for BRI 1335–0417. Assuming that the gas is converted into stars at an efficiency of 5–10% as in giant molecular cloud cores (e.g., Myers et al. 1986; Scoville et al. 1987), the SFR corresponds to a gas depletion timescale of 2–4 108 yr.
If the molecular gas in this system was gravitationally bound, the CO linewidth (see Sect. 2) and distribution would predict a dynamical mass of =1.0 10 , which could account for both the total molecular gas mass and the mass of the black hole of =6 109 (Shields et al. 2006), but not for a substantial fraction of a 41012 stellar bulge as predicted if the local – relation were to hold (Ferrarese & Merritt 2000; Gebhardt et al. 2000).444In principle, assuming an extreme inclination toward the line-of-sight would significantly increase ; however, the implied large CO linewidths suggest that such a dynamical structure would not be virialized (Riechers et al. 2008).
However, the overall structure of BRI 1335–0417 looks rather disturbed, both spatially and in its velocity structure. While the general north-south extension of the source may be in agreement with rotating structure, this is not the case for the central part of the emission, in particular the compact peak seen in the central channel. This, and the structure seen in the high-resolution CO(=21) map (Figure 2), are more reminiscent of the disturbed gas reservoirs in major mergers, such as seen in the nearby Antennae (NGC 4038/39, e.g., Wilson et al. 2000). If BRI 1335–0417 was an interacting system, the northern component may be in the process of merging with the southern component, which likely hosts the luminous quasar. The connecting component then may be the part where the two galaxies overlap and merge. Note that this region alone would be massive enough to host more than 10 of the largest molecular complexes found in the overlap region of the Antennae (Wilson et al. 2000).
Cosmological simulations predict that the merger rates at =4.4 are substantially higher than at =0. Such scenarios imply that during the early epoch of hierarchical galaxy formation, some of the most massive galaxies form in major merger events (e.g., Springel et al. 2005). Such major, ‘wet’ mergers are believed to commonly trigger both AGN and starburst activity, and lead to high excitation of the molecular gas during both the hierarchical buildup of the host galaxy and the quasar phase (e.g., Narayanan et al. 2008). In simulations, such objects often show multiple CO emisson peaks, arising from molecular gas concentrations that have not yet fully coalesced.
We conclude that the observed properties of BRI 1335–0417 (AGN and extreme starburst activity, high CO excitation, disturbed morphology over 5 kpc scales) are connected to the ongoing buildup of the quasar host galaxy. Such a signpost of early galaxy assembly then could be considered direct observational proof of the scenarios proposed by cosmological simulations, and enable us to directly investigate the connection between quasar activity and high-mass merger events at early cosmic times.
References
- Benford et al. (1999) Benford, D. J., et al. 1999, ApJ, 518, L65
- Carilli et al. (1999) Carilli, C. L., Menten, K. M., & Yun, M. S. 1999, ApJ, 521, L25
- Carilli & Holdaway (1999) Carilli, C. L., & Holdaway, M. A. 1999, Radio Science, 34, 817
- Carilli et al. (2002) Carilli, C. L., Kohno, K., Kawabe, R., Ohta, K., et al. 2002, AJ, 123, 1838
- Downes & Solomon (1998) Downes, D., & Solomon, P. M. 1998, ApJ, 507, 615
- Ferrarese & Merritt (2000) Ferrarese, L., & Merritt, D. 2000, ApJ, 539, L9
- Gebhardt et al. (2000) Gebhardt, K., Bender, R., Bower, G., et al. 2000, ApJ, 539, L13
- Guilloteau et al. (1997) Guilloteau, S., Omont, A., McMahon, R. G., Cox, P., & Petitjean, P. 1997, A&A, 328, L1
- Hopkins et al. (2005) Hopkins, P. F., et al. 2005, ApJ, 625, L71
- Kennicutt (1998) Kennicutt, R. C. 1998, ApJ, 498, 541
- Momjian et al. (2007) Momjian, E., Carilli, C. L., Riechers, D. A., & Walter, F. 2007, AJ, 134, 694
- Myers et al. (1986) Myers, P. C., et al. 1986, ApJ, 301, 398
- Narayanan et al. (2008) Narayanan, D., et al. 2008, ApJS, 174, 13
- Omont et al. (1996) Omont, A., et al. 1996, Nature, 382, 428
- Riechers et al. (2006) Riechers, D. A., Walter, F., Carilli, C. L., et al. 2006, ApJ, 650, 604
- Riechers et al. (2008) Riechers, D. A., et al. 2008, ApJ, in press (arXiv:0806.4616)
- Scoville & Sanders (1987) Scoville, N. Z., & Sanders, D. B. 1987, in Interstellar Processes (Dordrecht: Reidel), 21
- Scoville et al. (1987) Scoville, N. Z., et al. 1987, ApJS, 63, 821
- Shields et al. (2006) Shields, G. A., Menezes, K. L., Massart, C. A., & Vanden Bout, P. 2006, ApJ, 641, 683
- Solomon & Barrett (1991) Solomon, P. M., & Barrett, J. W. 1991, ‘Dynamics of Galaxies and Their Molecular Cloud Distributions’, IAUS, 146, 235
- Solomon et al. (1997) Solomon, P. M., Downes, D., Radford, S. J. E., & Barrett, J. W. 1997, ApJ, 478, 144
- Solomon & Vanden Bout (2005) Solomon, P. M., & Vanden Bout, P. A. 2005, ARA&A, 43, 677
- Spergel et al. (2007) Spergel, D. N., Bean, R., Doré, O., et al. 2007, ApJS, 170, 377
- Springel et al. (2005) Springel, V., Di Matteo, T., Hernquist, L. 2005, MNRAS, 361, 776
- Storrie-Lombardi et al. (1996) Storrie-Lombardi, L. J., McMahon, R. G., Irwin, M. J., & Hazard, C. 1996, ApJ, 468, 121
- Taccconi et al. (2008) Tacconi, L. J., et al. 2008, ApJ, in press (arXiv:0801.3650)
- Walter et al. (2004) Walter, F., Carilli, C., Bertoldi, F., et al. 2004, ApJ, 615, L17
- Weiß et al. (2007) Weiß, A., et al. 2007, ‘From Z-Machines to ALMA: (Sub)Millimeter Spectroscopy of Galaxies’, ASPC, 375, 25
- Wilson et al. (2000) Wilson, C. D., Scoville, N., Madden, S. C., & Charmandaris, V. 2000, ApJ, 542, 120
- Wilson et al. (2008) Wilson, C. D., et al. 2008, ApJS, accepted (arXiv:0806.3002)