A Radio Survey of Seven Southern X-ray Luminous Clusters of Galaxies
Abstract
The Australia Telescope Compact Array (ATCA) has been used at 1.38 and 2.38 GHz to survey seven southern Abell clusters of galaxies with high X-ray luminosities: A2746, A2837, A3126, A3216, A3230, A3827 and A3836. The clusters have also been surveyed at 0.843 GHz with the Molonglo Observatory Synthesis Telescope (MOST). We have listed a complete 1.38-GHz sample of 149 radio sources within the Abell circles centred on their X-ray centroids. We compare their identification fractions, emitted 1.38-GHz and optical powers, radio spectral indices and radial variation in projected source density with those of the radio-selected samples of Slee et al. (1998). We compare our fractional radio luminosity function with that of the radio-selected samples of Ledlow & Owen (1996) and Slee et al. (1998). Three significant differences are noted between X-ray and radio-selected samples of clusters; (1) the X-ray sample has an excess of flat-spectrum radio sources; (2) the fractional radio luminosity function for the FR I sources in the X-ray selected sample is much steeper, implying that fewer of their cluster galaxies become hosts for the stronger FR I radio galaxies; (3) a complete absence of FR II radio galaxies in the X-ray selected sample. The average excess projected density of radio sources near our cluster centres is 5 times the background source density.
keywords:
surveys - galaxies: clusters: general - radio continuum: galaxies - X-rays: galaxies: clusters1 Introduction
Clusters of galaxies provide an interesting environment in which to test theories of how radio galaxies form and evolve. In particular, the presence of a relatively dense, X-ray emitting ionised gas permeating clusters provides an ideal laboratory to study jet propagation and the expansion of radio lobes.
The examination of these processes requires carefully-defined samples incorporating data on the individual cluster members from the radio, optical and X-ray regimes. Further, selection of the cluster samples may have an impact upon the conclusions that can be drawn. Clusters selected primarily on the radio power of the objects within them may represent a distinct environment, with a radio source population different from that in clusters selected on the basis of integrated optical luminosities or X-ray luminosity.
A number of synthesis radio surveys of large samples of clusters have been published in the last 17 years. In addition, numerous publications on individual clusters and individual cluster radio galaxies exist in the literature. Comprehensive collections of 1.4-GHz maps of cluster radio galaxies taken with the Very Large Array (VLA) of the National Radio Astronomy Observatory (NRAO, USA) were published by Zhao, Burns & Owen (1989), Owen et al. (1992, 1993), Ledlow & Owen (1995a), and a detailed analysis of these data were made by Ledlow & Owen (1995b, 1996). A second set of VLA maps at 1.5 and 4.9 GHz with complete source lists were published by Slee, Perley & Siegman (1989), Slee, Roy & Savage (1994) and Slee, Roy & Andernach (1996), who later drew general conclusions about the relationships between radio, optical and X-ray parameters (Slee, Roy & Andernach 1998). A comprehensive survey at 0.843 GHz of 39 nearby southern clusters was made by Unewisse (1993), but none of the more distant clusters in the present paper was included.
The present paper presents complete source lists and analysis for seven rich clusters from Abell et al’s (1989) catalogue south of Declination , selected on account of their high ROSAT X-ray luminosities in the “X-ray brightest Abell-type clusters of galaxies” (XBACs) catalogue of Ebeling et al. (1996). The radio survey was made at 1.38 and 2.38 GHz with the Australia Telescope Compact Array (ATCA) with the initial object of identifying a suitable candidate cluster in a search for radio gravitational lensing (Tsarevsky et al. 2008, in preparation). In addition, as an X-ray-selected sample, the source list and its general analysis are of interest in their own right.
Our selection criteria included the following:
1. Clusters south of Declination , enabling observations in the “cut” mode (cf. Sect. 2.1) with good coverage of the uv plane.
2. Cluster X-ray luminosities (0.1–2.4 keV) above the median of 1.56 W of the XBACs sample; the exception is A3126, whose falls only 13% below the median, and was included because it has a well-determined redshift and a high velocity dispersion.
3. Contamination of the ROSAT image by active galactic nuclei (AGN) is minimal as assessed by Ebeling et al. (1996).
The clusters were also surveyed with the Molonglo Observatory Synthesis Telescope (MOST) at 0.843 GHz with the primary object of detecting as many as possible of the 1.38 and 2.38-GHz sources in order to obtain more accurate radio spectral indices and, if possible, identify steep-spectrum radio relics, which are known to favour the cluster environment.
Section 2 briefly describes the observations, while Section 3 presents the radio source lists and optical identifications. Section 4 discusses the derived parameters of the sources, including spectral indices, relationships between emitted radio, optical and X-ray luminosities and the clusters’ radio luminosity function, and Section 5 presents a discussion of our results.
In the following text, frequent reference is made to cluster samples selected by X-ray emission, radio emission or using neither of these criteria. To avoid confusion, we call samples selected by their X-ray emission “X-ray samples” and those selected by their radio emission are termed “radio samples”; naturally, both samples imply that optical clusters are present.
For consistency with previously published radio and X-ray data, to which we refer in this paper, we use the Einstein-de Sitter cosmological model with H0=75 km s-1 Mpc-1 and q0=0.5 throughout this paper.
2 Observations
2.1 The ATCA observations
The general survey of the seven clusters involved simultaneous 1.38 and 2.38-GHz observations with the ATCA in the 1.5C and 1.5D configurations over two 15-hour sessions in February and May 1996. We utilised the standard continuum correlator configuration which has dual frequency mode with two independent 128 MHz bands. One of the target clusters, A3827, was subsequently selected for much deeper observations at 4.80 and 8.64 GHz in order to search for evidence of gravitational lensing; this is treated separately in Tsarevsky et al. (2008). Table 1 lists the more useful optical and X-ray data for these clusters, and the rms radio noise levels over the cleaned maps.
| Cluster | R | BM | RA,DEC(J2000,X-ray) | Ref. | LX | , mJy/beam | ||||||
|---|---|---|---|---|---|---|---|---|---|---|---|---|
| h m s ref | for | km s-1 | ′ | 1037 W | 0.843 | 1.38 | 2.38 GHz | |||||
| A2746 | 0 | II-III | 00 14 18.4 66 04 39 R | .1594 | 5 | 1 | 14.0 | 2.31 | 1.3 | 0.121 | 0.121 | |
| A2837 | 0 | I-II | 00 52 44.9 80 15 59 R | .1134 | 7 | 1,2 | 18.3 | 2.77 | 1.4 | 0.132 | 0.132 | |
| A3126 | 1 | III | 03 28 37.5 55 42 46 R | .0854 | 44 | 3,4 | 1020 | 23.2 | 1.36 | 1.1 | 0.085 | 0.048 |
| A3216 | 2 | II-III | 04 04 07.0 65 12 32 X | .1581 | 1 | 5 | 14.0 | 2.23 | 2.8 | 0.080 | 0.093 | |
| A3230 | 2 | II | 04 11 20.4 63 41 46 X | .162 e | – | 6 | 13.8 | 2.43 | 2.4 | 0.072 | 0.048 | |
| A3827 | 2 | I | 22 01 56.0 59 56 58 R | .0983 | 21 | 7,8,10 | 1093 | 20.6 | 3.61 | 1.1 | 0.129 | 0.129 |
| A3836 | 2 | I | 22 09 23.3 51 48 54 R | .1100 | 12 | 9 | 510 | 18.7 | 1.72 | 1.4 | 0.126 | 0.126 |
The cluster name is followed by the Abell richness class R, the Bautz-Morgan (BM) type, the X-ray position taken from Böhringer et al. (2004, REFLEX, marked “R”) when available, otherwise from Ebeling et al. (1996, XBACs, marked “X”). The galactocentric mean redshift of the cluster, the number of galaxies with measured , references contributing to the redshifts, the radial velocity dispersion, Abell radius, X-ray luminosity (average of values published in REFLEX and XBACs, converted to H0=75 km s-1 Mpc-1 and q0=0.5. The last three columns are the 1- noise levels at the map centres achieved at 0.843, 1.38, and 2.38 GHz. Note that the higher noise level for the 0.843-GHz image for A3216 is due to a strong source south of the cluster. Redshift data were merged from the following references: (1) Böhringer et al. 2004; (2) De Grandi et al. 1999; (3) Colless & Hewett 1987; (4) Lucey et al. 1983; (5) Jones et al. 2004 (6dF-DR1); (6) estimate from Peacock & West 1992 (priv. comm. M. West); (7) West & Frandsen 1981; (8) Katgert et al. 1998; (9) Ebeling, H., 1997, priv. comm.; (10) Jones et al. 2005 (6dF-DR2).
The survey, centred near the X-ray centroid in each cluster, was made by taking 30-min integrations, which were preceded and followed by a 5-min observation of a nearby phase calibrator. Seven to nine 30-min observations were made on each field during the time (typically 14 h) for which the cluster was above the telescope elevation limits. The primary flux calibrator B1934638 was observed at the beginning of each session. The mapping, cleaning and restoration were performed in the MIRIAD package (cf. Sault et al. (1995) and www.atnf.csiro.au/computing/software/miriad). Self-calibration was utilized in three fields to reduce the contamination by strong field sources. Care was taken at each iteration of the CLEAN algorithm, both in the general cleaning and self-cal process, to use only the number of iterations necessary to achieve a stable level of cleaned flux, while ensuring that the rms residual did not fall below the theoretical value due to the expected system noise. The rms noise residuals achieved near the centres of the cleaned maps are given in Table 1, which shows that they varied between 0.121 and 0.132 mJy beam-1, except for the self-calibrated maps (A3126, A3216, A3230), in which the rms was significantly lower. The angular resolution (FWHM) was typically at 1.38 GHz and at 2.38 GHz.
2.2 The MOST observations
The MOST data were obtained from the archive at the University of Sydney’s Institute of Astronomy and from new observations carried out as part of the Sydney University Molonglo Sky Survey (SUMSS; see Bock, Large & Sadler, 1999 and Mauch et al. 2003). The SUMSS data are available, and fully described, at the project web site, http://www.physics.usyd.edu.au/ioa/Main/SUMSS. The archival data were obtained when one of us (V. McIntyre) was a research fellow in the School of Physics. Those observations were carried out by R.W. Hunstead and J.G. Robertson in the 1990s as part of a long-term program of cluster observations known as the Molonglo Cluster Survey (Haigh et al. 1997, Haigh 2000). The archival observations were taken in a mode which provides a 70′ diameter field, and the new observations in a wide-field mode, where the field of view has a diameter of 2.3∘. The angular resolution (FWHM) was ; the rms noise level for each cluster field is listed in Table 1.
All the observations were reduced using the latest version of the pipeline-processing software for the SUMSS. Briefly, this involves determining calibration factors, back-projecting the intensities recorded by the telescope beams (Perley 1979), and CLEANING to reduce the sidelobe structure. A more complete description of this software system is presented by Cram & Ye (1995).
3 Results
3.1 Measurement of source parameters
The rms residuals of the Gaussian fitted positions, i.e. RA) Dec) depend on several factors including the signal/noise ratio and the angular extent of the source. We have fitted 146 sources listed at 1.38 GHz in Table 2 with unconstrained elliptical Gaussians; the rms residuals of the Gaussian fitted positions ranged from 0.1′′ to 10′′, with a median of 0.9′′, but their distribution was highly skewed with an interquartile distance of 0.9′′ due to the influence of signal/noise and angular size. The accuracy of the SuperCOSMOS positions is generally better than 0.4′′ (Hambly et al. 2001), and so is not an important influence in the identification procedure. The 0.843-GHz positions, being derived from 3 to 5-times larger restoring beams were utilized only as an aid to match 0.843-GHz sources to corresponding 1.38 and 2.38-GHz sources.
The adopted flux density for a source was computed on the basis of two of three possible methods. For an unresolved source, we averaged the peak flux densities of point-source and unconstrained gaussian fits. For a resolved source, we averaged the integrated flux densities from an unconstrained gaussian fit and from adding pixels in a small box enclosing the full source extent.
The adopted flux density for an unresolved source at 1.38 and 2.38 GHz was generally a mean of the results from the three methods of measurement; for a resolved source, we averaged the integrated fluxes from the unconstrained Gaussian fit and the pixel-adding method.
The errors in flux density at 1.38 and 2.38 GHz due to system noise and sidelobes were assessed from the rms residuals in the peak flux from the two methods of Gaussian fitting (point source and unconstrained Gaussian), usually an average being taken for unresolved sources. If the source was resolved, we adopted the error in the peak flux from the unconstrained Gaussian fit. To this error, we added in quadrature a systematic error of 6% of the derived flux density, as explained in detail by Slee et al. (1996).
We adopted a similar method of deriving 0.843-GHz flux densities and their errors. Since there were very few resolved sources at 0.843 GHz, we almost exclusively adopted the peak flux density and error from the point-source Gaussian fit, but we ensured that the two other methods gave consistent values. A systematic error of 3% of the 0.843-GHz flux density was added in quadrature with the noise and sidelobe error (Mauch et al. 2003).
3.2 The source list
Table 2 presents the parameters determined for the 149 radio sources detected in the fields of the seven southern clusters. Including subcomponents and integral parameters of double sources, Table 2 contains a total of 168 entries. The 1.38-GHz flux densities are the primary measurements, since this is the survey with highest sensitivity. The 0.843-GHz and 2.38-GHz flux densities are used to complement the 1.38-GHz intensities in order to provide spectral indices for the majority of radio sources. The 2.38 and 1.38-GHz measurements also provide angular sizes for many of the sources. Only two sources were detected exclusively at 2.38 GHz, and no extra sources were detected at 0.843 GHz within the area defined by the 1.38 GHz observations.
The sources in Table 2 are drawn from areas on the 1.38-GHz maps that are within the 32-arcmin primary beam to FWHM (3 clusters) or moderately outside the FWHM circle (4 clusters). We consider that the 149 sources (omitting components of doubles) in Table 2 constitute a complete sample to a 1.38 GHz flux density of 1.0 mJy. We justify this by noting that a 1.38-GHz source of 1 mJy at one Abell radius from the pointing center varies between four and eight times the rms noise, depending on the Abell radius of the cluster. At 2.38 GHz, a 1-mJy source near one Abell radius and beyond is usually undetectable unless it is reasonably strong and/or has a flat spectrum, but we have quoted an upper flux limit that is five times a measured rms in the region of the source. If no 2.38-GHz flux density or upper limit is listed in column 9, the source is outside the cleaned inner quarter of the dirty map.
The spectral indices, , in Table 2, defined by S() were derived from the flux densities or their upper limits at the three frequencies; for some of the stronger sources additional data from higher frequency surveys were extracted from the literature, using the CATS database (cats.sao.ru, see Verkhodanov et al. 1997). Angular sizes were derived by fitting elliptical Gaussians to the restored images, and were accepted only if the major and minor axes significantly () exceeded the major and minor axes of the restoring beam; sometimes the angular sizes were available at both 1.38 and 2.38 GHz, in which case the tabulated value is the average. For double sources, indicated by “a/b” in the source number, we tabulated the angular separation between the fitted positions of the components and the position angle of the vector (from north through east) from the component (a) of higher flux density.
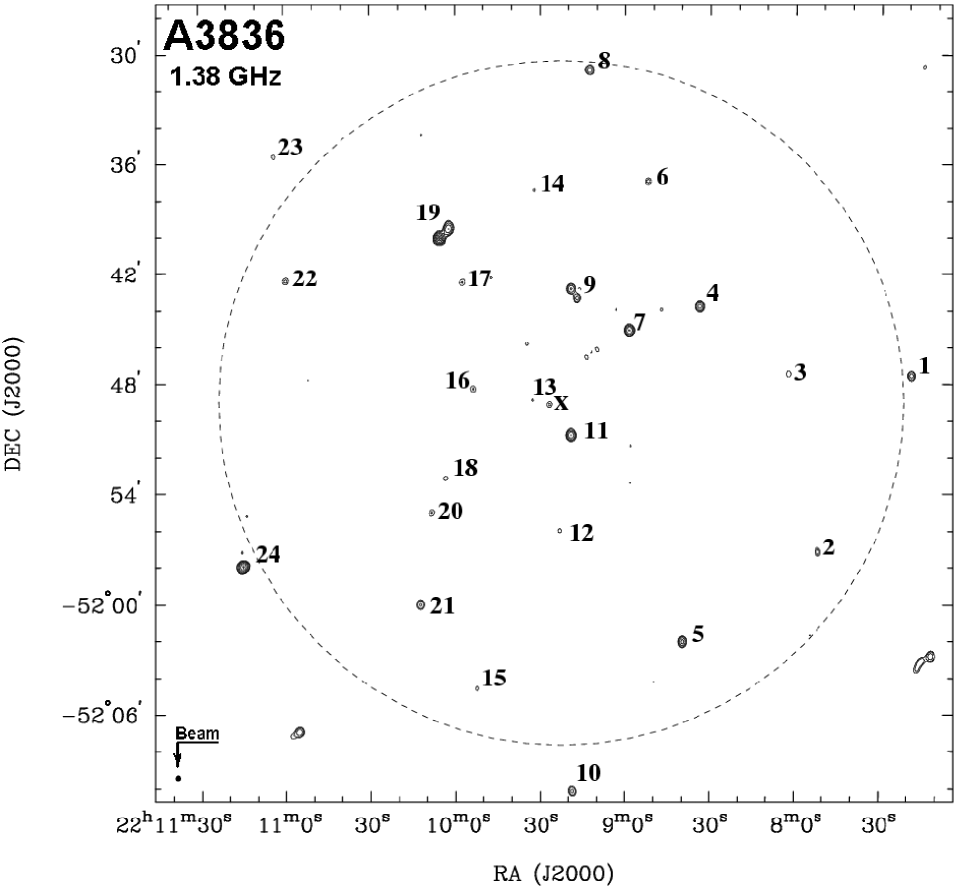
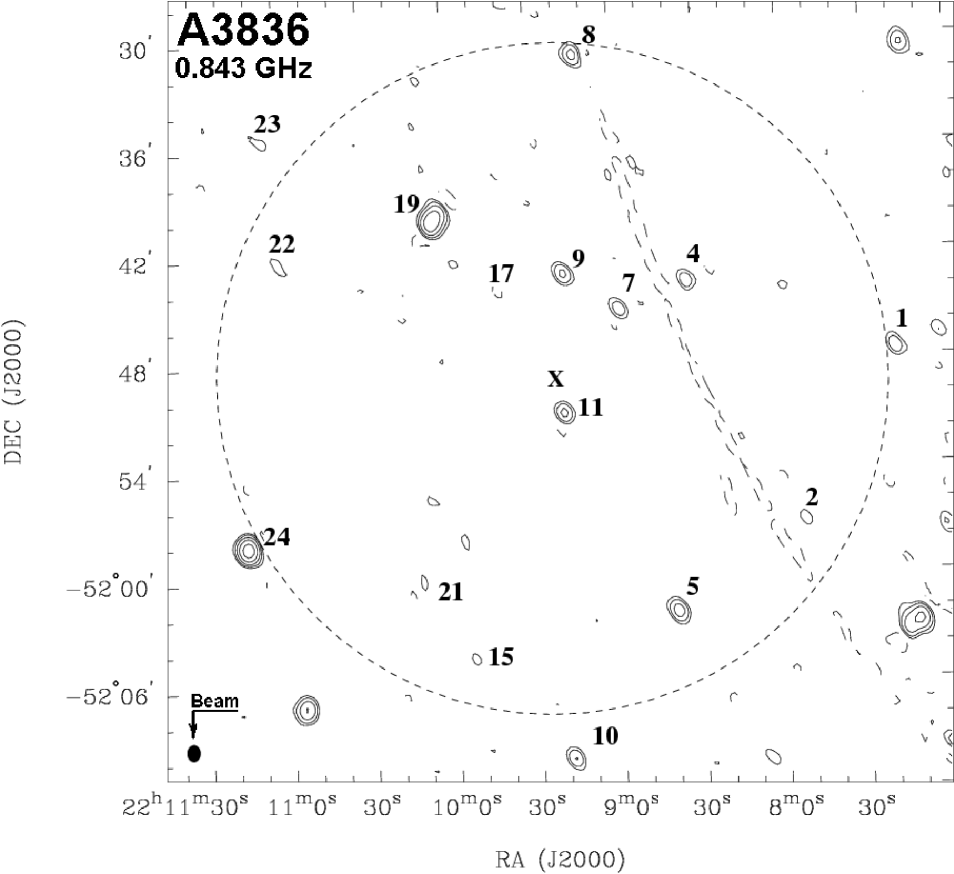
As an example of the images obtained, Figures 1 and 2 show the 1.384 and 0.843 GHz contour maps of the region around the centre of Abell 3836 with the sources numbered according to their designations in Tables 2 and 3. The circle shown on the map has the Abell radius of the cluster, which is 2.0 Mpc for the adopted cosmology. Similar maps were constructed for the remaining six clusters, and the 1.38-GHz maps of these are available in the online material of the present paper.
3.3 Optical identifications
Each of the 149 sources in Table 2 was checked for an optical counterpart in the SuperCOSMOS Science Archive (http://surveys.roe.ac.uk/ssa), based on digitised data from the B, R and IR plates exposed at the UK Schmidt Telescope, as well as data from the ESO R plate. SuperCOSMOS offers an accurate position for the object on each plate and estimates its apparent magnitude corrected for atmospheric extinction. Interstellar extinction was obtained from Schlegel et al. (1998). The redshifts attributed to optical identifications in Table 3 were those available in published form as of June 1, 2007. We have included in Table 3 only those radio sources for which we found an optical identification. We also include ten blank fields (B) in Table 3, and give notes for all of them in this section, and present overlays for nine of them in Figure 3.
We examined in detail the observational factors that were most likely to influence our acceptance of an optical object as a likely identification. These factors included the accuracies of the optical and radio coordinates, the angular sizes of the optical objects and radio sources, and the probability of a chance optical association in a given circular area about the radio position. The accuracies of the radio and optical positions have been discussed in Section 3.1.
SuperCOSMOS also classifies the objects on each plate as either a galaxy (G) or star-like (St), according to their morphology. We accepted a classification of either galaxy or star-like depending upon an assessment of the four separate classifications backed up by an examination of the individual red and blue digitized images, resulting in the derivation of the object’s colour index. We were able to classify the morphological type of “galaxy” for the brighter objects, but in the case of faint star-like objects it was not possible to discriminate between actual stars, quasars, or faint, misclassified galaxies. The results from this radio/optical comparison are presented in Table 3.
The brightness of a galaxy identification is important in deciding whether the galaxy is a cluster member, especially as few of the suggested identifications have measured redshifts. It is now recognized that if an E/S0 galaxy is to be the host of a radio galaxy, its absolute red magnitude is almost invariably M21.0 (Ledlow & Owen 1995b, Slee et al. 1998). Therefore, in order to check whether the galaxy was a likely cluster member, we transformed the apparent -band magnitude to an absolute -band magnitude (including K, general dimming and extinction corrections) by the application of the mean cluster redshift. Thus we were able to distinguish between cluster galaxies and radio sources behind the cluster, but the method does not eliminate a foreground identification. However, Slee et al. (1998) have shown that most of the identifications that do not satisfy the above condition are background objects, because their distribution in has a median value 2.5 mag fainter than that of the identifications that do satisfy the condition. There are, in fact, two foreground galaxies with measured redshifts in Table 3. The star-like (St) identifications were not checked by this method, as these objects may be quasars, AGN, faint misclassified galaxies or, more rarely, real stars.
In interpreting the entries in Table 3, the following notes may be useful:
1. All galaxy identifications with measured redshifts are given their
correct values of log P1.38 and the -band absolute magnitude, ,
regardless of whether the redshift places the radio source and its optical
identification within the designated cluster. If they are not cluster
members, the values of log P1.38 and carry a trailing
letter “n”.
2. Galaxy identifications without measured redshifts are first
checked for membership of the designated cluster by using the
cluster’s mean redshift to test whether the galaxy’s is brighter
than 20.6 (see the next paragraph). If its fulfills that
criterion, both log P1.38 and are listed in Table 3, using the
designated cluster’s mean redshift.
3. We accept that all the St objects listed as identifications are stars or
AGN, and so do not quote values for radio power and absolute red magnitude
for them.
The last two columns of Table 3 contain the emitted radio powers and absolute -band magnitudes of those galaxies with 20.6, and thus accepted as cluster members. Their UKST -band magnitudes have been transformed to the Cousins sequence by applying the small corrections tabulated by Frei & Gunn (1994). In what follows we refer to these corrected magnitudes as -band magnitudes.
3.4 Radio-optical overlays and notes to individual objects
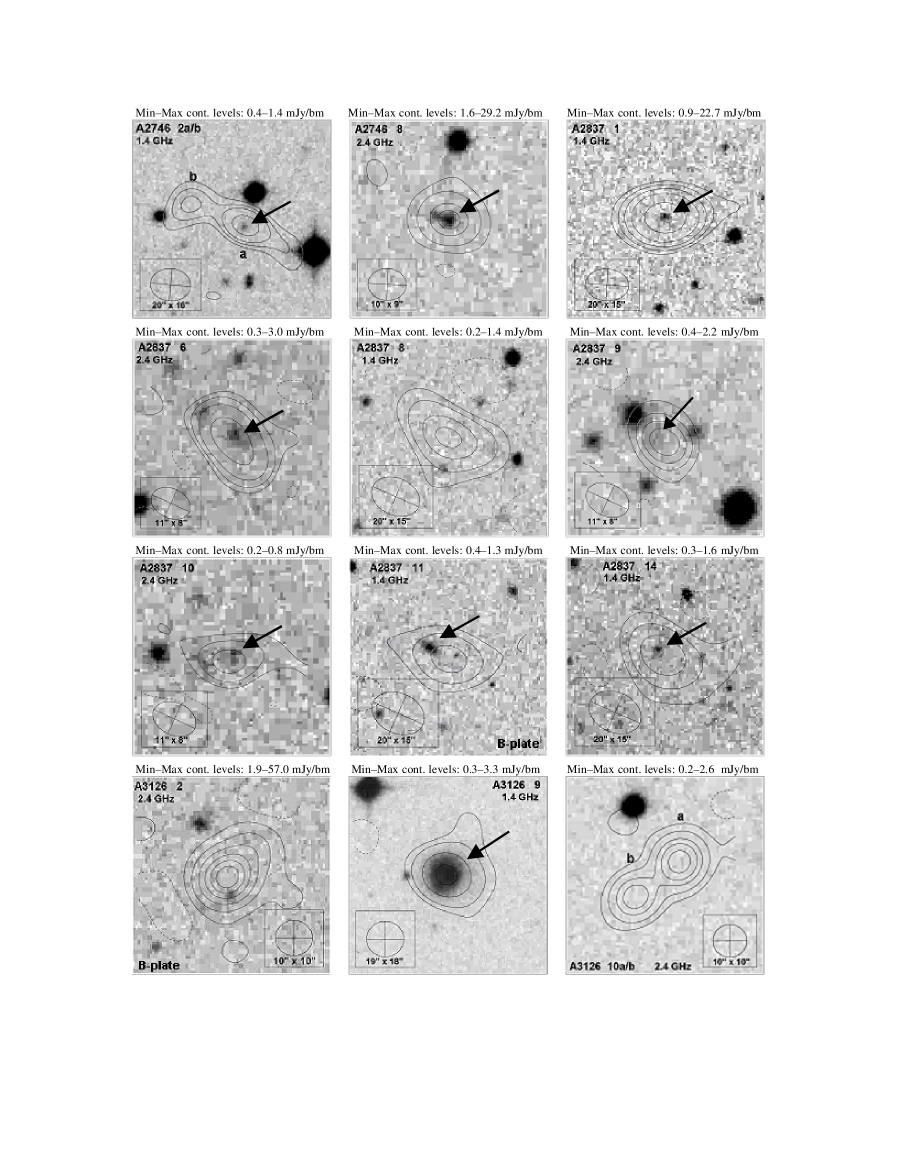
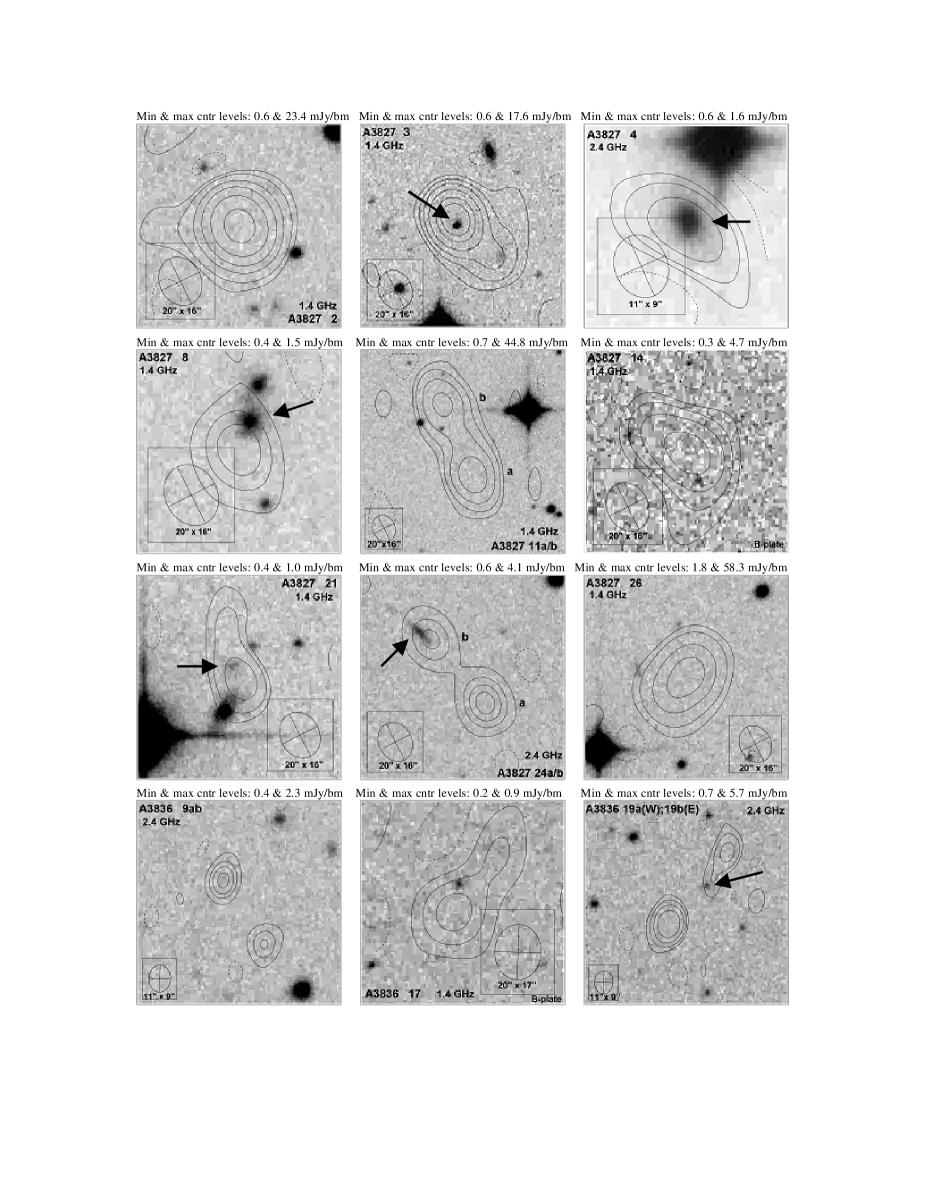
The montage of Figure 3 presents a series of radio-optical overlays, which illustrate the application of our adopted identification procedure, and illustrates a few of the more interesting images of complex sources. If available with sufficient signal/noise, the higher resolution 2.38-GHz contours, otherwise the 1.38-GHz contours, are overlayed on digitised plates from the UK Schmidt Telescope Red (IIIaF) Southern (Second Epoch) Survey (see www-wfau.roe.ac.uk/sss/surveys.html). Reference to Table 3 will help in interpreting these overlays.
First, in many cases we select a galaxy close to the radio centroid. These galaxies, e.g. in the frame for A2746_2a/b (see note below), may be as faint as =19.65, and often there is no alternative optical object within the radio contours. We do not consider such faint galaxy identifications as members of the clusters on which they are projected because they violate our absolute -band magnitude criterion discussed in Section 3.3.
In some frames of the montage there are multiple objects within the radio contours. Usually (e.g. A3216_9), we select the brightest galaxy near the radio centroid as the more likely identification. In more ambiguous frames (e.g. A3230_1) we accepted a brighter galaxy further away from the radio peak as the most likely identification, for reasons explained in the individual notes below.
Several of the stronger radio sources, e.g., A3827_6 and A3836_9a/b (see below) do not show optical objects above the plate limit within their radio contours and are therefore considered well beyond the clusters on which they are projected. This means that these sources are probably powerful radio galaxies of the FR II class (Fanaroff & Riley 1974), which must await more sensitive optical observations to locate their optical identifications and measure their redshifts.
The frame for A3126_13/16 is particularly interesting and discussed in detail below.
In the following we give detailed notes on those individual optical identifications marked with an asterisk in column 10 of Table 3. As is expanded in Section 3.5, we calculate the probability (P) of a chance projection based on the galaxy and star densities of Tyson & Jarvis (1979). P is the probability of an optical object of a given class and apparent blue magnitude being found at random within a circular area of radius equal to its angular distance from the centroid of the radio identification, as given in column 5 of Table 3. The value of P for our chosen identification is given in parentheses after the source name in the following notes, except for the very bright unambiguous cases such as A3126_9.
A2746_2a/b. (P=0.03) The radio morphology suggests a possible wide-angle tailed (WAT) radio galaxy with the host G near the radio centroid.
A2746_8. (P=0.0005) The St object near the radio centroid is accepted as the identification, but the fainter G 4′′ to the east, with P=0.008, may be an alternative identification.
A2837_1. (P=0.0002) Fig. 3 shows an unambiguous identification with a G near the source centroid.
A2837_6. (P=0.0008) The most likely identification is the G near the source centroid, but a fainter G (P=0.03) near the radio axis 10′′ to the NE may be the host of an unresolved narrow-angle tailed (NAT) radio galaxy.
A2837_8. Although no identification is listed, Fig. 3 shows a G 13′′ to the south of the radio centroid (P=0.08) that may be the host of an unresolved WAT.
A2837_9. (P=0.002) A faint G near the radio centroid is not clear in the -band image of Fig. 3, but is verified by the B and IR images. The two brighter G’s to the NE and NW of the centroid could be hosts to either an unresolved NAT (P=0.002) or WAT (P=0.002) respectively; they are probably cluster galaxies.
A2837_10. (P=0.0005) The faint G in Fig. 3, 1′′ to the NNW of the radio centroid, is confirmed on UKST-B and ESO-R images.
A2837_11. (P=0.006) The bright G, 8′′ to the ENE, could be a cluster member. and is accepted as the identification. The faint object near the radio centroid appears only on the 2nd-epoch Sky Survey B-image, but not on the 1st-epoch one, and is therefore probably a plate defect.
A2837_14. (P=0.005) Figure 3 shows a G, 4′′ to the NE of the radio centroid which we accept as the identification. The object is not bright enough for cluster membership. The faint object 15′′ to the west has a high probability of projection.
A3126_2. The St 7′′ to the south of the radio centroid has P=0.02, but its position relative to the radio centroid and major axis does not support its status as an identification.
A3126_9. The bright G is a secure identification for this extended source. It is a cluster member by its brightness.
A3126_10a/b. The well-defined double source is probably a distant FR II radio galaxy.
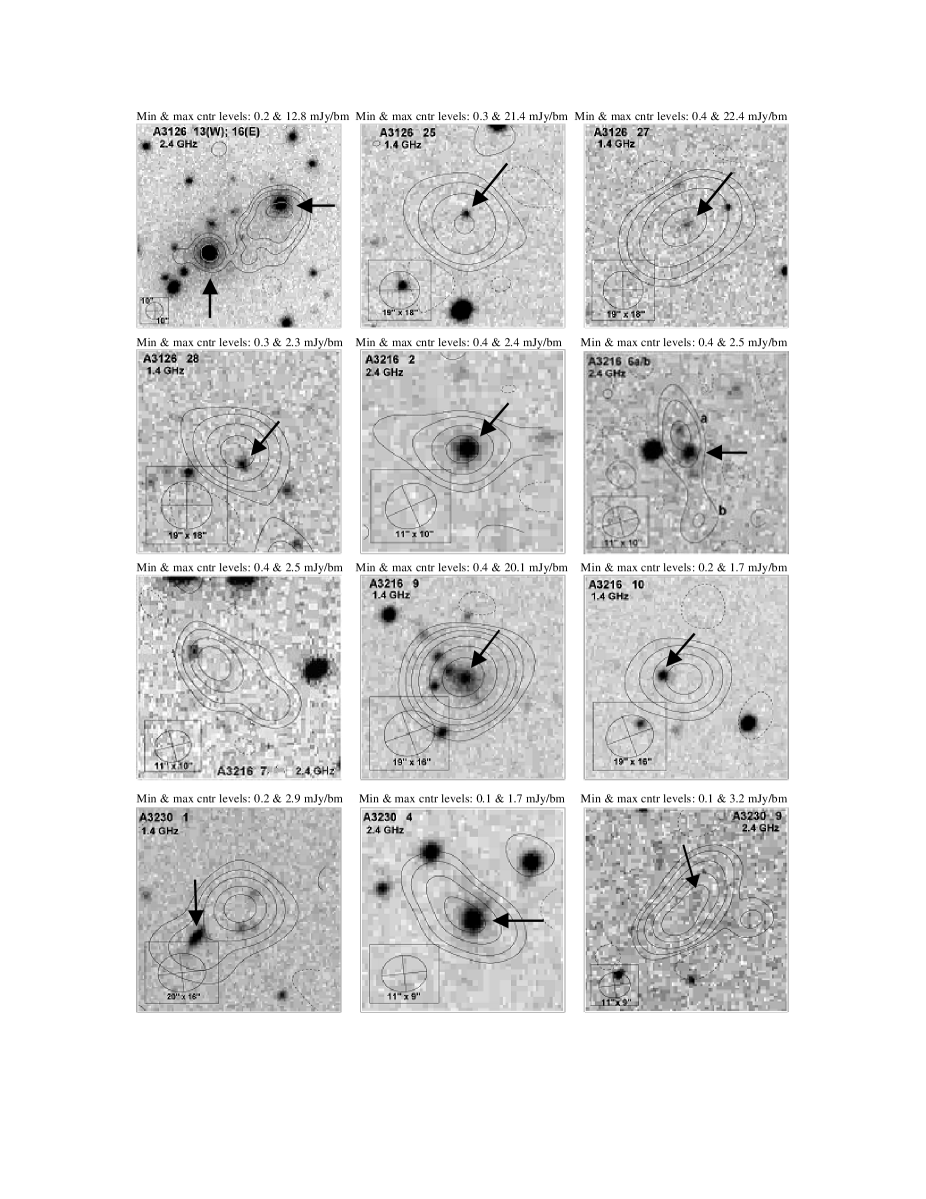
A3126_13/16. Here we see two separate sources, one extended (#13, NW) and the other (#16, SE) much more compact; both are identified with bright elliptical galaxies, in fact the two brightest are spectroscopically confirmed cluster members, which are projected onto the cluster at angular distances of 1.0′ and 0.2′ from the X-ray centroid respectively. The compact SE source (#16) coincides with the second-brightest cluster galaxy and is closer in projection to the cluster’s X-ray centroid. Given the positional uncertainty of of the REFLEX position for an extended source like this (Edge 2006), A3216_16 and its associated galaxy could well be at the dynamical centre of the cluster. There is good evidence from the digitized image of the 2-nd epoch UKST Red Survey for a halo surrounding them. Another unusual feature of this pair of radio sources is the marked difference in their radio spectra. The compact SE source has a fairly flat spectrum (0.54), while the extended NW source has a more normal spectral index of 0.90. The flat spectrum and compact nature of the SE source suggest that this elliptical is dominated by an AGN , while the NW source is possibly a partially resolved NAT whose projected tails extend almost to the cluster’s X-ray centroid.
A3126_25. (P=0.0013) The comparatively bright St object, 6′′ to the NNW of the radio centroid, is accepted as the identification for this extended source.
A3126_27. (P=0.0003) The faint G near the centroid of this extended radio source is accepted as the most likely identification. The St object 22′′ to the NNW of the centroid has P=0.23 and is not associated with the radio source.
A3126_28. (P=0.005) The comparatively bright G, 5′′ to the SSW of the radio centroid, is accepted as the identification.
A3216_2. (P=0.00003) The bright elliptical G near the radio centroid is accepted as the identification, and considered a cluster member.
A3216_6a/b. (P=0.00009) The comparatively bright G near the radio centroid is accepted as the identification, and considered a cluster member. The fainter St object, 7′′ to the NNE, may be a projected object with P=0.023.
A3216_7. The extended source is probably an unresolved NAT; the host G is 16′′ to the NE of the radio centroid along the major axis. Its probability of projection is P=0.06 with respect to the radio centroid, but its proximity to the major axis makes the identification more secure.
A3216_9. (P=0.00006) The bright G near the radio centroid is the favoured identification, but the other three G’s within the central two contours are bright enough to be cluster members; they have values of P between 0.01 and 0.00007.
A3216_10. (P=0.004) Although the G is displaced 9′′ from the radio centroid along the major axis, it is accepted as the identification for this radio source. It is bright enough for cluster membership.
A3216_14. A bright St object (mR=13.7) is 4.4′′ from the radio centroid of this unresolved source, but its accurate radio coordinates suggest that the objects are not associated. There is no overlay in Fig. 3.
A3230_1. Figure 3 shows four optical objects within the radio contours: three G’s and one St (the fainter of the two images to the SW). All four objects within the contours have a low probability of projection with respect to the radio centroid (P0.01) but only the bright E/S0 galaxy to the south east of the radio peak, and the brighter of the two fainter galaxies (7′′ south of the radio peak) are bright enough to be cluster members. The bright E/S0 SE of the radio centroid is accepted as the most likely identification, as it is positioned along the major axis of this extended source.
A3230_4. (P=0.0002) The bright elliptical G near the radio centroid is accepted as the identification for this extended source; it is possibly the host galaxy of an unresolved WAT. Despite the clear elongation of the radio contours, a gaussian fit was unable to yield a deconvolved size.
A3230_9. (P=0.02) The faint St identification for this extended source is displaced 6′′ along the major axis to the NNW of the radio centroid. It is tabulated in the UK-R and UK-B SuperCOSMOS data.
A3230_11. (P=0.00004) There are two bright G’s at 1′′ and 4′′ to the south of the radio centroid, but the brighter one nearer the radio centroid is accepted as the identification. The other galaxy is also bright enough for cluster membership. There is no overlay in Fig. 3.
A3827_2. Fig. 3 shows no clear identification for this slightly extended source. It is possibly a distant FR II.
A3827_3. (P=0.0024) The St object, close to the radio centroid, is accepted as the identification. The faint G, 24′′ along the major axis to the SSW of the radio centroid, is probably a projected object with P=0.2; this G is too faint to be a cluster member.
A3827_4. The bright elliptical G near the radio centroid is clearly the identification. The distorted nature of the outer contour to the SSE may be due to the close negative contour. The source is clearly extended in PA60∘, but a deconvolved size was not yielded in a gaussian fit.
A3827_8. (P=0.002) The bright elliptical G to the NNW of the radio centroid of this extended source is accepted as the identification. The relatively bright St near the SSW outer contour may be a projected object with P=0.10.
A3827_11a/b. The two St objects within the contours of the double radio source are likely to be projections with P=0.21 and P=0.24 respectively. This is probably a distant FR II radio galaxy.
A3827_14. Within the radio contours are an St (24′′@78∘) and a G (12′′@203∘). Their projection probabilities are P=0.26 and P=0.08 respectively. The G is not bright enough for cluster membership and neither object is an acceptable identification.
A3827_21. (P=0.009) The faint G displaced 5′′ along the major axis to the NNE of the radio centroid is the accepted identification. We discard the bright galaxy 16′′ to the SSE of the radio centroid (2MASX J220158495943068) as the identification for its separation from the radio centroid and for its significant displacement from the major axis of the radio source.
A3827_24a/b. The Sp is unlikely to be a projected object whether identified with component b (P=0.002) or associated with the centroid of the double (P=0.035). The identification in Table 3 is with component b, and is bright enough to be a cluster spiral.
A3827_26. The faint objects near the outer contour of this extended radio source to the east and north of the radio centroid are likely to be projections with P=0.54 and 0.50 respectively.
A3836_9a/b. Neither of the components of this apparent double are resolved at 2.38 GHz and no identification can be detected. If it is a real double, it is probably a distant FR II radio galaxy.
A3836_17. The faint St object to the north of the radio centroid is unlikely to be a projection (P=0.02), but its 7′′ separation from the centroid of the radio source and its offset from the major axis are not consistent with an identification.
A3836_19a/b. (P=0.11) There is a possibility that the faint G between the components is a projected object, but its proximity to the major axis of the double improves the security of the identification. It is not bright enough for a cluster elliptical.
3.5 The physical reality of the suggested identifications
In this paper we are mainly interested in the reality of the galaxy identifications, particularly those that have been identified as cluster members by the process described in Section 3.3.
We have used the galaxy densities listed in Table 1 of Tyson & Jarvis (1979) to derive the probability that a galaxy will be projected by chance onto the area surrounding a radio source in our list. Tyson and Jarvis’s galaxy densities strictly apply to the north galactic pole. Our clusters have values of galactic latitude between and , so that they can be regarded as high-latitude objects, and we assume that there is not a significant difference between galaxy densities in the north and south Galactic hemispheres.
Firstly, looking at the 55 radio sources in Table 3 identified with galaxies having listed blue magnitudes between 15.0 and 22.0, we compute that the total area defined by the circles with radii equal to their listed angular offsets is 6.53 deg2. In this area, Tyson & Jarvis give a density of 2,453 galaxies deg-2. Thus we can expect approximately two out of the 55 coincidences by chance projection.
If we confine our attention to the 32 identified cluster galaxies in Table 3 in the complete sample, with blue magnitudes between 15.0 and 21.0, a similar calculation yields a chance projection of 0.2 galaxies.
We therefore conclude that all the identifications in the complete sample are highly likely to be physically associated.
3.6 The physical reality of the double sources
There are seven sources in Tables 2 and 3 that are listed as double sources. What is the probability that one of the components is a field source that is projected on the area surrounding the other ? The probability of chance projection increases as the flux density decreases and the circular area defined by the radius vector between the components increases.
Using the log N - log S1.4 counts at 1.4 GHz by Wall (1994), we computed for each double the number of sources with the flux density of the weaker component that fall by chance in the area of a circle with radius equal to the angular spacing between the components. Taking into account the range of flux densities and angular spacings in the seven doubles, the probability of chance projection is 0.002. Therefore, we can be confident that these are highly likely to be physical double sources rather than chance projections.
3.7 Source identification statistics
Table 4 provides a summary of the types of optical object identified with the 149 sources listed in Tables 2 and 3. These are all the sources that can be detected at 1.38 GHz within the FWHM circle of the ATCA primary beams.
| Cluster | Non-cluster | Star-like | Blank | Total |
|---|---|---|---|---|
| galaxies | galaxies | objects | fields | |
| N=32 | N=21 | N=14 | N=82 | N=149 |
| 22 % | 14 % | 9 % | 55 % | 100 % |
Only for seven of the nine galaxies with measured redshifts in Table 3 are their redshifts commensurate with those of the clusters on which they are projected. The remaining 25 galaxies are allocated to the clusters on the basis of their absolute -band magnitudes as explained in Section 3.3.
Very few of the 21 galaxies in the second column of Table 4 are bright enough to be members of the cluster on which they are projected, and so are named “non-cluster galaxies”. There are three spirals included, two of which possess measured redshifts, which place them in the foreground; the third spiral in this group may be a cluster member. All 14 star-like identifications (St) in Table 4 are fainter than =18.1, making it difficult to distinguish between AGN, compact ellipticals and, less likely, real stars.
Adding the number of identifications in the first three columns of Table 4, we find the identification rate to be 45%. Prandoni et al. (2001) searched a 3 deg2 area of their ATESP Survey for identifications with optical objects detected in the ESO Imaging Survey (EIS) by Nonino et al. (1999). Confining our attention to Prandoni et al’s radio sources with 1.4-GHz flux densities 1 mJy, we see in their Table 2 that their identification rate for all optical morphologies was 67%. Our lower rate of 45% is most likely due to their access to a more sensitive optical survey; had a similar survey been available to us, we would have found significantly fewer blank fields.
4 Derived parameters
In this section we shall be comparing the derived spectral indices, radio powers and absolute red magnitudes of the 32 identified cluster sources in Table 3 with a similar set of parameters published by Slee et al. (1998) and derived from VLA observations in scaled C and D arrays at 1.5 and 4.9 GHz respectively. Their’s was a radio-selected sample of 28 Abell clusters, in which an earlier lower-resolution survey at 80 and 160 MHz by Slee & Siegman (1983) had shown a steep-spectrum radio source within a few arcmin of the Abell cluster centre. The VLA survey of these clusters found 59 identified cluster radio galaxies out to their limiting angular radius of 0.5 at 1.5 GHz, but fourteen of them could not be detected at 4.9 GHz due to both their generally steep spectra and the fact that they fell outside the FWHM primary beamwidth of the VLA dishes at 4.9 GHz.
4.1 The radio spectra
Using the flux densities measured by us, as well as literature data from other surveys (extracted from CATS, cats.sao.ru), we plotted radio continuum spectra for all sources. For those with flux densities in three or more (at most five) frequency bands, we visually classified their shape into three classes, as listed in column (13) of Table 2: C: convex spectrum (steepening with increasing frequency); C: concave spectrum (flattening with increasing frequency); Cpx: complex, including a few sources with relative minima or maxima; we do not make any mention in this column if the spectrum is consistent with a straight power law. The spectral indices quoted in columns (11) and (12) are always from straight power-law fits. For a few sources (A2837_10, A3126_11, A3827_5, A3836_18) our 1.38-GHz flux causes a pronounced minimum in their spectrum. We searched for instrumental reasons or reduction problems to explain these, but could not find any.
In order to check our flux densities for the deleterious effects of “CLEAN bias”, we examined some suggestions by Condon et al. (1998) and Prandoni et al. (2000) for keeping this bias to a minimum. It is clear that one needs to keep sidelobes of field sources to a minimum and to terminate the cleaning process while its residual rms is still well above the the theoretical system noise. In our analysis we had used uniform weighting to form the dirty maps and we had terminated the de-convolution at a cut-off equal to 4 times the theoretical rms. In order to estimate the magnitude of the bias, we also cleaned the dirty maps down to a cut-off equal to the theoretical rms, and we compared the peak flux densities at cut-offs of 4 and 1 times the theoretical noise for sources with 1.38-GHz flux densities 2.5 mJy in Table 2, resulting in mean values of (peak/peak) that varied between 1.060.04 for the three self-calibrated maps to 1.120.12 for the remaining four maps, where the errors quoted are standard deviations. Therefore, we can confirm that CLEAN bias is present in the lower cut-off cleaned maps, but is probably negligible at the 4 rms cut-offs that were used for the flux densities in Table 2, and would be obscured by the errors in measuring these low flux densities.
We also point out that three of the four anomalously low flux densities were found in fields that were not subjected to self-calibration, and the uv coverage was not unusually poor in these seven fields south of with 7–9 half-hour integrations over the full range of hour-angles.
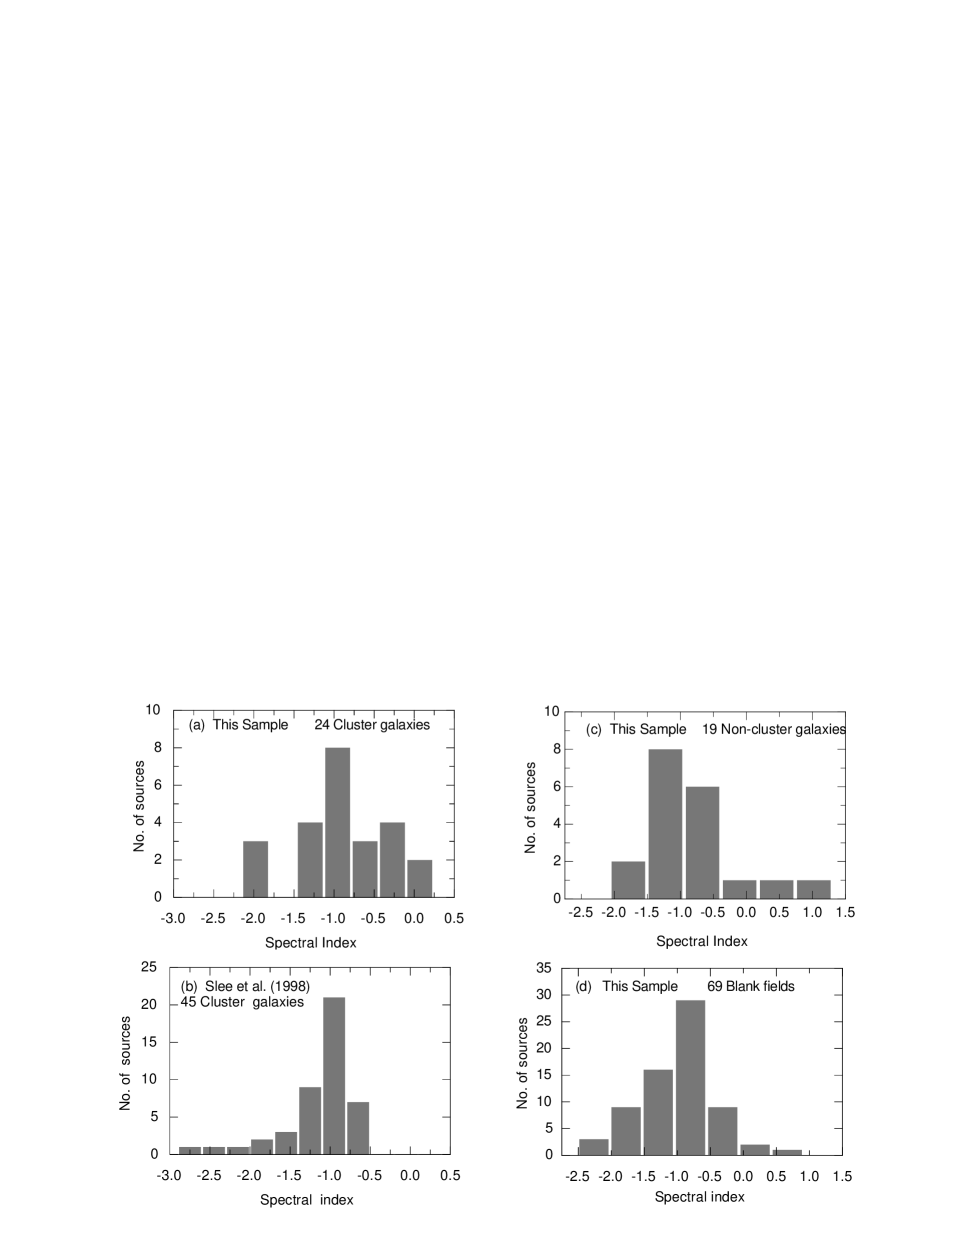
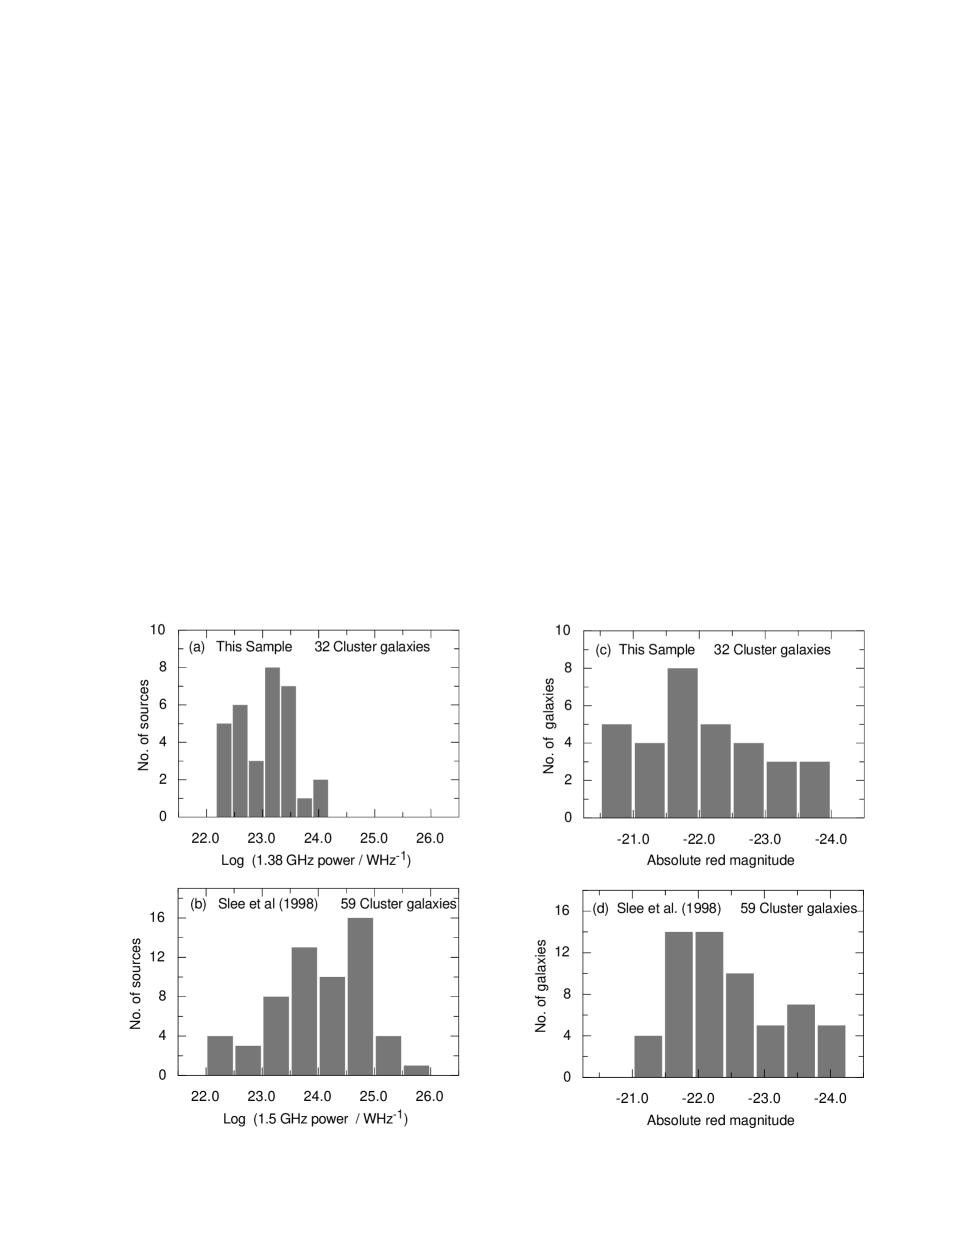
Figure 4 is a mosaic of four histograms of the spectral indices for a variety of identification classes; separate plots are shown for radio sources identified with cluster galaxies, non-cluster galaxies and optically empty fields. The median spectral indices are 0.87 (Fig. 4a), 1.02 (Fig. 4b), 0.96 (Fig. 4c), and 0.93 (Fig. 4d). Kolmogorov-Smirnov ranking tests on the data contributing to these pairs of histograms indicate that (a) and (b) are significantly different (=0.03); this difference is clear from an inspection of Figure 4, with the identified cluster sources from the X-ray sample (a) possessing a bias towards flatter spectrum sources, which is reflected in their median spectral indices. The only other marginally significant difference (=0.08) is between the pair of histograms (b) and (d).
4.2 Radio power and absolute -band magnitude
Figure 5 is a montage of four histograms depicting the radio powers and absolute -band magnitudes of two samples of identified cluster galaxies. The first sample comes from the present seven X-ray-selected clusters, the second sample is from the radio-selected clusters from Slee et al. (1998).
The X-ray sample (a) has a median 1.38-GHz power of log(P/W Hz-1)=23.08, which is an order of magnitude lower than that of the radio sample (b) with a median power of log(P/W Hz-1)=24.07. This significant difference is amply confirmed by a Kolmogorov-Smirnov test on their data-distributions, with the probability that they originate from the same parent populations of 0.005. This result is not unexpected, as the clusters that contribute to sample (b) were selected because their optical centres were close to strong radio sources.
The corresponding distributions of absolute -band magnitude for the galaxies identified with radio sources are shown in Figure 5, panels (c) and (d), and are not significantly different, with the probability that they originate in the same parent population of =0.26; the median values of for (c) and (d) are 21.93 and 22.34 respectively. This relatively small difference suggests that the radio and optical power outputs of cluster galaxies are not closely related. This is already obvious from the fact that most of the relatively bright galaxies in both samples of clusters are not identified with radio sources at the 1 mJy level at 1.38 and 2.38 GHz, a conclusion that will be made clearer when the fractional radio luminosity function is discussed in Section 4.6.
4.3 Radial variation in source density
The degree of concentration of cluster radio galaxies towards the cluster centre is an important parameter that is probably influenced by the evolution of their host galaxies and the radial variation in intracluster gas density. Slee et al. (1998) showed the radial variation in projected source density as function of the logarithm of the projected cluster-centric distance, in units of an Abell radius (r/), in their Figure 4. Here, we compare that result with a similar analysis of the present X-ray sample.
We counted cluster sources in equal increments of angular radius centred on the seven X-ray cluster centroids out to the Abell radius of 2 Mpc. Adding the numbers of sources in each angular increment produces the histogram in the top left panel of Figure 6. Adjusting the numbers for the projected areas of the annuli (in units of Mpc2), we show the projected source density as a function of log r/ in panel (b) of Figure 6.
Panels (c) and (d) of Figure 6 show the corresponding results from the radio sample of Slee et al. (1998). Due to the larger number of cluster sources available (59 versus 32 for the X-ray selected sample), we were able to use a smaller increment in r/. The slope of the fitted line in this sample is 0.06.
Other determinations of the concentration of sources towards the cluster centres have been made by Mills & Hoskins (1977), Slee et al. (1983), Robertson & Roach (1990), Andernach & Andreazza (1990), Unewisse (1993), and Ledlow & Owen (1995a). These studies utilized surveys with widely varying sensitivities and angular resolutions, but all of them (except the one in Fig. 1d of Andernach & Andreazza 1990) derive radial plots with slopes similar to or steeper than those in panels (b) and (d) of our Figure 6.
The 1.4-GHz survey of Ledlow & Owen (1995a) is closest in frequency, angular resolution and sensitivity to the ATCA and VLA data plotted in panels (b) and (d) of Figure 6. We have replotted the FR I data shown in their Figure 2A with logarithmic axes (the numerical value of their last bin was difficult to read with enough accuracy and so was omitted); after fitting a straight line to their points we derive a slope of , which is significantly steeper than those of our Figures 6b and 6d. Evaluating the regression equation yields a projected source density at r/=0.03 of 10 Mpc-2, which is similar to our values from panels (b) and (d), but because of the steeper slope the projected source densities at r/=1 are four to eight times lower, respectively. The difference between our radial dependencies in Figure 6 and those of Ledlow & Owen are probably due to our samples having flux-density cut-off levels of 1.0 and 2.0 mJy, respectively, compared with 10 mJy for the VLA sample of Ledlow & Owen. Our higher sensitivity results in twenty-six of our 32 identified cluster radio sources having flux densities below 10 mJy, and twenty of those fall outside the 0.3 limit of Ledlow & Owen’s complete sample. We contend that Ledlow & Owen’s projected cluster source densities are not taking into account a significant population of less powerful cluster radio sources.
An important task is to establish the average projected density of background sources in order to derive the excess of cluster radio sources with respect to the background. Our initial approach to this problem was to plot the log of the average projected source density of the 117 “non-cluster” sources (see Table 4) against log r/. Fig. 6e shows their distribution in r/, while the dashed line in Fig. 6f outlines their projected source density as a function of log(r); this line appears to show the presence of another unexpected population of cluster sources. A second approach was to use the source statistics of Prandoni et al. (2001) from their ATESP survey of 26 deg2 of the southern sky; these authors used the AT Compact Array in a similar configuration to that of our seven-cluster survey. We counted their radio sources with 1.4 GHz flux density 0.99 mJy (the lower limit of our survey) to derive an average source density of 72 deg-2; this figure results in a projected source density of 1.59 sources Mpc-2, assuming H0=75 km s-1 Mpc-1. For comparison, our 149 sources in seven clusters result in an average projected source density of 77 deg-2, indicating a surprising level of agreement between two independent surveys. A dotted horizontal line corresponding to this source density is shown in Fig. 6f.
We see that the dotted line passes close to most of the points in Fig. 6f, suggesting that our “non-cluster” source density is close to the background density. The slope of 0.12 is not convincingly different enough from the zero slope of the ATESP background to support the existence of another population of cluster radio sources, although there is almost certainly a fair proportion of spiral galaxies included in our seven clusters. If we consider only the eighteen G and E “non-cluster” identifications in Table 4, we find that, if we locate them within their relevant clusters, they would have a median 19.48 and a median log P1.38/W Hz-1=22.91. This value of is about 1.5 magnitudes lower than that found by Hummel (1981) for the median absolute red magnitude of 280 local spirals of all classifications, and the value of log P1.38 exceeds the high-power end of his fractional radio luminosity function. Extending this type of analysis to the 82 empty fields in Table 4, only accentuates the difference between Hummel’s spirals and our non-cluster sample of radio galaxies. We therefore conclude that very few of the sources contributing to the dashed line in Fig. 6f can be spirals of the type seen in the local volume.
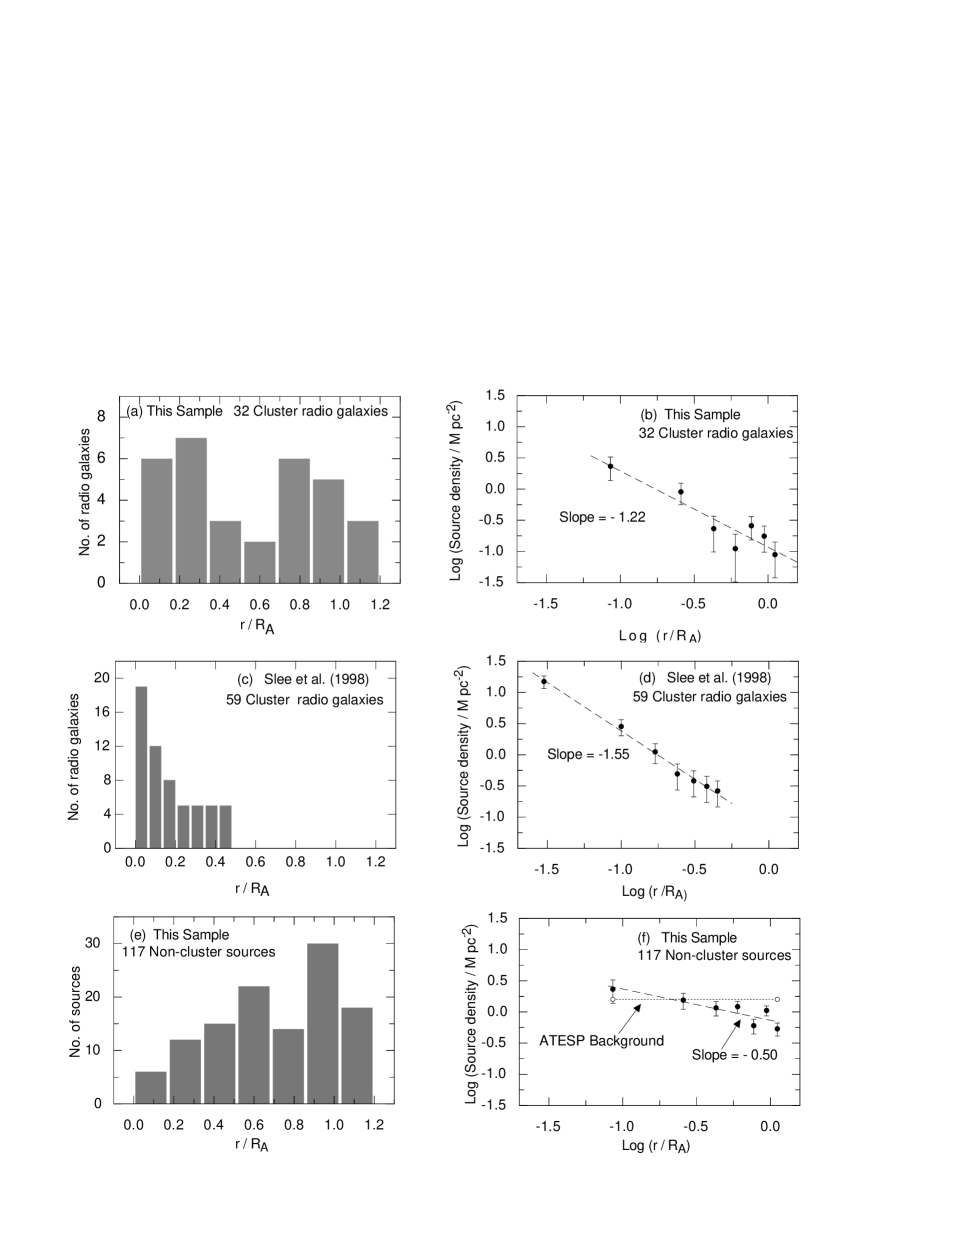
We accept that the background source density at 1.38 GHz is 1.59 Mpc-2 as defined by the horizontal dotted line in Fig. 6f. Thus referring to Fig. 6b, we find that the average projected source density near the cluster centres (at ) for ellipticals in our X-ray sample is 5.0 times the projected source density of background radio sources.
We can conclude this section by stating that the higher intracluster gas density of our X-ray selected sample does not appear to significantly affect either the central excess density of radio sources above the background or its variation with projected radial distance from the cluster centre.
4.4 Correlation between radio and optical power
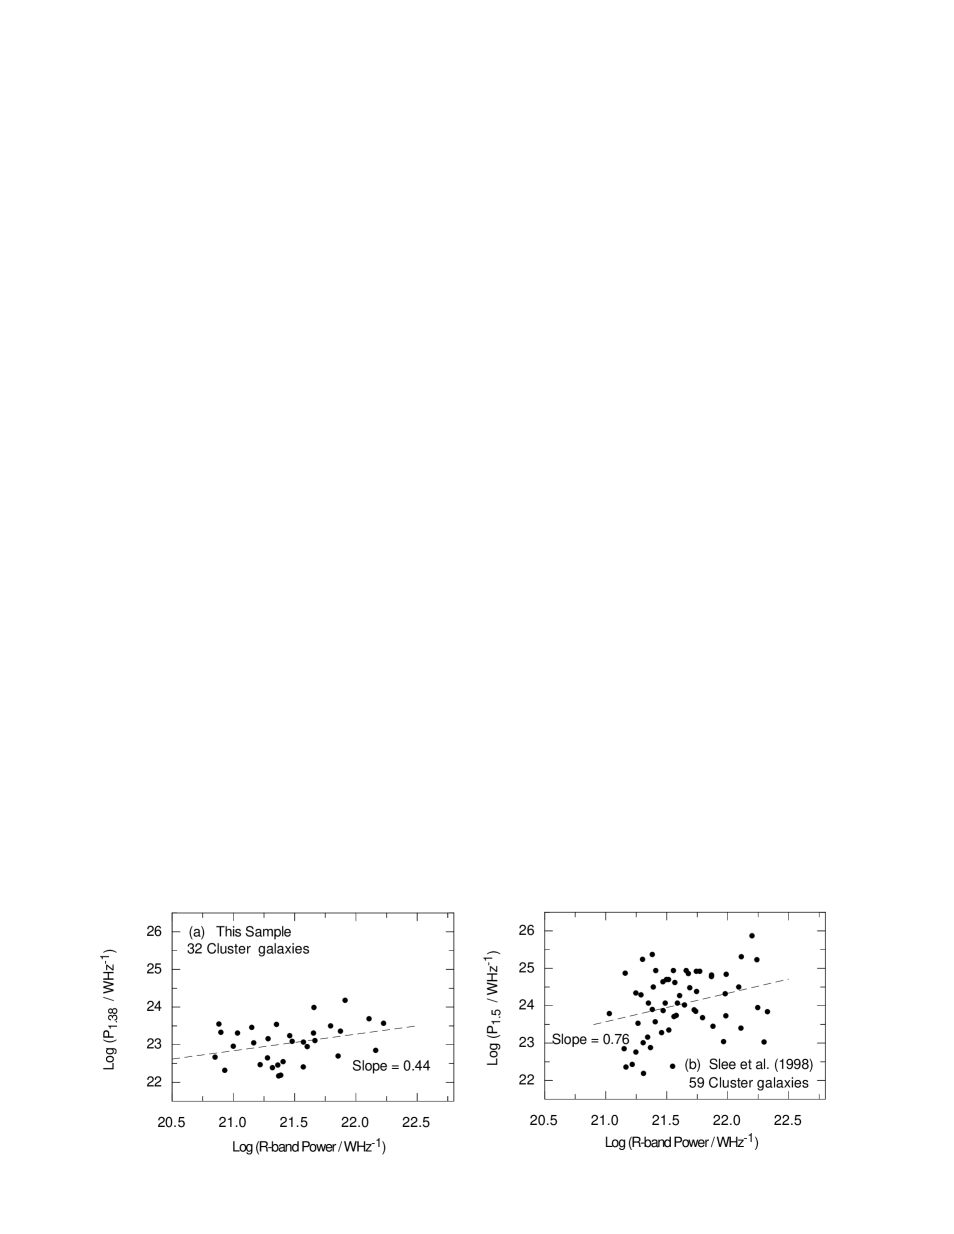
We have already shown in Section 4.2 and the histograms in Figure 5 that while the distributions in the radio powers of the X-ray selected and radio-selected samples are very different, their distributions in absolute -band magnitude cannot be readily distinguished. This fact alone implies that there should not be a strong correlation between radio and optical power in either sample. In order to keep the same units on the axes of the correlation plots we have transformed -band luminosity to -band power. Here, we examine the detailed correlation between radio and optical powers in the two samples.
Figure 7 shows the correlation between radio power and -band power for the present X-ray sample in panel (a) and for the radio-selected sample of Slee et al. (1998) in panel (b); the former and latter samples show reasonably well-defined correlations with significance levels of 9% and 3% respectively. The slopes of the regression lines in (a) and (b) are 0.440.24 and 0.760.33 with a weighted mean of 0.55. Due to the overlap in the error bars in the slopes of the samples, it is not possible to show from the correlations in Figure 7 whether the slopes of their regression lines differ significantly.
The observed radio-optical power correlation could be intuitively expected if the more luminous optical galaxies inject more relativistic plasma into the radio lobes via the jets. However, it would be naïve to propose that this is the only influence on the emitted radio power. Indeed, the correlation coefficient of =0.29 in the data of Figure 7b implies that only 8% of the variance can be attributed to this correlation. Additional evidence for these correlations for FR I radio galaxies is provided in the plots of log P in Figure 3 of Ledlow & Owen (1996), although these authors do not attempt to fit their scatter diagram with formal regression lines. As is the case for our data, these authors show that there is no strong relationship between radio power and , which they attribute to the fact that one sees radio sources in all stages of their evolution.
4.5 Correlations between various radio parameters and r/
4.5.1 Correlations between radio and optical parameters and Abell radius
There is little firm evidence that radio spectral index, radio power and red optical power are highly dependent on angular distance from the cluster centre (r/). This is true of both the present X-ray selected sample and the radio-selected sample of Slee et al. (1998). We tabulate the significance levels of the various correlations for our X-ray selected sample below:
| 1. | Spectral index vs. r/ | 26% |
| 2. | Log P1.38 vs. r/ | 86% |
| 3. | Log PR vs. r/ | 10% |
Very similar levels of significance were obtained for the corresponding correlations in the radio selected sample of Slee et al. (1998). The only correlation that even approaches a significant level of acceptance in both these samples is that between -band power and r/, with the higher values of -band power favouring the cluster centres. The lack of a significant correlation between spectral index and r/ is rather surprising in view of the fact that lower angular resolution studies by Baldwin & Scott (1973), McHardy (1979) and Reuter & Andernach (1992) have shown that radio spectra tend to be steeper closer to the cluster centre.
4.5.2 Correlations of radio and -band power with X-ray luminosity
There are only seven clusters in the X-ray sample and 28 clusters in the radio sample of Slee et al. 1998, and, furthermore, only sixteen of the latter possess published values of X-ray luminosity. The only possible method of examining the relationships of radio and -band power with X-ray luminosity is to sum the radio and -band powers from the identified cluster sources and plot these sums against the the X-ray luminosities of the corresponding clusters. The X-ray luminosities were obtained from the published ROSAT (RASS) surveys by Ebeling et al. (1996, 1998, 2000), Böhringer et al. (2000, 2004), De Grandi et al. (1999), Cruddace et al. (2002), Ledlow et al. (2003) and David, Forman & Jones (1999). The published X-ray luminosities were corrected to H0 =75 km s-1 Mpc-1, and duplicated values for the same cluster were averaged.
We found no significant correlation between the summed radio and -band powers and the corresponding X-ray luminosities for the present X-ray selected sample, with levels of chance probability of 82% and 60% respectively. The larger radio-selected sample of 16 clusters from Slee et al. (1998) yielded a chance probability of 65% for the correlation of summed radio power, and the more significant value of 6% for the correlation of -band power; the linear regression of summed -band power on X-ray luminosity has a slope of 0.49. These would be important relationships to better establish, but it is clear that this will need much larger samples of clusters with measured X-ray luminosities.
4.6 Radio luminosity functions
Our seven X-ray clusters provide only 32 optically identified cluster members with which to construct a fractional radio luminosity function (FRLF). The FRLF is intended to show what fraction of E/S0 galaxies in the seven clusters are detected radio emitters above the flux density limit of the survey. It is a differential luminosity function in that the fraction of radio emitters is computed separately for each of a number of bins of increasing radio power.
First, it is necessary to establish the total number of E/S0 galaxies that are likely to be cluster members. Up to the present, no attempt has been made to morphologically classify the galaxies that are present within the Abell radius of each of our clusters in a manner similar to that of Dressler (1980), who did so for 55 rich clusters. Digital processing of sky survey plates can provide a reliable set of blue, red and infra-red magnitudes and also classify the objects as galaxies or star-like. We have used arguably the best of these digital catalogues, SuperCOSMOS, to select E/S0 cluster galaxies for the purpose of normalizing our bin-counts of optically identified cluster radio sources. The process consists of the following steps:
(1) Select from Table 3 the E, cD, D and S0 galaxies within one Abell radius of the clusters’ X-ray centres, including the designated radio/optical identifications; this involves our computing the absolute -band magnitudes, , of the relevant objects on the assumption that galaxies within the clusters will have 20.6 (as explained in Section 3.3). A total of 42 galaxies was selected.
(2) Find the mean value of colour index =1.660.39 (standard deviation) for these 42 galaxies using and from columns (3) and (4) of Table 3.
(3) For each cluster, search the Abell area about the cluster centre in SuperCOSMOS, selecting objects with mean class = 1 (galaxies), magnitude for which 20.6 at the redshift of the cluster, and 1.27; the last constraint comes from (2) above.
The application of the above constraints resulted in our selecting between 101 and 263 galaxies for each of the seven clusters with a total of 1158 galaxies. We think the great majority of them will be E/S0 galaxies because of two reasons: spirals usually possess 20.5 and their values are considerably less than those of ellipticals at the same redshift.
The radio powers were allocated to bins, each of width 0.40 in log P1.38 and the totals summed over the six bins. In this process, not all clusters could contribute to each bin; only those clusters with redshifts low enough to ensure that the radio identification would contribute a 1.38-GHz flux density greater than our sensitivity limit of 1.0 mJy could contribute to a particular bin. Thus the first two bins with lowest radio power could utilize only one and four clusters respectively, while the remaining four bins utilized the radio power values from all seven clusters. The fractions relevant to each bin were then computed by dividing the summed numbers of radio sources in each bin by the number of E/S0 galaxies that contribute to each bin.
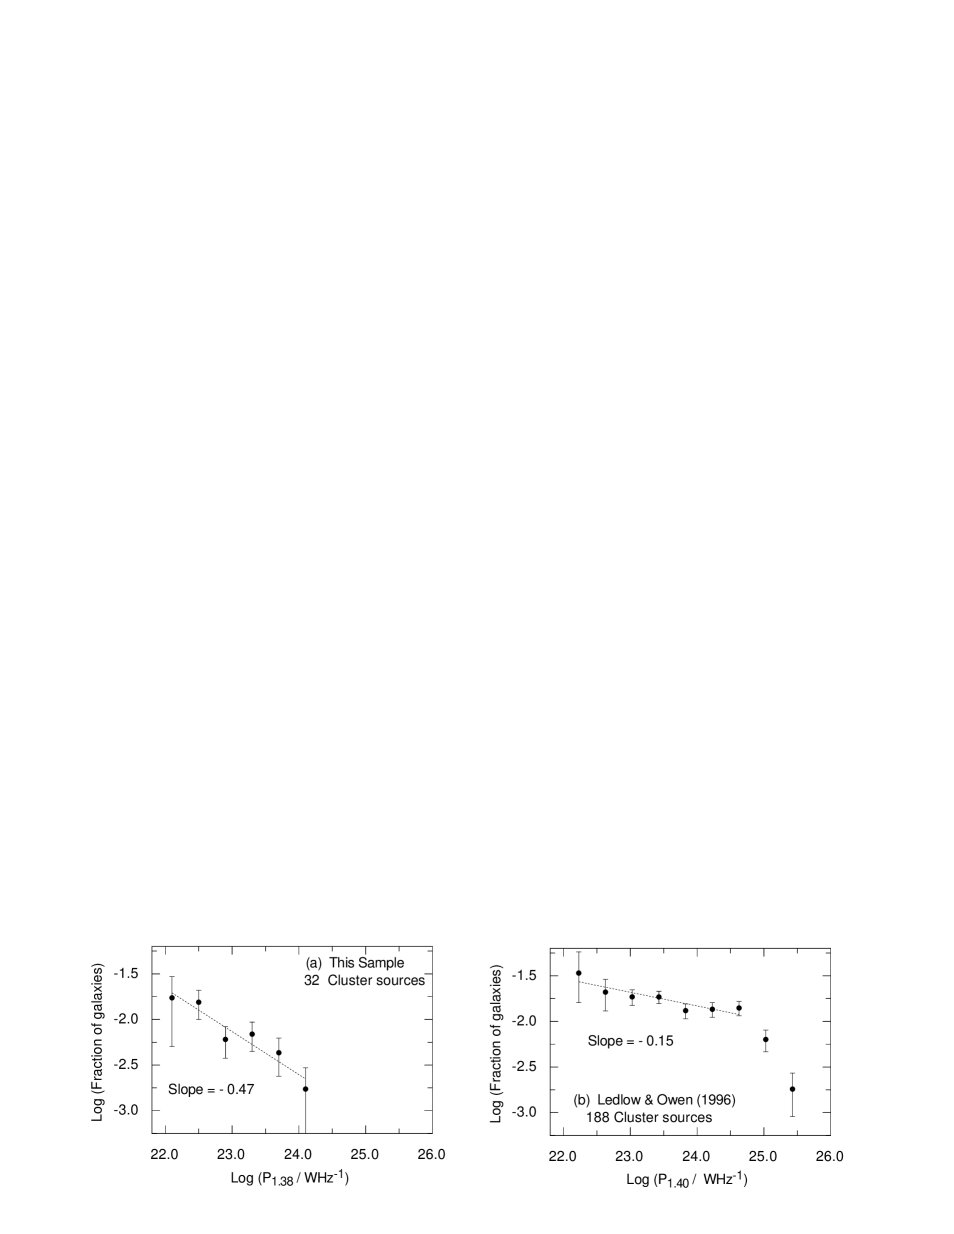
The resulting fractional luminosity function for the present X-ray sample of clusters can be seen in Figure 8a; sampling errors are proportional to (N)-0.5, where N is the number of radio galaxies in each bin. A similar FRLF was shown by Slee et al. (1998) in their Figure 17, but for comparison we prefer to plot in Figure 8b the RLF from Ledlow & Owen (1996), who utilized their data from 137 radio-selected Abell clusters. The major difference in the derivation of these plots is that the data for Fig. 8a come from projected angular distances in the clusters out to r/=1.0, while Fig. 8b includes data out to only 0.30 r/, and clusters with redshifts 0.09. The linear regressions in Figs. 8a and 8b are fitted to sections of the luminosity functions to which they seem appropriate.
The obvious differences between Figs. 8a and 8b are in their ranges of radio power and in the slopes of the lines fitted to the points. The radio-selected sample shown in Fig. 8b contains radio galaxies that are up to 20 times more powerful than those in the X-ray selected clusters in Fig. 8a; this is rather surprising when one considers that the explored cluster volume in the X-ray sample of Fig. 8a is 1.9 times that of the radio-selected sample in Fig. 8b. One could argue that this discrepancy is due to the much larger number of clusters in Owen & Ledlow’s sample, and to the fact that they are exploring cluster volumes nearer the cluster centres, but we have shown in Section 4.5.1 that the radio power of identified cluster sources does not significantly increase towards lower values of r/. Ledlow & Owen (1996) claim that the break in their FRLF near log (P1.4/W Hz-1)=24.6 denotes the onset of the FR II phenomenon. It is clear that our X-ray sample contains only the weaker FR I radio galaxies, but, like the radio-selected sample of Ledlow & Owen in panel (b), the radio-selected sample of Slee et al. (1998) also contains three FR II radio galaxies.
The next feature of interest concerns the slopes of the regression lines in Figures 8a and 8b. Those slopes are 0.08 and 0.03 for the X-ray and radio samples respectively. The two plots begin with similar values (0.017 and 0.034 respectively) of fractional luminosity near 1022 W Hz-1, but the X-ray sample (a) falls rapidly to 0.0017 in the highest radio power bin, while the radio sample of Ledlow & Owen falls to only 0.014 over the same power range. The alternative radio sample of Slee et al. (1998) in their Figure 17 has a similar very small slope of 0.06 over the FR I range and then rapidly steepens to a slope of 0.6 over the FR II range. One might question whether the respective luminosity functions are influenced significantly by the different ranges of angular distance used in their compilation. It seems unlikely that this factor has a great influence; Figure 6 in Section 4.3 shows that the radial variation in projected source density for the X-ray sample (Fig. 6b), based on sources to r/=1, is nominally less steep than that of the radio sample (Fig. 6d), drawn from sources out to r/=0.50, although the difference in their slopes is not very significant.
We conclude that this X-ray sample has a fractional luminosity function for radio galaxies that falls much more rapidly than that of radio-selected samples; in other words, a much smaller fraction of the E/S0 galaxies in the X-ray sample gives rise to high-power FR I radio galaxies, and none of the cluster galaxies is host to an FR II radio source. The implications of this result will form part of the discussion.
5 Discussion
Our results do not encompass a sufficiently large range of redshift, nor are there a sufficient number of clusters, to search for evolution in strong X-ray emitting clusters, but we can draw a few conclusions about the effects of the cluster environment on the evolution of galaxies and their associated radio sources.
First, 25% of the identified cluster radio sources possess spectral indices more positive than 0.50, which are distributed over the full range of angular distances out to the Abell radius. Such flat or even rising spectra are also associated with the active nuclei of isolated E/S0 galaxies (cf. Slee et al. 1994); therefore it seems likely that a significant proportion of radio sources in strong X-ray clusters may be undergoing an active phase, perhaps because their black holes are fuelled by the copious intracluster gas, although there is no clear tendency for them to favour the inner regions of these clusters where the gas density is highest.
Both Slee et al. (1998) and Ledlow & Owen (1996) found a positive relationship between radio and optical powers, and the effect is present, but with lower significance, in our small X-ray sample. The radio and optical powers are not strongly correlated for individual galaxies; cuts through Figures 7a and 7b at constant -band power shows a large variation of at least an order of magnitude in radio power. The interpretation of these data is very model-dependent. One can reasonably assume that the ages of FR I radio sources are at least an order of magnitude lower than that of their host galaxies, but the effect of the host galaxy’s gas content, and of the intracluster gas density, on the evolution of an FR I’s jets and lobes are largely unknown. If one also assumes that the optical luminosity of the host galaxy is fairly constant over the lifetime of the radio source, and that its radio power evolves with time as the source expands into its local environment, then the density of points along a line of constant optical power represents the amount of time radio sources spend in that state. Unfortunately, we do not have enough data from this small X-ray-selected sample of clusters to construct a bivariate luminosity function, which would show the rate at which radio power evolves at various values of optical luminosity.
The fraction of E/S0 galaxies in the optical and radio samples of Ledlow & Owen (1996) and Slee et al. (1998), respectively, that host FR I radio galaxies at a particular epoch is generally 0.013–0.025. Ledlow & Owen (1996) show that this fraction seems to be independent of the environment, i.e., whether the E/S0 galaxies are in clusters or in the general field. In addition, the integrated bivariate radio luminosity functions of Ledlow & Owen (1996) and Slee et al. (1998) indicate that the detectable fraction increases with the optical luminosity of their host galaxies over the complete range of FR I power. If we add to these facts that Ledlow & Owen (1996) find from surface photometry that the hosts of cluster FR I galaxies are optically indistinguishable from radio-quiet cluster galaxies down to their sensitivity limit at 1.40 GHz of 10 mJy, then clearly the optical power output is a sufficient and necessary condition for the production of an FR I radio galaxy. It then follows that fainter E/S0 galaxies with 20.5 (the limit of the present samples) will be detectable with similar frequency at 1.38-GHz radio powers below 1022 W Hz-1. None of these parameters is inconsistent with the suggestion that all E/S0 galaxies, whether in or out of clusters, will host an FR I radio galaxy at least once during their lifetimes.
A notable difference between our X-ray sample and the radio/optical samples is our failure to detect a single FR II cluster radio galaxy. FR II sources are found with equal frequency both in clusters and in the general field (Ledlow & Owen, 1996) and are characterized by two parameters: (1) log (P1.4/W Hz24.0, (2) edge-brightened lobes, caused by the interaction of the jets with the surrounding gas. The FR II phenomenon is not confined to the brightest galaxies, but is found also in ellipticals down to a luminosity of 21.0, which encompasses practically all the identified cluster galaxies in our X-ray sample and the radio samples of Slee et al. (1998) and Ledlow & Owen (1996). If FR II sources had been contained within our X-ray selected sample, we had the necessary angular resolution, especially at 2.38 GHz, to resolve their outer hot spots from the general lobe structure to confirm the evidence provided by the steepening of the RLF in the samples of Ledlow & Owen (1996) and Slee et al. (1998). Ledlow & Owen (1996) listed 18 FR II radio galaxies in their complete sample, which surveyed a projected sky area of 155 Mpc2. Slee et al. (1998), in their sample out to r/RA=0.5, surveyed a projected area of 71 Mpc2. Therefore, if the radio sources in these two samples had been drawn from the same populations, we would have expected to detect (71/155)18=8.2 FR II’s and we detected nine FR II’s. The present X-ray sample surveyed a projected area of 88 Mpc2, so we should have expected to detect (88/155)18=10.2 FR II’s, but we found none.
It seems probable that the higher luminosity X-ray clusters are deficient in FR II radio galaxies, although no apparent reason is evident, as there is more than sufficient intracluster gas with which the jets can interact to cause edge-brightening. Perhaps the higher gas density inhibits the formation of long jets. If this is a valid phenomenon among clusters, then the clusters containing FR II sources should possess significantly lower values of than those containing only FR Is. We have searched for this effect in the radio samples of Slee et al. (1998). If we consider the median values of in their radio sample out to 0.50 r/, for the seven clusters containing FR II sources and the 21 clusters containing only FR Is, we find (including upper limits of 0.2 W for the 12 clusters that were well surveyed with ROSAT in the 1RXS catalogue, but not detected) that the medians for the FR II and FR I clusters are 0.2 and 0.81 W respectively. This result suggests that low values of are associated with FR II sources and intermediate values of with FR Is. This conclusion is reinforced when we compare the above results with the median value of W in the present X-ray selected sample, in which no FR IIs are found. There is, however, an exception to this trend in Slee et al’s radio sample, in which an FR II is present in one cluster with W. Clearly, larger samples of X-ray selected clusters and their associated sources need to be examined before a firm decision can be made.
The lack of FR II radio galaxies in our present sample is consistent with the scenario advanced by Hardcastle et al. (2007) for the powering of jets in low and high-powered radio galaxies. The FR I’s are seen as low-excitation objects, which lack the narrow-line optical emission expected from conventional AGN. In a diagram of K-band vs. 151-MHz luminosity (Fig. 1 of Hardcastle et al.), these galaxies congregate in the area occupied by low to medium values of K-band and radio luminosity. The FR II’s, on the other hand, show the more typical parameters of AGN with high-excitation, narrow-band emission and occupation of the medium-to-high area of the K-band – radio luminosity diagram.
Hardcastle et al. (2007) present a convincing argument that the jets of FR I’s are powered by accretion on to a black hole of hot ionized gas from its surrounding medium. These so-called hot-mode systems require a plentiful supply of hot gas and a massive central black hole. By contrast, the jets of high-excitation galaxies (FR II’s) are maintained directly by cold-mode accretion, and neither need a rich, hot-gas environment nor to be at the bottom of a deep potential well, allowing galaxy mergers (ellipticals with spirals) to take place.
It therefore seems likely that galaxy clusters with strong X-ray emission, implying the presence of a dense, hot ionized gas, will possess the required features to fuel the jets of FR I’s. If this model is true, then there should be an X-ray luminosity below which the jets of FR I’s are not so readily fueled. This means that the radio-selected samples of galaxy clusters will contain a mixture of FR I’s and FR II’s, as is reported in the present paper.
In a survey based on ROSAT-PSPC data of a large optically selected sample of clusters with ACO richness class R2, David et al. (1999) showed that the dominant correlation was between and ACO galaxy count (i.e., richness); for a given optical richness there is also a correlation between and Bautz-Morgan type, with BM I clusters being the most luminous. No obvious relationships of this kind are seen in our present sample of clusters, which encompasses Bautz-Morgan types from I to III, ACO richness classes from 0 to 2, and with its X-ray luminosities restricted to a small range of 2.65:1. It can be said, however, that the median X-ray luminosity of 2.32 W is comparatively high for a sample that has such diverse values of Bautz-Morgan type and optical richness.
Acknowledgements
The Compact Array is part of the Australia Telescope, which is funded by the Commonwealth of Australia for operation as a National Facility managed by CSIRO. The MOST is operated by the School of Physics with the support of the Australian Research Council and the University of Sydney. We acknowledge our extensive use of the SuperCOSMOS database, and we also used the CATS database maintained at the Special Astrophysical Observatory, Russia. HA acknowledges financial support from CONACyT grant 40094-F, as well as help with preparing radio spectra from A. Maldonado and S. Jeyakumar. We are indebted to B. Komberg for valuable discussion and A. C. Edge for useful advice. We thank the anonymous referee for a careful reading and various suggestions that helped improve the text.
References
- Abell et al. (1989) Abell, G. O., Corwin Jr., H. G. & Olowin, R. P. 1989, ApJS, 70,1
- Andernach & Andreazza (1990) Andernach, H. & Andreazza, C. M. 1990, Rev. Mex. Astron. Astrof., 21, 136
- (3) Baldwin, J. E., & Scott, P. F. 1973, MNRAS, 165, 259
- (4) Bock, D. C.-J., Large, M. I., & Sadler, E. M. 1999, AJ, 117, 1578
- (5) Böhringer, H., Voges, W., Huchra, J. P., et al. 2000, 129, 435
- (6) Böhringer, H., Schuecker, P., Guzzo, L., et al., 2004, A&A, 425, 367
- (7) Clarke, J. N., Little, A. G., & Mills, B. Y. 1976, AuJPA, 40, 1
- (8) Colless, M., & Hewett, P., 1987, MNRAS, 224, 453
- (9) Condon, J. J., Cotton, W. D., Greisen, E. W., et al. 1998, AJ, 115, 1693
- (10) Cram, L., & Ye, T. 1995, AuJPh, 48, 113
- (11) Cruddace, R., Voges, W., Böhringer, H., et al. 2002, ApJS, 140, 239
- (12) David, L.P., Forman, W., & Jones, C. 1999, ApJ, 519, 533
- (13) De Grandi, S., Böhringer, H., Guzzo, L., et al. 1999, ApJ, 514, 148
- (14) De Grijp, M. H. K., Keel, W. C., Miley, G. K., Goudfrooij, P. & Lub, J. 1992, A&AS, 96, 389
- (15) Dressler, A. 1980, ApJS, 42, 565
- (16) Ebeling, H., Voges, W., Böhringer, H., et al. 1996, MNRAS, 281, 799
- (17) Ebeling, H., Edge, A. C., Böhringer, H., et al. 1998, MNRAS, 301, 881
- (18) Ebeling, H., Edge, A. C.; Allen, S. W., et al. 2000, MNRAS, 318, 333
- (19) Edge, A. C. 2006, priv. comm.
- (20) Fanaroff, B. L., & Riley, J. M. 1974, MNRAS 167, P31
- (21) Frei, Z., & Gunn, J. E. 1994, AJ, 108, 147
- (22) Gregory, P. C., Vavasour, J. D., Scott, W. K., & Condon, J. J. 1994, ApJS 90, 173
- (23) Haigh, A. J. Robertson, J. G., & Hunstead, R. W. 1997, PASA 14, 221
- (24) Haigh, A. J. 2000, PhD thesis, University of Sydney
- (25) Hambly, N. C., Davenhall, A. C., Irwin, M. J.,, & MacGillivray, H. T. 2001, MNRAS, 326, 1315
- (26) Hardcastle M. J., Evans, D. A. & Croston, J. H. 2007, MNRAS, 376, 1849
- (27) Hummel, E. 1981, A&A, 93, 93
- (28) Jones, D. H., Saunders, W., Colless, M., et al., 2004, MNRAS, 355, 747
- (29) Jones, D. H., Saunders, W., Read, M., & Colless M., 2005, PASA, 22, 277
- (30) Katgert, P., Mazure, A., den Hartog, R., Adami, C., Biviano, A., & Perea, J., 1998, A&AS, 129, 399
- (31) Large, M. I.,Cram, L. E., & Burgess, A. M. 1991, MNRAS, 111, 72
- (32) Ledlow, M. J., & Owen, F. N. 1995a, AJ, 109, 853
- (33) Ledlow, M. J., & Owen, F. N. 1995b, AJ, 110, 1959
- (34) Ledlow, M. J., & Owen, F. N. 1996, AJ, 112, 9
- (35) Ledlow, M. J., Voges, W., Owen, F. N., & Burns, J. O. 2003, AJ, 126
- (36) Lucey, J. R., Dickens, R. J., Mitchell, R. J., & Dawe, J. A., 1983, MNRAS, 203, 5
- (37) Mauch, T., Murphy, T., Buttery, H. J., et al. 2003, MNRAS, 342, 1117
- (38) McHardy, I. M. 1979, MNRAS, 188, 495
- (39) Mills, B. Y, & Hoskins, D. G. 1977, AuJPh, 30, 509
- (40) Nonino, M., Bertin, E., da Costa, L., Deul, E., et al. 1999, A&AS 137, 51
- (41) Owen, F. N., White, R. A. & Burns, J. O. 1992, ApJS, 80, 501
- (42) Owen, F. N., White, R. A. & Ge, J.-P. 1993, ApJS, 87, 135
- (43) Peacock, J.A. & West, M., 1992, MNRAS, 259, 494
- (44) Perley, R. A. 1979, AJ, 84, 1443
- (45) Prandoni, I., Gregorini, L., Parma, P., de Ruiter, H. R., Vettolani, G., Wieringa, M. H., & Ekers, R. D., 2000, A&AS, 146, 41
- (46) Prandoni, I., Gregorini, L., Parma, P., de Ruiter, H. R., Vettolani, G., Wieringa, M. H., & Ekers, R. D., 2001, A&A, 365, 392
- (47) Robertson, J. G. & Roach, G. J., 1990, MNRAS, 247, 387
- (48) Sault, R. J., Teuben, P. J., & Wright, M. C. H. 1995, in ASP Conf. Ser. 77, 433, San Francisco: ASP
- (49) Schlegel, D. J., Finkbeiner, D. P., & Davis, M. 1998, ApJ, 500, 525
- (50) Slee, O. B. & Siegman, B. C. 1983, Proc. ASA 5, 114
- (51) Slee, O. B., Wilson, I. R. G. & Siegman, B. C. 1983, AuJPh, 42, 633
- (52) Slee, O. B., Sadler, E. M., Reynolds, J. E., & Ekers, R. D. 1994, MNRAS, 269, 928
- (53) Slee, O. B., Roy, A. L., & Savage, A. 1994, AuJPh, 47, 145
- (54) Slee, O. B., Roy, A. L., & Andernach, H. 1996, AuJPh, 49, 977
- (55) Slee, O. B., Roy, A. L., & Andernach, H. 1998, AuJPh, 51, 971
- (56) Tyson, J. A., & Jarvis, J. F. 1979, ApJ, 230, L153
- (57) Tsarevsky, G., et al. 2008, in preparation
- (58) Unewisse, A. M. 1993, PhD thesis, University of Sydney, Australia
- (59) Verkhodanov, O. V., Trushkin, S. A., Andernach, H., & Chernenkov, V. N. 1997, in ASP Conf. Ser. 125, 322, San Francisco: ASP
- (60) Wall, J.V. 1994, AuJPh, 47, 625
- (61) West, R. M., & Frandsen, S., 1981, A&AS, 44, 329
- (62) Wright, A. E., Griffith, M. R., Burke, B. F., & Ekers, R. D. 1994, ApJS, 91, 111
- (63) Zhao, J.-H., Burns, J. O. & Owen, F. N. 1989, AJ, 98, 64
Table 2. The list of radio sources detected in the seven cluster fields.
Source
Radio Centroid
ang.
S
S
S
S
S
S
Spectral
Sp.
Deconvolved Structure
Name
RA, DEC (J2000)
dist.
0.843 GHz
1.38 GHz
2.38 GHz
index
cl.
major minor
P.A.
Note
h m s
r/
mJy
mJy
mJy
mJy
mJy
mJy
′′ ′′
∘
(1)
(2) (3)
(4)
(5)
(6)
(7)
(8)
(9)
(10)
(11) (12)
(13)
(14) (15)
(16)
(17)
A2746 1
00 13 09.69 65 54 05.0
0.90
3.0
1.5
4.04
0.33
2.77
0.31
0.60 .24
A2746 2a
00 13 24.18 65 53 45.3
0.87
1.94
0.37
1.5
A2746 2b
00 13 28.53 65 53 33.5
0.87
0.89
0.16
1.5
A2746 2a/b
00 13 25.55 65 53 41.6
0.87
5.9
1.4
2.93
0.31
1.5
1.42 .53
29.
66
A2746 3
00 13 32.83 65 50 36.3
1.06
6.9
1.4
3.63
0.34
1.5
1.30 .45
A2746 4
00 13 41.54 66 16 23.5
0.88
3.0
1.7
3.47
0.33
3.67
0.42
0.12 .26
A2746 5
00 14 16.20 66 04 21.2
0.03
12.1
1.6
10.0
0.7
8.2
0.5
0.38 .13
3.9 1.9
132
A2746 6
00 14 17.91 66 12 52.5
0.59
2.8
1.4
1.56
0.19
1.09
0.25
0.77 .42
A2746 7
00 14 41.26 66 19 59.9
1.11
14.8
1.3
12.3
0.8
7.7
1.3
0.54 .17
C?
A2746 8
00 15 02.79 65 50 14.2
1.08
115.
4.9
70.4
4.2
39.9
2.7
1.02 .08
5.2 2.6
41
A2746 9
00 15 25.68 66 19 26.7
1.16
11.7
1.2
7.94
0.51
6.7
0.9
0.56 .16
C+?
8.7 7.7
40
A2746 10
00 15 34.31 66 14 20.3
0.88
6.8
1.3
4.61
0.32
2.92
0.65
0.81 .28
A2746 11
00 15 35.49 66 08 54.5
0.64
3.6
1.4
1.98
0.22
1.42
0.39
0.81 .43
A2746 12
00 15 45.26 66 06 35.0
0.64
6.8
1.2
2.85
0.29
2.26
0.28
0.93 .20
C+
A2746 13
00 15 52.62 65 51 37.4
1.16
3.4
0.6
2.92
0.25
4.0
0.31 .40
A2746 14
00 16 22.87 66 06 39.2
0.91
3.3
1.1
1.89
0.24
2.06
0.58
0.35 .41
C+?
A2837 1
00 46 07.73 80 13 54.6
0.93
61.8
2.3
42.5
2.6
32.8
2.45
0.63 .07
7.0 3.2
92
1
A2837 2
00 46 35.33 80 10 53.0
0.90
8.2
1.0
5.17
0.44
3.64
0.53
0.80 .18
A2837 3
00 48 59.61 80 09 55.1
0.62
7.4
1.1
4.41
0.37
2.46
0.45
1.06 .23
A2837 4
00 49 34.52 80 28 00.7
0.79
157.
5.
86.2
5.2
46.2
3.1
1.13 .06
C+?
5.8 2.2
18
2
A2837 5
00 49 53.79 80 00 54.4
0.92
21.9
1.1
16.6
1.1
9.9
1.3
0.69 .12
A2837 6
00 50 47.48 80 15 42.2
0.27
24.6
1.2
15.2
0.9
9.0
0.6
0.97 .08
12. 3.1
39
A2837 7
00 50 58.96 80 32 36.2
0.94
19.5
1.2
10.0
0.8
5.5
1.35 .20
A2837 8
00 51 01.98 80 07 54.1
0.50
6.0
1.4
2.40
0.16
1.2
1.86 .49
20. 9.3
62
A2837 9
00 51 15.82 80 23 26.2
0.46
9.2
1.1
5.47
0.47
3.49
0.40
0.93 .16
A2837 10
00 51 44.50 80 16 45.7
0.15
2.4
1.0
1.16
0.09
1.5
0.2
+0.25: .25
C+?
15. 3.2
104
3
A2837 11
00 52 02.70 80 24 40.9
0.49
3.8
2.25
0.28
1.5
24. 9.6
96
A2837 12
00 52 45.94 80 15 28.7
0.03
5.2
1.0
1.60
0.27
1.11
0.17
1.41 .23
C+
A2837 13
00 53 30.04 80 09 47.8
0.35
3.8
1.21
0.16
1.98
0.29
0.91 .36
A2837 14
00 53 37.45 80 00 36.2
0.85
5.6
1.0
3.07
0.31
3.4
1.22 .42
14. 7.2
55
A2837 15
00 53 53.04 79 57 29.5
1.02
3.8
3.43
0.58
5.5
A2837 16
00 55 02.02 80 16 47.1
0.32
8.3
0.9
4.98
0.34
3.41
0.33
0.85 .14
A2837 17
00 57 32.30 80 26 45.2
0.88
4.5
1.2
2.53
0.43
2.9
1.2 .6
A2837 18
00 57 49.26 80 24 18.8
0.83
9.3
1.1
5.23
0.40
3.6
1.17 .29
A2837 19
00 58 57.95 80 22 13.0
0.93
3.8
2.03
0.19
5.5
A3126 1
03 26 07.45 55 43 34.8
0.91
41.9
1.7
18.2
1.1
1.69 .15
A3126 2
03 26 22.90 55 32 33.9
0.93
224.
7.
142.
9.
91.1
6.2
0.91: .07
C
11. 3.8
135
4
A3126 3
03 26 45.76 55 47 33.7
0.71
5.2
0.9
1.92
0.16
2.02 .39
A3126 4
03 26 56.08 55 41 46.4
0.62
3.8
1.47
0.13
2.8
A3126 5
03 27 31.83 55 24 07.3
0.90
8.5
0.8
6.71
0.54
0.48 .25
A3126 6
03 27 36.03 55 33 29.7
0.55
11.3
1.2
7.13
0.48
4.37
0.41
0.92 .14
A3126 7
03 27 50.50 55 53 33.5
0.55
14.8
1.1
6.93
0.68
3.63
0.30
1.36 .11
A3126 8
03 27 51.33 55 56 43.9
0.66
19.6
1.2
10.6
0.7
8.21
0.63
0.87 .09
C+?
A3126 9
03 27 59.50 55 25 14.9
0.79
8.8
0.7
5.36
0.41
1.01 .22
13. 9.8
38
A3126 10a
03 28 08.08 55 38 20.2
0.26
3.82
0.25
A3126 10b
03 28 09.70 55 38 30.9
0.25
2.50
0.19
A3126 10a/b
03 28 08.74 55 38 24.0
0.26
15.6
1.4
8.13
0.52
6.22
0.47
0.85 .11
17.
128
A3126 11
03 28 17.80 55 46 26.9
0.20
5.1
0.7
1.13
0.15
1.26
0.15
1.26: .17
C+?
5
A3126 12
03 28 25.41 55 55 52.3
0.57
5.2
0.8
2.36
0.21
1.38
0.17
1.24 .19
A3126 13
03 28 30.99 55 42 22.1
0.04
85.4
4.3
52.4
3.5
0.90 .16
19. 11.
115
A3126 13+16
03 28 31.46 55 42 27.3
0.03
169.
7.
93.3
5.9
59.2
3.9
1.03 .08
32. 14.
125
A3126 14
03 28 33.91 55 49 05.3
0.27
4.3
0.9
1.7
0.14
1.52
0.13
0.61 .17
C+
A3126 15
03 28 34.62 56 04 56.7
0.96
57.9
2.2
34.4
2.1
1.06 .15
5.7 3.3
178
A3126 16
03 28 35.83 55 42 44.4
0.01
27.0
1.7
6.67
0.43
0.27 .54
A3126 17
03 28 48.11 55 47 30.1
0.21
3.0
0.7
2.78
0.20
2.50
0.17
0.19 .16
A3126 18
03 28 52.66 55 54 45.2
0.52
10.6
0.9
7.91
0.52
6.09
0.40
0.53 .10
A3126 19
03 29 03.88 55 59 03.9
0.72
4.4
0.7
1.98
0.21
1.62 .39
A3126 20
03 29 10.61 55 38 48.7
0.26
3.8
1.57
0.16
0.5
A3126 21
03 29 21.25 55 48 01.6
0.35
3.8
2.20
0.17
2.62
0.19
0.32 .20
A3126 22
03 29 40.65 55 32 34.1
0.58
208.
7.
150.
9.
113.
7.
0.62 .04
3.4 3.4
6
A3126 23
03 30 00.79 55 25 38.9
0.90
3.8
2.28
0.24
1.3
Table 2. (continued) Source Radio Centroid ang. S S S S S S Spectral Sp. Deconvolved Structure Name RA, DEC (J2000) dist. 0.843 GHz 1.38 GHz 2.38 GHz index cl. major minor P.A. Note h m s r/ mJy mJy mJy mJy mJy mJy ′′ ′′ ∘ (1) (2) (3) (4) (5) (6) (7) (8) (9) (10) (11) (12) (13) (14) (15) (16) (17) A3126 24 03 30 04.18 55 29 45.8 0.77 3.7 1.0 2.20 0.20 1.4 1.05 .58 A3126 25 03 30 10.29 55 26 04.1 0.92 47.5 2.0 27.9 1.7 1.08 .15 8.0 4.2 46 A3126 26 03 30 26.02 55 32 43.6 0.79 22.4 1.2 11.5 0.7 8.39 0.76 1.02 .10 A3126 27 03 30 30.64 55 55 59.6 0.89 92.5 3.3 55.8 3.4 1.02 .14 22. 2.6 126 A3126 28 03 31 19.77 55 48 11.8 1.01 5.8 0.8 3.49 0.30 1.03 .33 13. 1.8 55 A3126 29 03 31 34.45 55 33 33.6 1.15 19.7 1.2 11.6 0.9 1.07 .20 A3216 1 04 01 49.18 65 14 19.7 1.04 3.4 1.7 2.04 0.31 1.04 .06 A3216 2 04 02 21.46 65 11 40.9 0.79 12. 3.31 0.28 3.77 0.40 0.24 .25 10. 0.9 75 A3216 3 04 02 29.43 65 09 44.3 0.76 16. 1.72 0.16 1.41 0.25 0.37 .37 A3216 4 04 02 49.81 65 20 14.8 0.80 11. 2.29 0.16 1.6 A3216 5 04 03 14.57 65 06 53.7 0.56 16. 1.48 0.13 1.12 0.16 0.52 .31 A3216 6a 04 03 15.21 65 00 29.7 0.94 5.89 0.38 2.91 0.30 1.30 .23 11. 2.0 21 A3216 6b 04 03 13.50 65 00 53.4 0.92 3.18 0.24 0.98 0.29 2.18 .56 13. 7.3 45 A3216 6a/b 04 03 15.08 65 00 32.3 0.94 18.2 4.7 8.87 0.74 2.98 0.35 1.89 .22 26. 205 A3216 7 04 03 34.45 65 15 49.1 0.34 79.2 7.5 35.4 2.3 8.37 0.57 2.07 .08 34. 6. 60 7 A3216 8 04 04 15.23 65 21 55.8 0.67 21. 4.89 0.47 1.6 A3216 9 04 04 22.62 65 10 12.8 0.20 50.0 8.2 33.7 2.1 21.3 1.4 0.84 .14 6.0 4.2 156 A3216 10 04 04 35.27 65 03 42.9 0.66 14. 2.78 0.19 0.9 12. 4.1 82 A3216 11 04 05 08.12 65 14 29.3 0.48 68.5 11. 26.5 1.6 19.0 1.3 0.93 .14 C+ A3216 12 04 05 25.71 65 23 29.8 0.98 32.7 8.8 14.8 0.9 9.91 0.85 0.86 .17 C+ A3216 13 04 05 37.01 65 20 38.4 0.89 19. 5.20 0.35 4.20 0.42 0.40 .22 A3216 14 04 05 52.70 65 01 16.0 1.13 8.0 1.44 0.11 2.3 A3216 15 04 05 58.90 65 06 32.1 0.94 10. 8.26 0.51 20.1 1.5 1.64 .18 A3216 16 04 06 26.78 65 12 33.2 1.05 13. 4.04 0.27 3.20 0.55 0.43 .34 A3230 1 04 09 30.78 63 46 20.4 0.94 8.9 2.4 4.63 0.50 1.4 1.33 .59 12.6 6.9 143 A3230 2 04 09 43.81 63 48 35.5 0.92 11.2 2.1 5.71 0.35 5.11 0.36 0.44 .14 C+ A3230 3 04 09 57.36 63 48 55.3 0.84 11.2 2.0 6.21 0.42 4.48 0.35 0.75 .15 A3230 4 04 10 51.84 63 44 48.8 0.32 5.5 1.8 4.63 0.30 3.47 0.24 0.52 .16 A3230 5 04 11 13.05 63 57 15.8 1.12 3.8 2.43 0.20 1.7 A3230 6 04 11 18.86 63 31 48.7 0.72 4.2 1.3 1.57 0.11 0.5 2.0 .6 A3230 7 04 11 26.64 63 55 56.0 1.03 9.0 1.4 4.64 0.39 2.81 0.34 1.09 .19 A3230 8 04 11 28.34 63 41 06.9 0.08 20.6 1.4 9.12 0.57 2.84 0.19 1.92 .09 5.2 2.8 42 A3230 9 04 11 31.21 63 44 09.6 0.19 31.5 1.8 22.9 1.4 13.2 0.8 0.84 .08 21. 3.2 146 A3230 10 04 11 35.93 63 41 00.9 0.14 3.8 1.0 0.98 0.12 17. 3.2 113 A3230 11 04 11 50.07 63 47 41.4 0.49 3.8 2.71 0.22 1.76 0.13 0.80 .20 A3230 12 04 12 01.52 63 36 48.6 0.49 28.6 1.5 21.2 1.3 13.7 0.8 0.71 .08 3.5 2.5 138 A3230 13 04 12 03.35 63 43 43.8 0.37 93.1 3.4 57.4 3.5 28.5 1.7 1.13 .07 5.7 2.3 133 A3230 14 04 12 06.99 63 41 58.0 0.37 3.8 4.07 0.26 3.05 0.20 0.53 .17 A3230 15 04 12 21.84 63 34 10.5 0.74 12.1 1.6 7.39 0.46 5.01 0.33 0.80 .12 A3230 16 04 12 25.92 63 41 15.3 0.53 7.8 1.2 3.05 0.21 0.99 0.09 2.02 .16 A3230 17 04 13 19.84 63 36 32.6 1.03 5.4 1.9 3.88 0.29 3.20 0.23 0.39 .18 A3827 1 21 59 04.30 59 57 00.8 1.04 10.3 1.1 6.77 0.52 0.85 .27 A3827 2 21 59 12.62 59 46 45.6 1.11 54.3 2.1 36.5 2.3 0.81 .15 8.4 4.5 117 A3827 3 21 59 59.69 59 39 20.0 1.11 46.7 2.2 33.9 2.4 0.33 .10 C+ 8.7 4.6 39 8 A3827 4 22 00 04.67 59 49 02.6 0.78 8.1 0.9 4.84 0.42 4.75 0.60 0.54 .16 C+ A3827 5 22 00 34.62 59 41 01.6 0.92 8.8 1.4 2.44 0.23 6.75 0.91 +0.00: .20 C+? 9 A3827 6 22 00 42.54 60 07 26.6 0.68 21.6 1.2 13.1 0.8 7.49 0.84 1.02 .11 5.9 4.6 61 A3827 7 22 00 42.62 60 02 56.0 0.53 5.4 0.9 2.31 0.20 2.02 0.32 0.91 .22 C+ A3827 8 22 01 02.29 59 43 00.4 0.75 3.8 2.07 0.20 3.5 20. 12. 8 A3827 9 22 01 03.27 59 49 54.0 0.47 6.4 1.0 3.26 0.29 2.52 0.38 0.88 .21 13. 3.7 55 A3827 10 22 01 03.69 59 51 10.9 0.42 3.8 2.40 1.32 0.25 1.1 A3827 11a 22 01 08.37 59 40 14.8 0.86 265. 8. 152. 9. 78.4 4.8 1.167 .052 9.2 3.9 36 10 A3827 11b 22 01 11.59 59 39 23.2 0.90 204. 8. 91.4 5.5 33.9 2.2 1.72 .07 11. 2.6 40 A3827 11a/b 22 01 09.44 59 39 57.5 0.87 469. 16. 245. 15. 111. 7. 1.12: .04: Cpx 57. 25 11 A3827 12 22 01 17.07 59 57 55.1 0.24 2.6 0.9 0.88 0.13 0.70 0.19 1.10 .41 A3827 13 22 01 20.84 59 34 44.1 1.10 3.8 3.63 0.50 0.12 A3827 14 22 01 35.46 60 05 17.2 0.42 23.5 1.2 10.5 0.8 7.00 0.59 1.23 .09 C+ 20. 6. 59 A3827 15 22 01 37.27 60 08 04.0 0.55 3.8 1.62 0.26 2.1 A3827 16 22 01 41.42 60 02 53.6 0.30 3.8 1.34 0.13 0.8 A3827 17 22 01 43.30 59 56 04.5 0.09 3.8 0.91 0.17 0.9 A3827 18 22 01 47.45 59 51 35.3 0.27 3.8 0.56 0.12 1.13 0.22 1.30 .54
Table 2. (continued) Source Radio Centroid ang. S S S S S S Spectral Sp. Deconvolved Structure Name RA, DEC (J2000) dist. 0.843 GHz 1.38 GHz 2.38 GHz index cl. major minor P.A. Note h m s r/ mJy mJy mJy mJy mJy mJy ′′ ′′ ∘ (1) (2) (3) (4) (5) (6) (7) (8) (9) (10) (11) (12) (13) (14) (15) (16) (17) A3827 19 22 01 49.68 59 58 35.9 0.09 7.9 0.9 2.29 0.18 0.8 2.51 .28 A3827 20 22 01 52.17 60 13 42.1 0.81 5.4 0.9 1.87 0.32 2.15 .48 A3827 21 22 01 57.74 59 42 52.6 0.68 3.8 2.34 0.32 1.8 39. 6.9 15 A3827 22 22 02 00.72 59 52 57.0 0.20 6.6 1.1 5.15 0.42 3.70 0.33 0.58 .16 10.0 5.2 54 A3827 23 22 02 02.50 59 55 35.7 0.08 6.9 1.1 2.51 0.24 1.0 2.05 .38 A3827 24a 22 02 10.83 60 09 12.4 0.60 5.12 0.51 2.8 0.43 A3827 24b 22 02 14.56 60 08 42.5 0.58 3.48 0.45 2.8 1.2 A3827 24a/b 22 02 12.35 60 09 00.3 0.59 21.1 2.8 8.45 0.82 2.8 1.86 .33 41. 43 A3827 25 22 02 38.73 59 58 57.3 0.28 3.8 1.88 1.50 0.16 A3827 26 22 02 55.71 60 17 02.6 1.04 279. 10.4 157. 9.6 0.99 .08 22. 3.4 139 12 A3827 27 22 03 18.50 60 04 22.4 0.62 7.3 0.9 4.05 0.39 2.77 0.63 1.02 .23 13. 2.9 88 A3827 28 22 03 38.12 59 43 58.7 0.89 13.2 1.4 5.92 0.54 1.63 .28 A3827 29 22 03 38.52 59 41 37.7 0.97 10.5 1.0 4.61 0.56 1.67 .31 A3827 30 22 04 34.32 59 56 26.4 0.96 6.3 0.6 3.93 0.64 0.96 .38 A3836 1 22 07 18.96 51 47 34.4 1.03 11.0 1.1 6.44 0.48 1.09 .25 A3836 2 22 07 51.85 51 57 12.8 0.88 6.1 1.2 2.80 0.27 1.58 .45 A3836 3 22 08 02.31 51 47 31.6 0.67 3.8 1.52 0.22 1.4 A3836 4 22 08 33.58 51 43 50.6 0.49 11.4 1.2 6.83 0.49 4.20 0.42 0.96 .14 A3836 5 22 08 39.71 52 02 08.5 0.79 19.5 1.4 9.31 0.62 5.11 0.72 1.36 .14 A3836 6 22 08 51.91 51 37 01.4 0.69 3.8 1.66 0.14 1.8 A3836 7 22 08 58.47 51 45 09.1 0.29 10.5 1.4 8.97 0.57 5.09 0.39 0.82 .14 A3836 8 22 09 12.57 51 30 57.0 0.96 16.5 1.4 7.22 0.58 1.68 .24 A3836 9a 22 09 19.01 51 42 55.7 0.32 4.61 0.38 2.68 0.22 1.00 .21 A3836 9b 22 09 17.07 51 43 24.0 0.30 2.51 0.32 1.76 0.18 0.66 .30 A3836 9a/b 22 09 18.28 51 43 06.3 0.31 15.3 1.3 6.41 0.80 4.23 0.33 1.23 .11 34. 213 A3836 10 22 09 18.66 52 10 14.8 1.14 11.7 1.2 7.04 0.62 1.03 .27 A3836 11 22 09 19.07 51 50 54.9 0.11 15.0 1.4 8.15 0.52 4.21 0.38 1.23 .12 A3836 12 22 09 22.96 51 56 05.7 0.38 2.5 0.7 0.84 0.13 1.0 2.2 .7 A3836 13 22 09 26.52 51 49 12.4 0.03 3.8 1.07 0.16 0.8 A3836 14 22 09 32.15 51 37 30.4 0.61 3.8 0.95 0.17 1.8 A3836 15 22 09 52.28 52 04 40.7 0.88 4.5 0.9 1.31 0.16 3.2 2.50 .47 A3836 16 22 09 53.81 51 48 21.3 0.25 3.8 1.21 0.13 0.83 0.17 0.70 .43 A3836 17 22 09 57.09 51 42 30.5 0.44 4.4 1.4 2.02 0.23 1.2 1.58 .69 34. 5.1 140 A3836 18 22 10 03.40 51 53 14.3 0.40 2.7 0.8 1.09 0.12 1.45 0.26 0.18 .30 C+ 13 A3836 19a 22 10 05.36 51 40 09.0 0.58 26.6 1.6 14.7 1.0 1.10 .17 6.2 4.3 147 A3836 19b 22 10 02.26 51 39 36.0 0.59 13.5 0.9 5.57 0.64 1.64 .25 17. 3.1 158 A3836 19a/b 22 10 04.43 51 39 59.0 0.59 59.2 5.6 39.7 2.4 19.5 1.3 1.12 .11 44. 319 A3836 20 22 10 07.88 51 55 07.0 0.50 3.8 1.46 0.18 1.00 0.17 0.70 .39 A3836 21 22 10 12.25 52 00 06.8 0.72 4.7 1.2 3.62 0.35 2.40 0.44 0.68 .29 A3836 22 22 10 59.46 51 42 27.6 0.87 4.6 1.0 2.36 0.26 2.8 1.35 .49 11. 4.0 123 A3836 23 22 11 03.67 51 35 39.6 1.09 4.2 1.1 2.18 0.25 1.33 .58 A3836 24 22 11 15.03 51 58 00.5 1.04 80.1 2.8 37.5 2.4 18.8 2.8 1.47 .11 7.9 2.0 121
Description of columns: (1) Source name, composed of the Abell cluster name, followed by a sequence number. For multiple component sources we list both individual components and integrated parameters. (2,3) Right ascension and declination (equinox J2000.0) for the radio centroid. (4) Projected angular distance of the source centroid in units of Abell radii (cf. Table 1). (5,6) Total flux density at 0.843 GHz and its error. (7,8) Total flux density at 1.38 GHz and its error. (9,10) Total flux density at 2.38 GHz and its error. (11,12) Spectral index () and its error. These are based on either 2-frequency pairs (0.843–1.38, 0.843–2.38 or 1.38–2.38 GHz), or linear fits based on up to five frequency bands, the others being 0.408 (MRC), 4.8 (PMN/PMNAT) and 8.64 GHz (PMNAT). A colon after the spectral index indicates an uncertain value. (13) Radio spectral shape, if available and different from a straight power law (see Sect. 4.1). (14,15) Deconvolved major and minor axis of an elliptical fit to the source, in arcsec, from either the 1.38 or the 2.38-GHz maps, see Sect. 3.2. (16) Position angle of source major axis (N through E), in degrees. (17) Notes on other names or spectral shape: 1: PMN J00458014; 2: PMN J00498027; 3: S(1.38MHz) too low? variable?; 4: PMN and PMNM J03265532; PMNAT; 5: S(1.38MHz) too low? variable?; 6: PMN J03295532; PMNAT; 7: MC4 0403653; 8: PMN J21595939; 9: S(1.38MHz) too low? variable?; 10: MRC 2157599; PMN J22015940; PMNAT; 11: MRC 2157599; PMN J22015940; 12: PMN J22026017; 13: S(1.38MHz) too low? variable? References to acronyms are: MRC = Large et al. (1991); MC4 = Clarke et al. (1976); PMN = Wright et al. (1994); PMNM = Gregory et al. (1994); PMNAT = Wright et al. (1997, ftp.atnf.csiro.au/pub/data/pmn/CA). Note that we do NOT quote the SUMSS catalogue names here.
| Source | Optical Objects near Radio Source | ||||||||
| Name | Morph. | UKST | UKST | Dist. | P.A. | log P1.38 | Note | ||
| Class | R | ′′ | ∘ | W Hz-1 | mag | ||||
| (1) | (2) | (3) | (4) | (5) | (6) | (7) | (8) | (9) | (10) |
| A2746 2a/b | G | 22.04 | 19.61 | 7 | 240 | * | |||
| A2746 5 | cD | 17.60 | 15.89 | 0 | 23.69 | 23.71 | |||
| A2746 8 | St | 21.62 | 1 | 68 | * | ||||
| A2746 11 | G | 21.07 | 18.66 | 2 | 201 | 22.96 | 20.94 | ||
| A2746 13 | E | 19.93 | 17.95 | 1 | 139 | 23.16 | 21.65 | ||
| A2837 1 | E | 20.80 | 18.92 | 1 | 46 | * | |||
| A2837 3 | St | 21.83 | 19.69 | 5 | 66 | ||||
| A2837 6 | G | 19.97 | 18.22 | 3 | 286 | 23.55 | 20.64 | * | |
| A2837 8 | B | * | |||||||
| A2837 9 | G | 21.49 | 19.30 | 2 | 98 | * | |||
| A2837 10 | G | 21.67 | 19.65 | 1 | 326 | * | |||
| A2837 11 | G | 20.06 | 19.47 | 8 | 68 | * | |||
| A2837 12 | E | 18.61 | 16.91 | 1 | 287 | 22.55 | 21.95 | ||
| A2837 14 | G | 21.24 | 19.08 | 4 | 56 | * | |||
| A2837 16 | G | 21.56 | 19.87 | 0 | |||||
| A2837 17 | G | 21.56 | 19.55 | 3 | 270 | ||||
| A2837 19 | St | 18.94 | 18.74 | 3 | 119 | ||||
| A3126 2 | B | * | |||||||
| A3126 8 | St | 21.83 | 19.56 | 1 | 94 | ||||
| A3126 9 | D | 15.70 | 14.19 | 1 | 58 | 22.85 | 23.84 | * | |
| A3126 10a/b | B | * | |||||||
| A3126 11 | 2xE | 17.06 | 16.17 | 5 | 94 | 22.17 | 21.86 | ||
| A3126 12 | G | 21.05 | 19.72 | 3 | 88 | ||||
| A3126 13 | E | 16.86 | 15.45 | 6 | 345 | .0849(1,2) | 23.99 | 22.58 | * |
| A3126 16 | E | 16.49 | 15.11 | 1 | 109 | .0833(1,2) | 23.50 | 22.92 | * |
| A3126 17 | St | 19.29 | 18.78 | 1 | 144 | ||||
| A3126 19 | St | 21.04 | 20.03 | 3 | 318 | ||||
| A3126 20 | E | 18.63 | 17.27 | 8 | 190 | .0785 (2) | 22.32 | 20.76 | |
| A3126 22 | G | 19.19 | 17.87 | 6 | 275 | ||||
| A3126 25 | St | 20.54 | 18.50 | 6 | 341 | * | |||
| A3126 27 | G | 21.26 | 19.47 | 1 | 324 | * | |||
| A3126 28 | G | 20.74 | 18.74 | 5 | 200 | * | |||
| A3216 2 | E | 18.84 | 17.57 | 1 | 279 | 23.24 | 22.09 | * | |
| A3216 4 | E | 18.69 | 17.29 | 1 | 13 | 23.07 | 22.37 | ||
| A3216 6a/b | G | 20.02 | 17.84 | 1 | 290 | 23.54 | 21.82 | * | |
| A3216 7 | G | 21.02 | 19.26 | 16 | 64 | * | |||
| A3216 9 | G | 18.05 | 16.44 | 2 | 237 | .1581 (3) | 24.18 | 23.22 | * |
| A3216 10 | G | 19.25 | 17.52 | 9 | 91 | 23.09 | 22.14 | * | |
| A3216 14 | B | * | |||||||
| A3216 15 | St | 19.56 | 18.28 | 1 | 287 | ||||
| A3230 1 | E/S0 | 18.60 | 17.11 | 21 | 126 | 23.31 | 22.57 | * | |
| A3230 2 | G | 19.87 | 18.37 | 4 | 287 | 23.46 | 21.31 | ||
| A3230 4 | E | 18.32 | 16.56 | 3 | 245 | 23.36 | 23.12 | * | |
| A3230 5 | E | 20.38 | 18.33 | 3 | 277 | 23.05 | 21.35 | ||
| A3230 7 | E | 20.39 | 19.00 | 3 | 234 | 23.33 | 20.68 | ||
| A3230 8 | cD | 17.51 | 15.68 | 1 | 222 | 23.57 | 24.00 | ||
| A3230 9 | St | 22.14 | 20.32 | 6 | 326 | * | |||
| A3230 11 | E | 19.12 | 17.08 | 1 | 170 | 23.11 | 22.60 | * | |
| A3230 14 | G | 21.20 | 18.66 | 1 | 267 | 23.31 | 21.02 | ||
| A3827 2 | B | * | |||||||
| A3827 3 | St | 19.73 | 18.10 | 3 | 77 | * | |||
| A3827 4 | E | 17.61 | 15.99 | 4 | 336 | 22.95 | 22.44 | * | |
| A3827 5 | E | 19.86 | 17.87 | 3 | 17 | 22.67 | 20.56 | ||
| A3827 8 | E | 18.09 | 16.80 | 11 | 343 | 22.65 | 22.36 | * | |
| A3827 10 | E | 17.60 | 16.07 | 1 | 82 | .0967 (4) | 22.41 | 22.36 | |
| A3827 11a/b | B | * | |||||||
| A3827 12 | 2xE | 18.70 | 16.53 | 3 | 290 | .0931 (4) | 22.19 | 21.90 | |
| A3827 14 | B | * | |||||||
| A3827 18 | G | 22.12 | 20.78 | 3 | 41 | ||||
| A3827 20 | E/S0 | 18.41 | 16.95 | 3 | 348 | 22.47 | 21.48 | ||
| A3827 21 | G | 21.35 | 18.61 | 5 | 33 | * | |||
| Table 3. (continued) | |||||||||
| Source | Optical Objects near Radio Source | ||||||||
| Name | Morph. | UKST | UKST | Dist. | P.A. | log P1.38 | Note | ||
| Class | R | ′′ | ∘ | W Hz-1 | mag | ||||
| (1) | (2) | (3) | (4) | (5) | (6) | (7) | (8) | (9) | (10) |
| A3827 22 | G | 21.21 | 18.60 | 1 | 308 | ||||
| A3827 23 | St | 22.13 | 19.85 | 2 | 51 | ||||
| A3827 24a/b | Sp | 19.06 | 17.97 | 30 | 46 | * | |||
| A3827 25 | E | 18.07 | 16.59 | 1 | 22 | .0988 (4) | 22.46 | 21.84 | |
| A3827 26 | B | * | |||||||
| A3827 30 | St | 22.29 | 20.47 | 4 | 67 | ||||
| A3836 1 | St | 21.20 | 19.46 | 5 | 304 | ||||
| A3836 4 | Sp | 17.40 | 16.39 | 0 | .0647(5,6) | 22.73 n | 20.99 n | ||
| A3836 8 | St | 19.93 | 18.40 | 4 | 168 | ||||
| A3836 9a/b | B | * | |||||||
| A3836 13 | E | ? | 16.92 | 2 | 249 | 22.39 | 21.73 | ||
| A3836 16 | Sp | 16.90 | 15.84 | 2 | 59 | .0365 (6) | 21.49 n | 20.21 n | |
| A3836 17 | B | * | |||||||
| A3836 18 | G | 20.46 | 18.94 | 2 | 310 | ||||
| A3836 19a/b | G | 21.66 | 19.52 | 15 | 311 | * | |||
| A3836 22 | D | ? | 15.58 | 3 | 17 | 22.70 | 23.07 | ||
Description of columns: (1) Source name, composed of Abell cluster name, followed by a sequence number. Multiple-component sources are listed only with one entry for the integrated source. (2) morphological class of the optical identification (ID): St = stellar, G = galaxy of unknown type, E = elliptical galaxy, S0 = S0 galaxy, Sp = spiral galaxy, D= D galaxy; cD = cD galaxy; 2xE = two adjacent elliptical galaxies; B = blank field; (3) magnitude from SuperCOSMOS database; a question mark indicates a bright object but an unreliable value of ; (4) magnitude from SuperCOSMOS database; The UK Schmidt red magnitudes are listed under R2 in SuperCOSMOS. R1 refers to ESO. (5) angular distance of the optical ID from the radio source position, in arcsec; (6) position angle of the radius vector from the radio source to the optical ID, from N through E; (7) redshift of the optical ID in the galactocentric frame, i.e. zLG= c zhel+ 300 km s-1 sin cos b, with numbers in brackets referrring to the following references: 1. Lucey et al. (1983); 2. Colless & Hewett (1987); 3. Jones et al. (2004); 4. Katgert et al. (1998); 5. de Grijp et al. (1992); 6. Ebeling (1997); (8) log10 of the 1.38-GHz radio power in W Hz-1, assuming the redshift of the cluster as indicated in Table 1; for IDs not considered cluster members the value is appended by a letter “n”. (9) absolute magnitude for the optical ID, assuming the redshift of the cluster as indicated in Table 1. Note that galaxy identifications are considered as cluster members only if their absolute R-band magnitudes, when obtained by applying the cluster redshift (in Table 1) to the apparent red magnitude, is brighter than 20.5. For IDs not considered cluster members the value is appended by a letter “n”. (10) Notes to individual sources, see Section 3.4.
Online Material
Cleaned 1.38-GHz maps of A2746, A2837, A3126, A3216, A3230 and A3827 (uncorrected for primary beam attenuation) centred on the X-ray centroid marked “X”, and covering an area of between 3636′ and 4848′. The dashed circles mark the Abell radius (2.0 Mpc for the adopted cosmology, cf. also Table 1), and the radio sources are numbered according to their entries in Tables 2 and 3. The size and orientation of the restoring beam is shown in the lower left corner and listed numerically underneath each figure, as is the level of the lowest and highest contours. The rms noise over clear areas near the centre is listed in the penultimate column of Table 1. The primary beam width (FWHM) at 1.38 GHz is 32′.