Truncated Moments of Structure Functions
Abstract
We present a novel new approach to study quark-hadron duality using truncated moments of structure functions, and determine the degree to which individual resonance regions are dominated by leading twist.
pacs:
25.30.Bf, 13.40.Gp, 14.20.DhI Introduction
In physics of strong nuclear interactions, the observed hadrons at low energies can be described in terms of meson and baryon degrees of freedom, while at high energies the description is formulated in terms of quarks and gluons. Quark-hadron duality is an intriguing phenomenon which, by connecting the two energy regimes, provides a dual description of hadronic variables. Its understanding, however, still represents a fundamental challenge.
In Ref. Psaker we present a novel new approach to study quark-hadron duality using truncated moments of structure functions, or the integrals of structure functions over restricted regions of Bjorken variable . In particular, by studying the evolution of structure functions integrated over specific nucleon resonance regions, where is the virtuality of the exchanged photon, we determine the degree to which individual resonance regions are dominated by leading twist, and hence quantify their higher twist content.
The phenomenon of quark-hadron duality was first observed in inclusive electron-nucleon scattering at SLAC by Bloom and Gilman in 1970 BG . It reflects the similarity between structure functions averaged over the resonance region and the scaling, or leading twist function. The former is characterized by hadronic bound states, whereas the latter describes the high energy deep inelastic continuum, in other words, scattering from free quarks MEK . The oscillation of nucleon resonances around the scaling curve shows that hadrons follow the QCD scaling behavior. The only rigorous interpretation of the so-called Bloom-Gilman duality within the theoretical framework has been done in terms of the moments of structure functions. They were analyzed within the QCD operator product (or twist) expansion. Here the leading term in expansion is given by matrix elements of leading twist quark-gluon bilocal operators, and is associated with free quark scattering. Furthermore, higher terms in the expansion correspond to nonperturbative (higher twist) quark-gluon interactions. In this language duality is explained as the suppression of higher twist contributions to the moments DGP .
Experimental data from recent years Niculescu suggest that quark-hadron duality not only exists over the whole resonance region but also locally. It holds over restricted regions of hadronic final state mass , or even for individual resonances. Nevertheless, any insight about workings of local duality has been confined to QCD-inspired models of the nucleon. As such our understanding of quark-hadron duality in nucleon structure functions within QCD is incomplete.
Many earlier analyses of duality within a QCD context have used full moments of structure functions and hence quantified the higher twist content over all region of . Our approach, on the other hand, allows one to study for the first time the distribution of higher twist corrections over various regions in (or ) in a well-defined systematic way.
II Truncated Moments and Evolution
In analogy with full moments, e.g. of a parton distribution function (PDF) ,
| (1) |
truncated moments are defined as:
| (2) |
where the integration over the Bjorken variable is restricted to . By truncating the integration region to some minimum value , one avoids the problem of extrapolating parton distributions into unmeasured regions at small . Several years ago this original idea was introduced to study structure function moments for which small- data were not available Forte . Note that is related to the invariant mass squared of the virtual photon-hadron system through , where is the nucleon mass. Thus an infinite energy is required to reach the limit, and accordingly some extrapolation to is always needed in practice to evaluate the moment. Unlike full moments, truncated moments satisfy the evolution equations, which mix the lower moments with the higher ones.
An alternative approach, the so-called diagonal formulation of truncated moments, was later developed to avoid the complication of mixing Kotlorz . It was shown that truncated moments obey the DGLAP evolution with a modified splitting function in the Mellin convolution. Namely,
| (3) |
where
| (4) |
plays the role of the splitting function for the truncated moments. Moreover, by introducing the doubly-truncated moment of ,
| (5) |
the evolution equations for truncated moments can be generalized to any subset in the -region, .
In our work we partially follow the latter approach and apply it to the study of the proton structure function in the large- region, populated by nucleon resonances. We use recent high-precision data from Jefferson Lab experiment E91-110 F2data , and quantify the size of the higher twists for the lowest three moments in various regions of GeV. By dividing the data into the three traditional resonance regions we extract the leading and higher twist content of each region.
III Data Analysis and Extraction of Higher Twists
In order to determine the degree to which nucleon structure function data in specific regions in (or ) are dominated by leading twist we first evolve the structure functions by brute-force using a suitable numerical integration routine, apply the target mass corrections (TMCs), and finally calculate their corresponding truncated moments over the integration range , where is the inelastic threshold. Deviations of the evolved moments, computed to next-to-leading order (NLO) accuracy, from the experimental data at the new then reveal any higher twist contributions in the original data. In particular, we analyze recent data on from Jefferson Lab covering a range in from GeV2 to 6 GeV2.
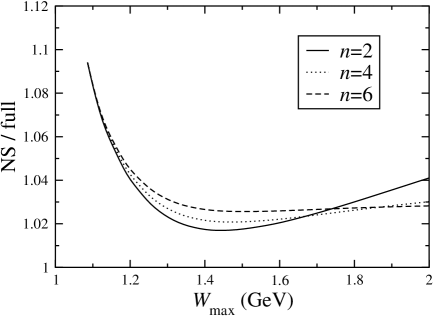
The evolution of the measured truncated moments requires the structure function to be decomposed into its nonsinglet and singlet components, which are a priori unknown. We shall assume that in our region of interest (i.e. at moderate to large ) the structure function is well approximated by its nonsinglet component, and hence will evolve the truncated moments as nonsinglets. To test the accuracy of the nonsinglet (NS) evolution versus the full or exact evolution we use the trial function, whose decomposition into its nonsinglet and singlet components is known. In our case this is the leading twist proton structure function computed from the MRST2004 PDF fit MRST2004 . First we evolve its nonsinglet and singlet components separately and then construct the full function, and secondly we evolve the trial function under the assumption that the total function can be treated as a nonsinglet. The comparison between the truncated moments calculated from the two evolutions gives the accuracy of the NS evolution of the various moments with respect to the exact results using both singlet and nonsinglet evolution. The ratios of these are plotted in Fig. 1 as a function of the truncation point . In the traditional nucleon resonance region, GeV, the differences between the full and NS evolution are of the order 2–4% and increase with increasing . The moment is most sensitive to singlet evolution. As expected, the differences are smaller for the higher moments. Thus in the region relevant for our study one can therefore conclude that the evolution error, or the uncertainty introduced by evolving the truncated moments as nonsinglets, is less than 4%, which will be included in the errors in our final results.
In the analysis we assume that the data beyond some large value of (in our case GeV2) are dominated by twist-2 contributions, which is consistent with most global analyses of PDFs. For example, a comparison of the DIS data fit shows the excellent agreement between the leading twist structure function, after correcting for TMCs, and the data at this scale. Moreover, we observe that the inclusion of TMCs has to be properly accounted for before drawing any conclusions about higher twists from data. To quantify the higher twist content of the specific resonance regions, and at different values of , we consider several intervals in : 1.9 GeV2, corresponding to the traditional (or first) resonance region; GeV2 for the (or second) resonance region; and GeV2 for the (or third) resonance region. The truncated moments corresponding to these regions are plotted in Fig. 2 for various values. It’s worth noting that below GeV2 the applicability of a pQCD analysis becomes doubtful and the decomposition into leading and higher twists is no longer reliable.
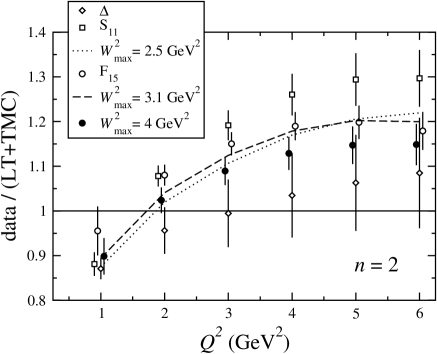
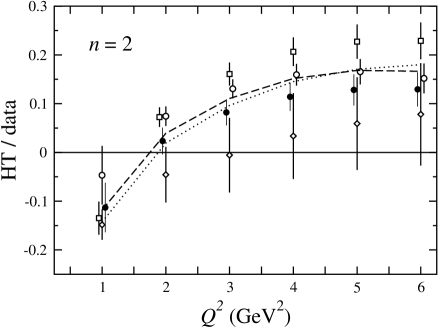
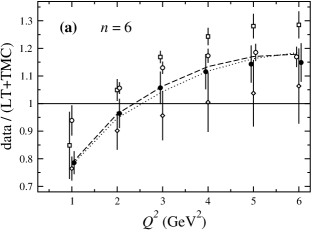
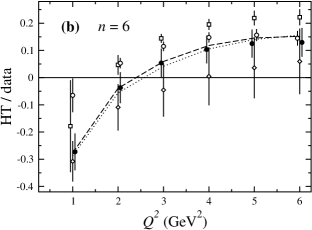
The entire resonance region data (filled circles in Fig. 2) deviate from leading twist behavior at the level of for all values of with a significant dependence for GeV2, which is made more explicit in Fig. 3. Here the higher twist contributions to , defined as the difference between the total and leading twist moments, are shown as ratios of the moments evaluated from the data. The strong dependence of the higher twists is evident in the change of sign around GeV2, with the higher twists going from at GeV2 to –15% for GeV2. The higher twists, as expected, decrease at larger once the leading twist component of the moments begins to dominate.
Looking at the individual resonance regions we see that in the region (diamonds) the higher twist contributions are smallest in magnitude at large , while they are largest for the region (squares). Combined, the higher twist contribution from the first two resonance regions (dotted curve) is in magnitude for all . Furthermore, the higher twist content of the region (open circles) is similar to the at low , however, it decreases more rapidly for GeV2. The higher twist content of the first three resonance regions combined (dashed curve) is –20% in magnitude for GeV2. Finally, integrating up to GeV2 (filled circles), the data on the truncated moment are found to be leading twist dominated at the level of 85–90% over the entire range.
The results in Figs. 2 and 3 contain the experimental uncertainty on the data (statistical and systematic), and the uncertainty from the NS evolution of the data. For the experimental error we take an overall uncertainty of 2% for all truncated moment data, except for the and moments at and 4 GeV2. Here the experimental uncertainties are 4% and 3% for , and 5% and 4.5% for . The evolution error, on the other hand, is estimated by comparing the NS evolution with the full evolution using the MRST2004 fit, as in Fig. 1, with the appropriate correction factor applied at each and interval.
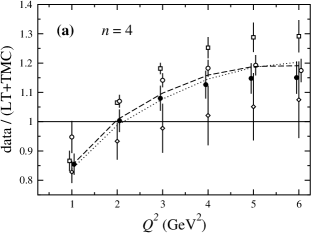
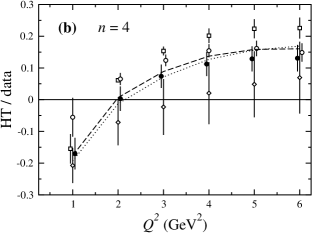
For the higher moments, illustrated in Figs. 4 and 5, the overall magnitude of the higher twists is qualitatively similar to the moments, although the values at which they start decreasing in importance are larger. In addition, the higher twist contributions at low are relatively larger for higher moments. For example, at GeV2 the magnitude of the higher twist component of the GeV2 region increases from for the moment, to –20% for , and –30% for . This behavior can be understood from the relatively greater role played by the nucleon resonances in the large- region, which is emphasized more by the (-weighted) higher moments.
IV Summary and Outlook
Truncated moments of structure functions provide a firm foundation for the quantitative study of local quark-hadron duality within a perturbative QCD context. In this analysis we have precisely determined the degree to which duality holds as a function of in various resonance regions (i.e. the degree to which individual resonance regions are dominated by leading twist), and have calculated for the first time their higher twist content. In case of the truncated moment of the proton structure function we find that deviations from leading twist behavior in the resonance region ( GeV) are at the level of for GeV2. Morevover, there is a significant dependence in the ratio of moments of data to leading twist for GeV2, with the higher twists changing sign around GeV2. Our results indicate that in the second and third resonance regions the higher twist component is larger in magnitude than in the resonance region. Similar behavior to the truncated moments is found for the and truncated moments, however, here due to the large- enhancement the resonances play relatively greater role, which then leads to larger higher twists at the same . In addition, we have also quantified the uncertainty associated with evolving the structure function data as a nonsinglet, which was found to be .
The illustrated analysis is an encouraging new approach to understanding local Bloom-Gilman duality within a well-defined theoretical framework. It opens the way to further study of local duality in other structure functions, such as the longitudinal structure function or spin-dependent structure functions.
Acknowledgements.
I would like to thank Wally Melnitchouk, Cynthia Keppel and Eric Christy for their collaboration on the truncated moment analysis presented here.References
- (1) A. Psaker, W. Melnitchouk, M. E. Christy and C. Keppel, Phys. Rev. C 78, 025206 (2008) [arXiv:0803.2055].
- (2) E. D. Bloom and F. J. Gilman, Phys. Rev. Lett. 25, 1140 (1970).
- (3) W. Melnitchouk, R. Ent and C. Keppel, Phys. Rept. 406, 127 (2005) [arXiv:hep-ph/0501217].
- (4) A. De Rujula, H. Georgi and H. D. Politzer, Annals Phys. 103, 315 (1977).
- (5) I. Niculescu et al., Phys. Rev. Lett. 85, 1186 (2000).
- (6) S. Forte and L. Magnea, Phys. Lett. B 448, 295 (1999) [arXiv:hep-ph/9812479]; S. Forte, L. Magnea, A. Piccione and G. Ridolfi, Nucl. Phys. B 594, 46 (2001) [arXiv:hep-ph/0006273]; A. Piccione, Phys. Lett. B 518, 207 (2001) [arXiv:hep-ph/0107108].
- (7) D. Kotlorz and A. Kotlorz, Phys. Lett. B 644, 284 (2007) [arXiv:hep-ph/0610282].
- (8) Y. Liang et al. [JLab Experiment E94-110], arXiv:nucl-ex/0410027.
- (9) M. Miyama and S. Kumano, Comput. Phys. Commun. 94, 185 (1996) [arXiv:hep-ph/9508246]; S. Kumano and T. H. Nagai, J. Comput. Phys. 201, 651 (2004) [arXiv:hep-ph/0405160].
- (10) A. D. Martin, R. G. Roberts, W. J. Stirling and R. S. Thorne, Phys. Lett. B 604, 61 (2004) [arXiv:hep-ph/0410230].